Close Rates in 2026: How to Measure and Improve Them
Close rates reveal whether your pipeline is healthy or quietly leaking revenue. Here's how to measure them, benchmark against your industry, and close more deals in 2026.
Your close rate is the single number that tells you whether your sales motion actually works. Everything upstream — the ads, the SDR calls, the demos — only matters if deals cross the finish line. Yet most teams either measure close rates wrong or never diagnose why they stall. This guide fixes both.
TL;DR#
- Close rate = deals won ÷ qualified opportunities, expressed as a percentage. Pick one denominator and stick to it, or your trend line lies to you.
- A "good" close rate is 20–30% for most B2B teams, but it swings wildly by industry, deal size, and lead source — benchmark against yourself first.
- The biggest close-rate killers are bad data, slow follow-up, and unqualified pipeline — not weak closing scripts.
- Fixing the top of the funnel (accurate contact data, tighter qualification) usually moves close rates more than any late-stage tactic.
- Track close rate by segment (rep, source, deal size) — the blended average hides the leaks you can actually fix.
What is a close rate, exactly?#
A close rate is the percentage of sales opportunities that turn into won deals over a given period. Think of it like a batting average: it doesn't matter how many times you step up to the plate if you rarely connect. The formula is simple:
Close rate = (Deals won ÷ Total qualified opportunities) × 100
If you worked 100 qualified opportunities last quarter and closed 24, your close rate is 24%.
The trap is the denominator. Some teams divide by leads, others by qualified opportunities, others by proposals sent. Each produces a very different number, and mixing them across months makes your trend meaningless. Decide what counts as an "opportunity" — usually a lead that passed qualification and entered your pipeline — and apply it consistently.
Close rate is a cousin of, but not the same as, win rate. Win rate typically measures deals won against deals that reached a decision (won + lost), excluding deals that stalled or went dark. Close rate often includes everything that entered the funnel. Both are useful; just label them clearly so nobody in a QBR argues about which number is "real."
How do you calculate close rate the right way?#
Follow four steps and you'll avoid the errors that make most dashboards untrustworthy.
- Define the opportunity stage. Draw a clear line in your CRM — for example, "opportunity created" means budget, authority, need, and timeline are confirmed. Everything before that is a lead, not an opportunity.
- Pick a fixed time window. Use the period the deal closed in, not when it was created, for a clean rate. For cohort analysis, track a group of opportunities created in the same month until they all resolve.
- Count only resolved deals for win-based rates. If you want a true win rate, exclude deals still open. Including in-progress deals deflates the number artificially.
- Segment before you average. Calculate the rate per rep, per lead source, and per deal-size band. The blended figure is where insights go to die.
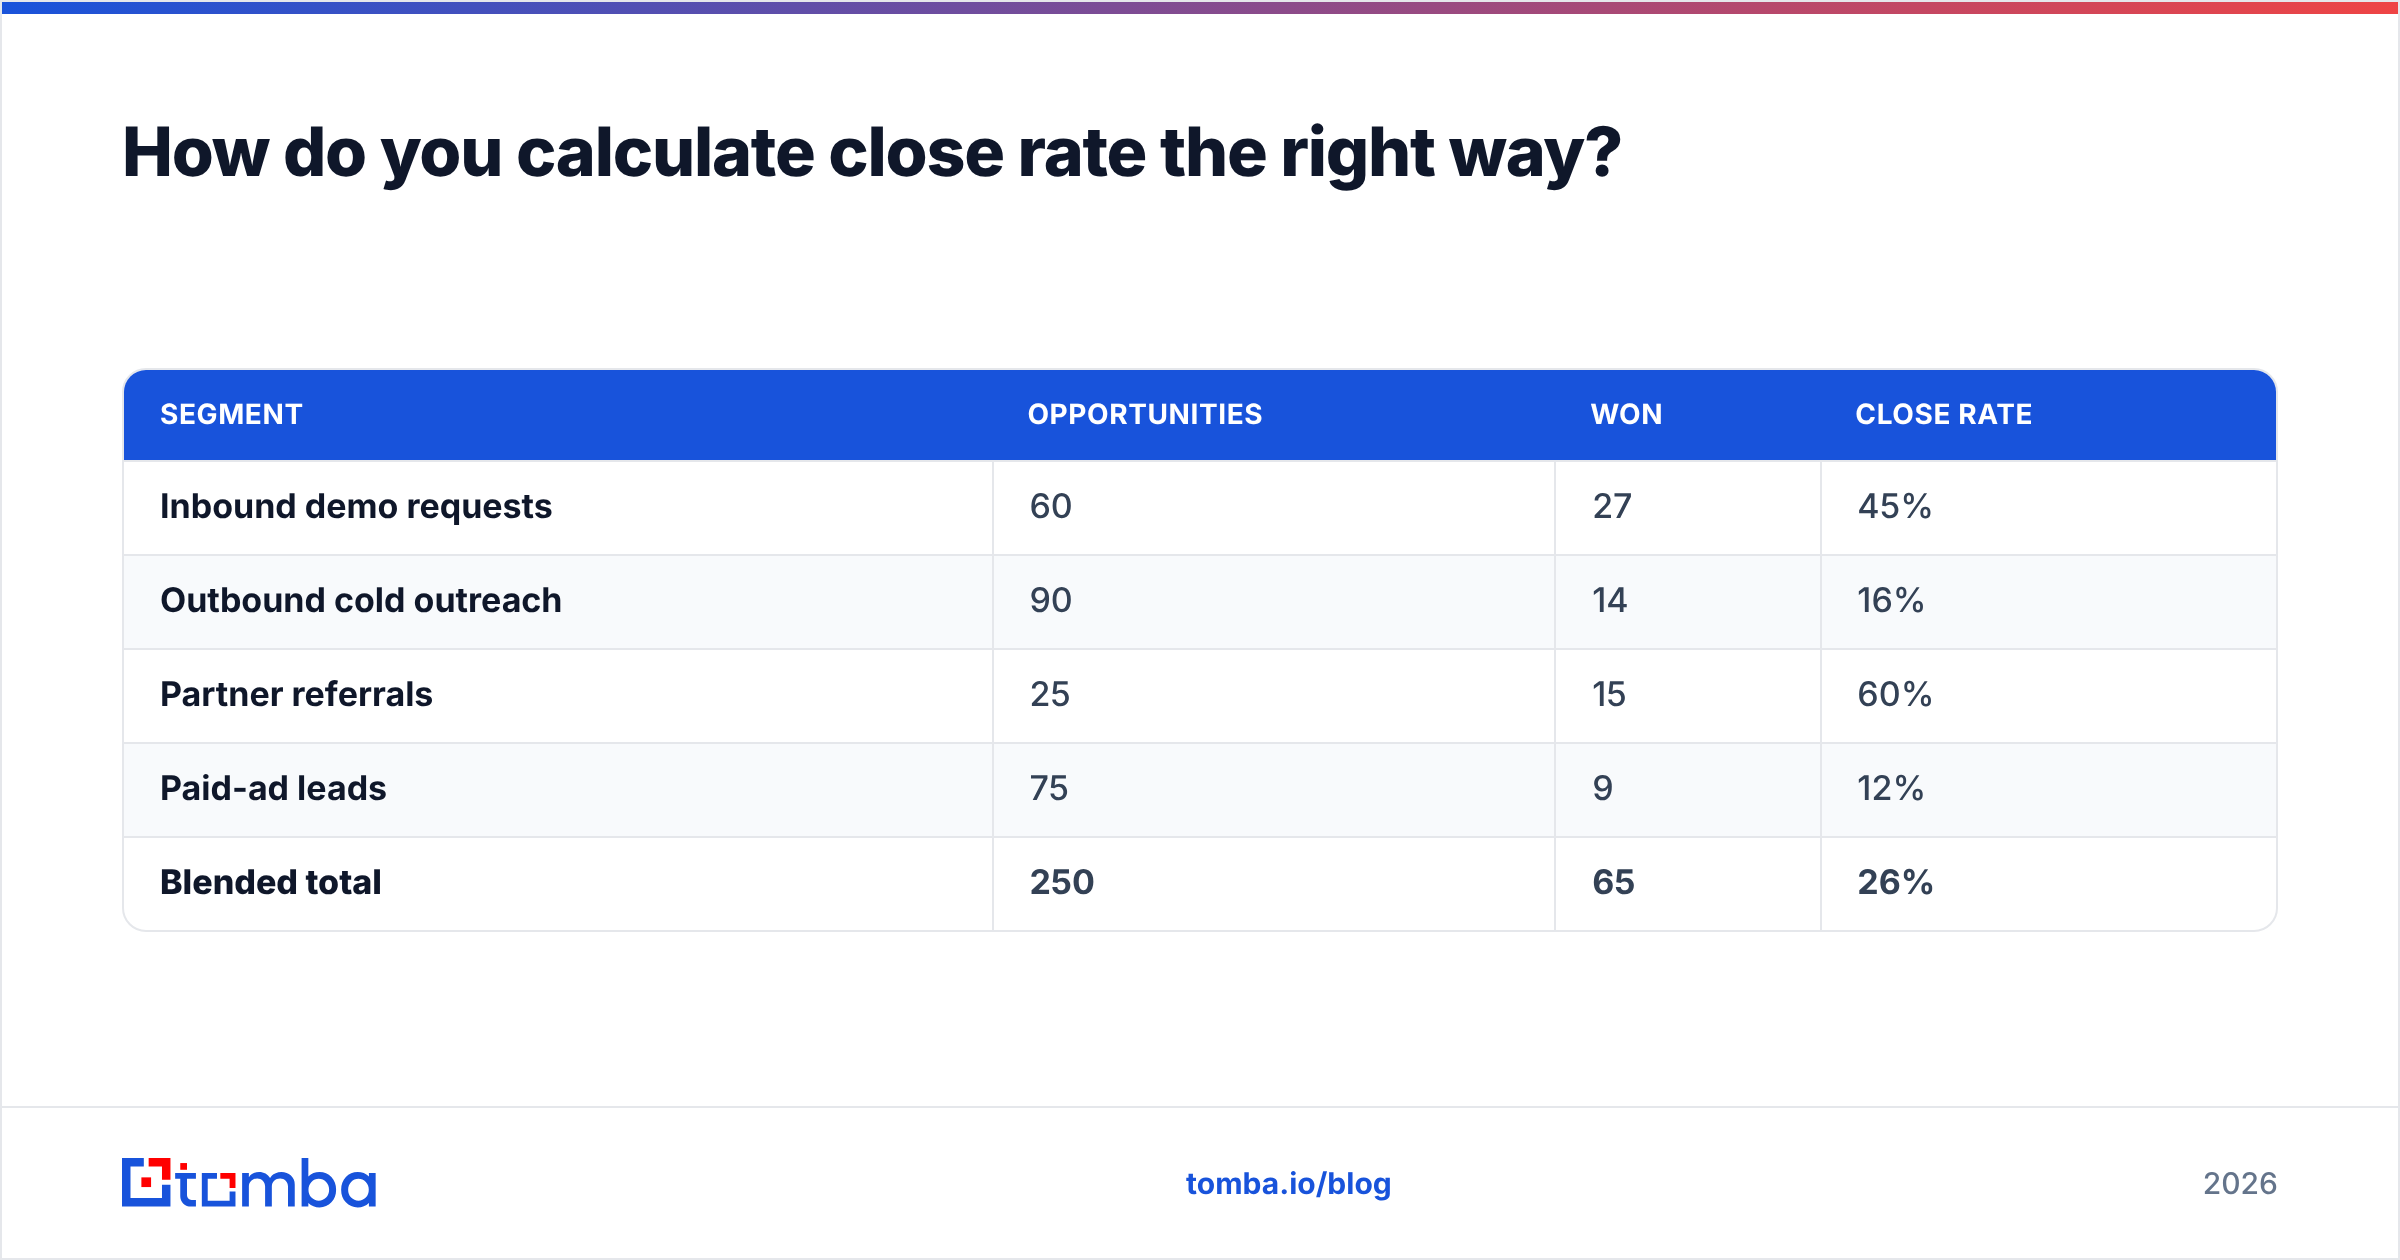
Here's the difference segmentation reveals:
| Segment | Opportunities | Won | Close rate |
|---|---|---|---|
| Inbound demo requests | 60 | 27 | 45% |
| Outbound cold outreach | 90 | 14 | 16% |
| Partner referrals | 25 | 15 | 60% |
| Paid-ad leads | 75 | 9 | 12% |
| Blended total | 250 | 65 | 26% |
The blended 26% looks healthy. But the paid-ad channel is bleeding money at 12%, and referrals are your hidden gold mine. Without segmentation you'd never know where to invest.
What is a good close rate in 2026?#
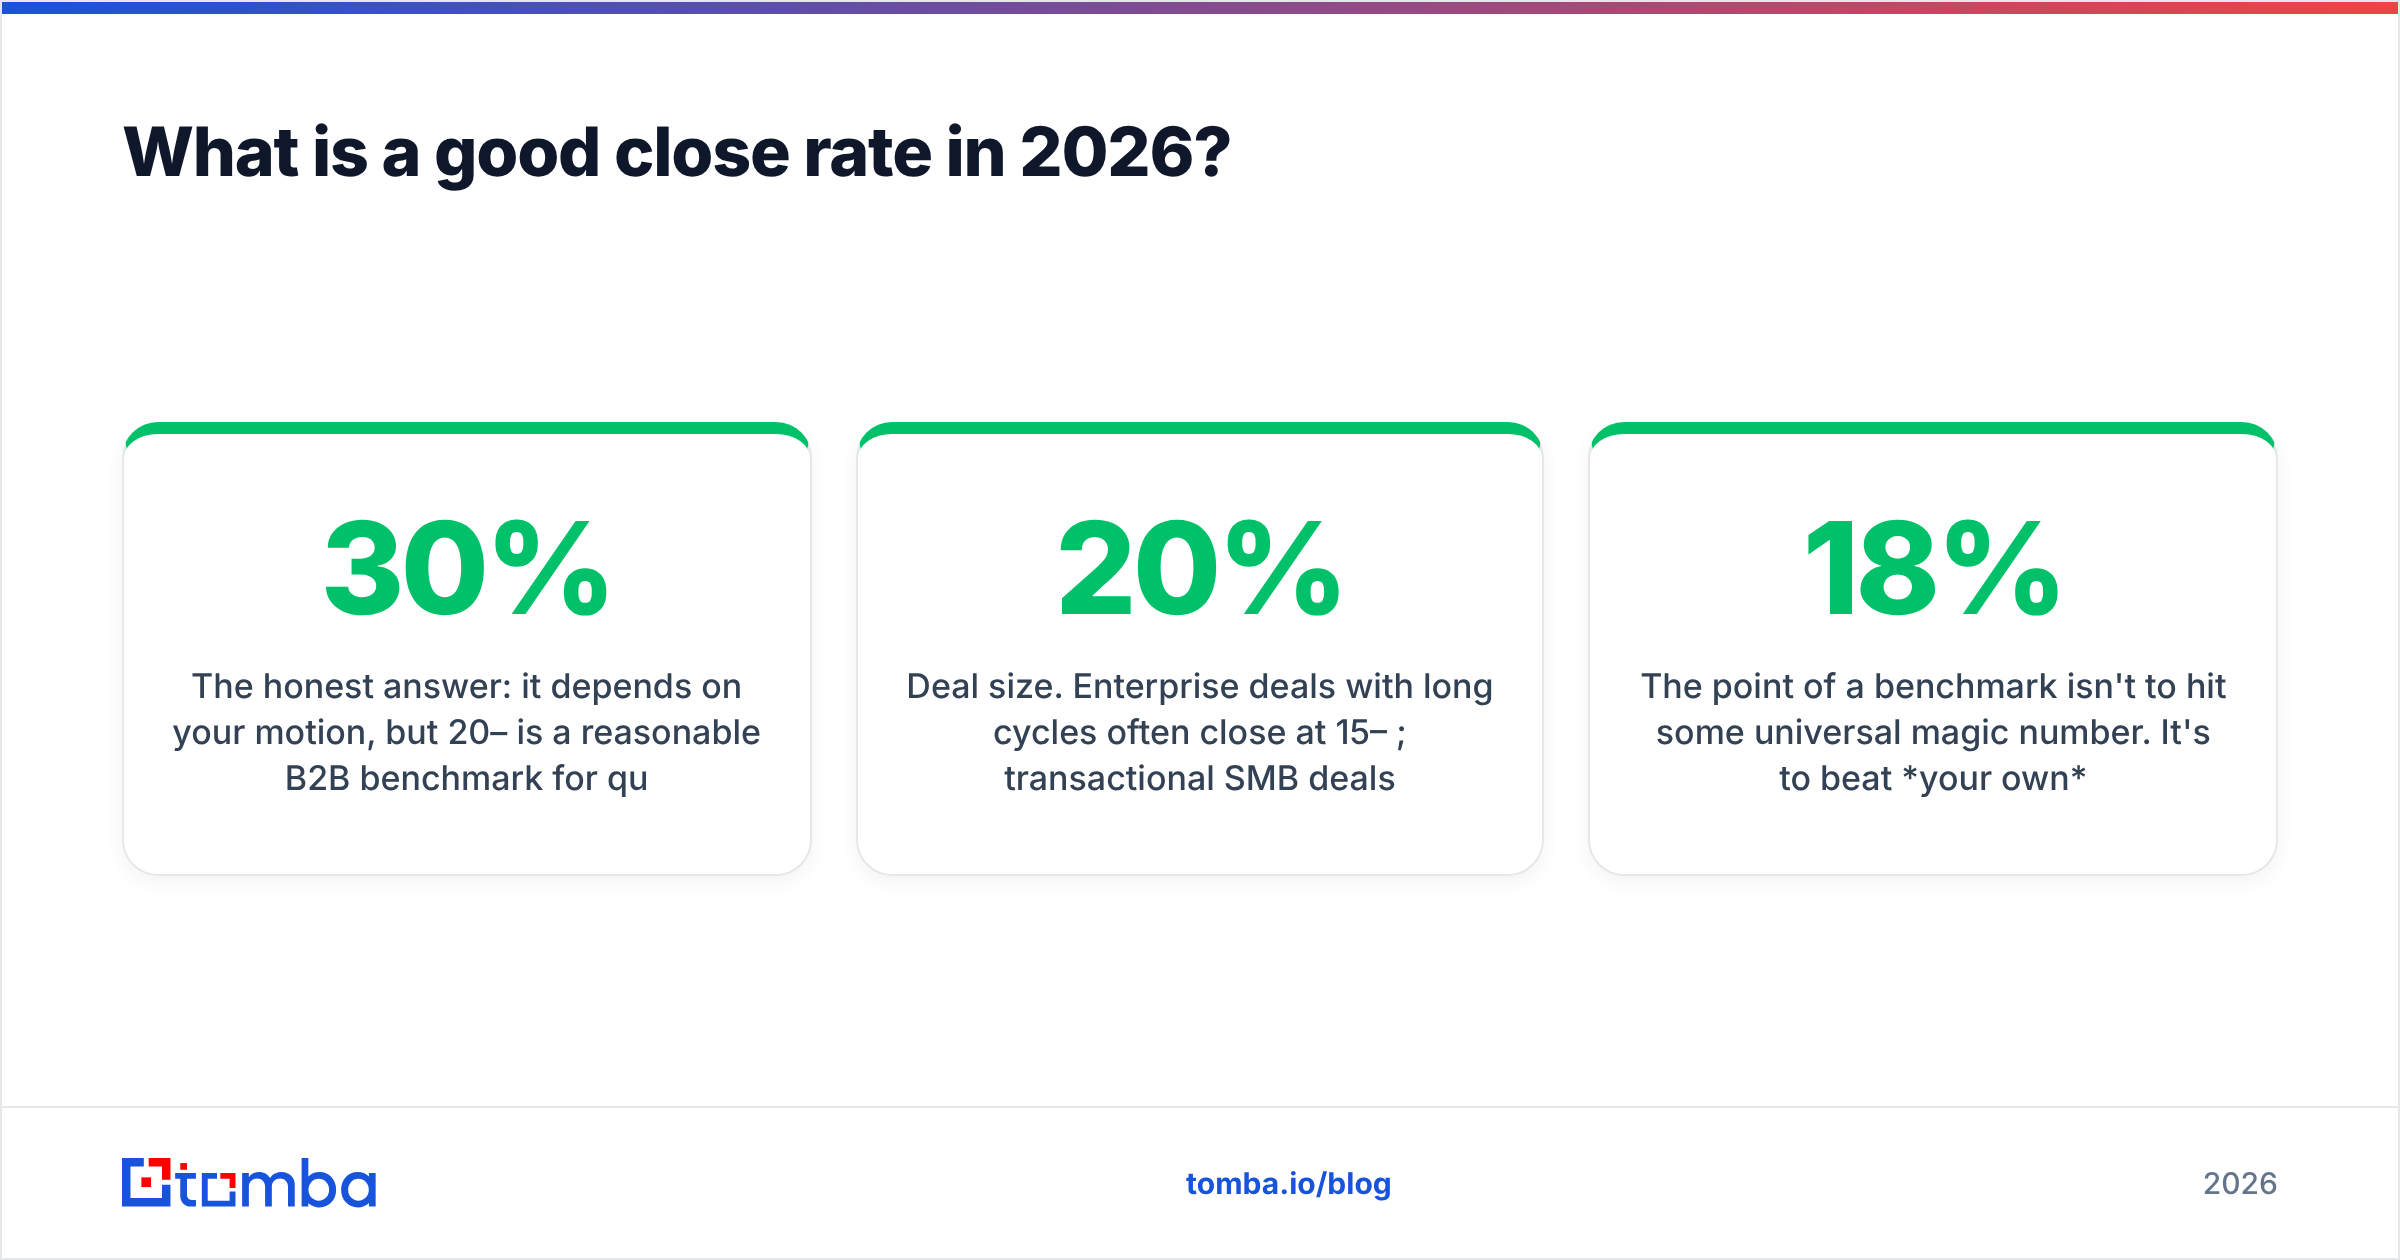
The honest answer: it depends on your motion, but 20–30% is a reasonable B2B benchmark for qualified pipeline. Anything above 30% usually means either an excellent product-market fit or a denominator that's too generous. Below 15% signals a qualification or data problem upstream.
Context that changes the "good" threshold:
- Deal size. Enterprise deals with long cycles often close at 15–20%; transactional SMB deals can hit 40%+.
- Lead source. Inbound and referral close far higher than cold outbound — comparing them is apples to oranges.
- Sales cycle length. Longer cycles naturally show lower rates in any fixed window because deals spill into the next period.
- Industry. SaaS, professional services, and manufacturing all sit at different baselines. HubSpot's ongoing sales benchmark research is a useful external reference point, and Gartner's B2B buying research documents how buyer behavior keeps stretching cycles.
The point of a benchmark isn't to hit some universal magic number. It's to beat your own trailing average. A team that moves from 18% to 23% over two quarters is winning, regardless of what a blog claims the "industry standard" is.
Why are your close rates lower than they should be?#
Most reps blame their pitch. The data usually blames the pipeline. Here are the real culprits, roughly in order of impact.
1. Bad or missing contact data. You can't close a deal with a bounced email or a wrong-number voicemail. When 20–30% of your outreach never reaches a human, your effective close rate on actual conversations is much higher than your dashboard shows — you're just wasting motion on dead records. Cleaning your list with an email verifier before a campaign is one of the cheapest close-rate boosts available.
2. Unqualified opportunities. Stuffing the pipeline with weak leads inflates your opportunity count and craters the rate. A smaller, better-qualified pipeline almost always closes at a higher percentage.
3. Slow follow-up. Response time is close-rate destiny. Leads contacted within five minutes convert dramatically better than those contacted an hour later — Salesforce and others have documented this "speed-to-lead" effect for years. Every hour of delay is deals lost.
4. Talking to the wrong person. If you're pitching an influencer instead of the economic buyer, you'll get polite interest and no signature. Enriching records with roles, seniority, and direct contact details helps you route to the decision-maker faster.
5. No multi-threading. Single-threaded deals — one champion, one contact — die when that person leaves or goes quiet. Pulling in additional stakeholders raises win probability substantially.
How does data quality actually move close rates?#
Clean, complete data compounds through every stage of the funnel, which is why it moves the final number more than a new closing script ever will.
Think of your funnel like a series of buckets with holes. If the top bucket (prospecting data) leaks 30% of its water to bad addresses and wrong numbers, everything downstream is starved — no matter how good your demo bucket is. Fix the top leak and every downstream stage gets more volume of real opportunities.
Concretely, better data improves close rates three ways:
- Reach. Verified, deliverable contact info means more conversations per hundred prospects. More conversations, more closes.
- Relevance. Enriched firmographic and role data lets you personalize and target the actual buyer, lifting response and conversion.
- Routing. Knowing seniority and department means the right rep talks to the right person the first time.
This is where a purpose-built email finder and data enrichment earn their keep — not as vanity tools, but as the foundation that makes your close-rate math favorable in the first place. Garbage in, low close rate out.
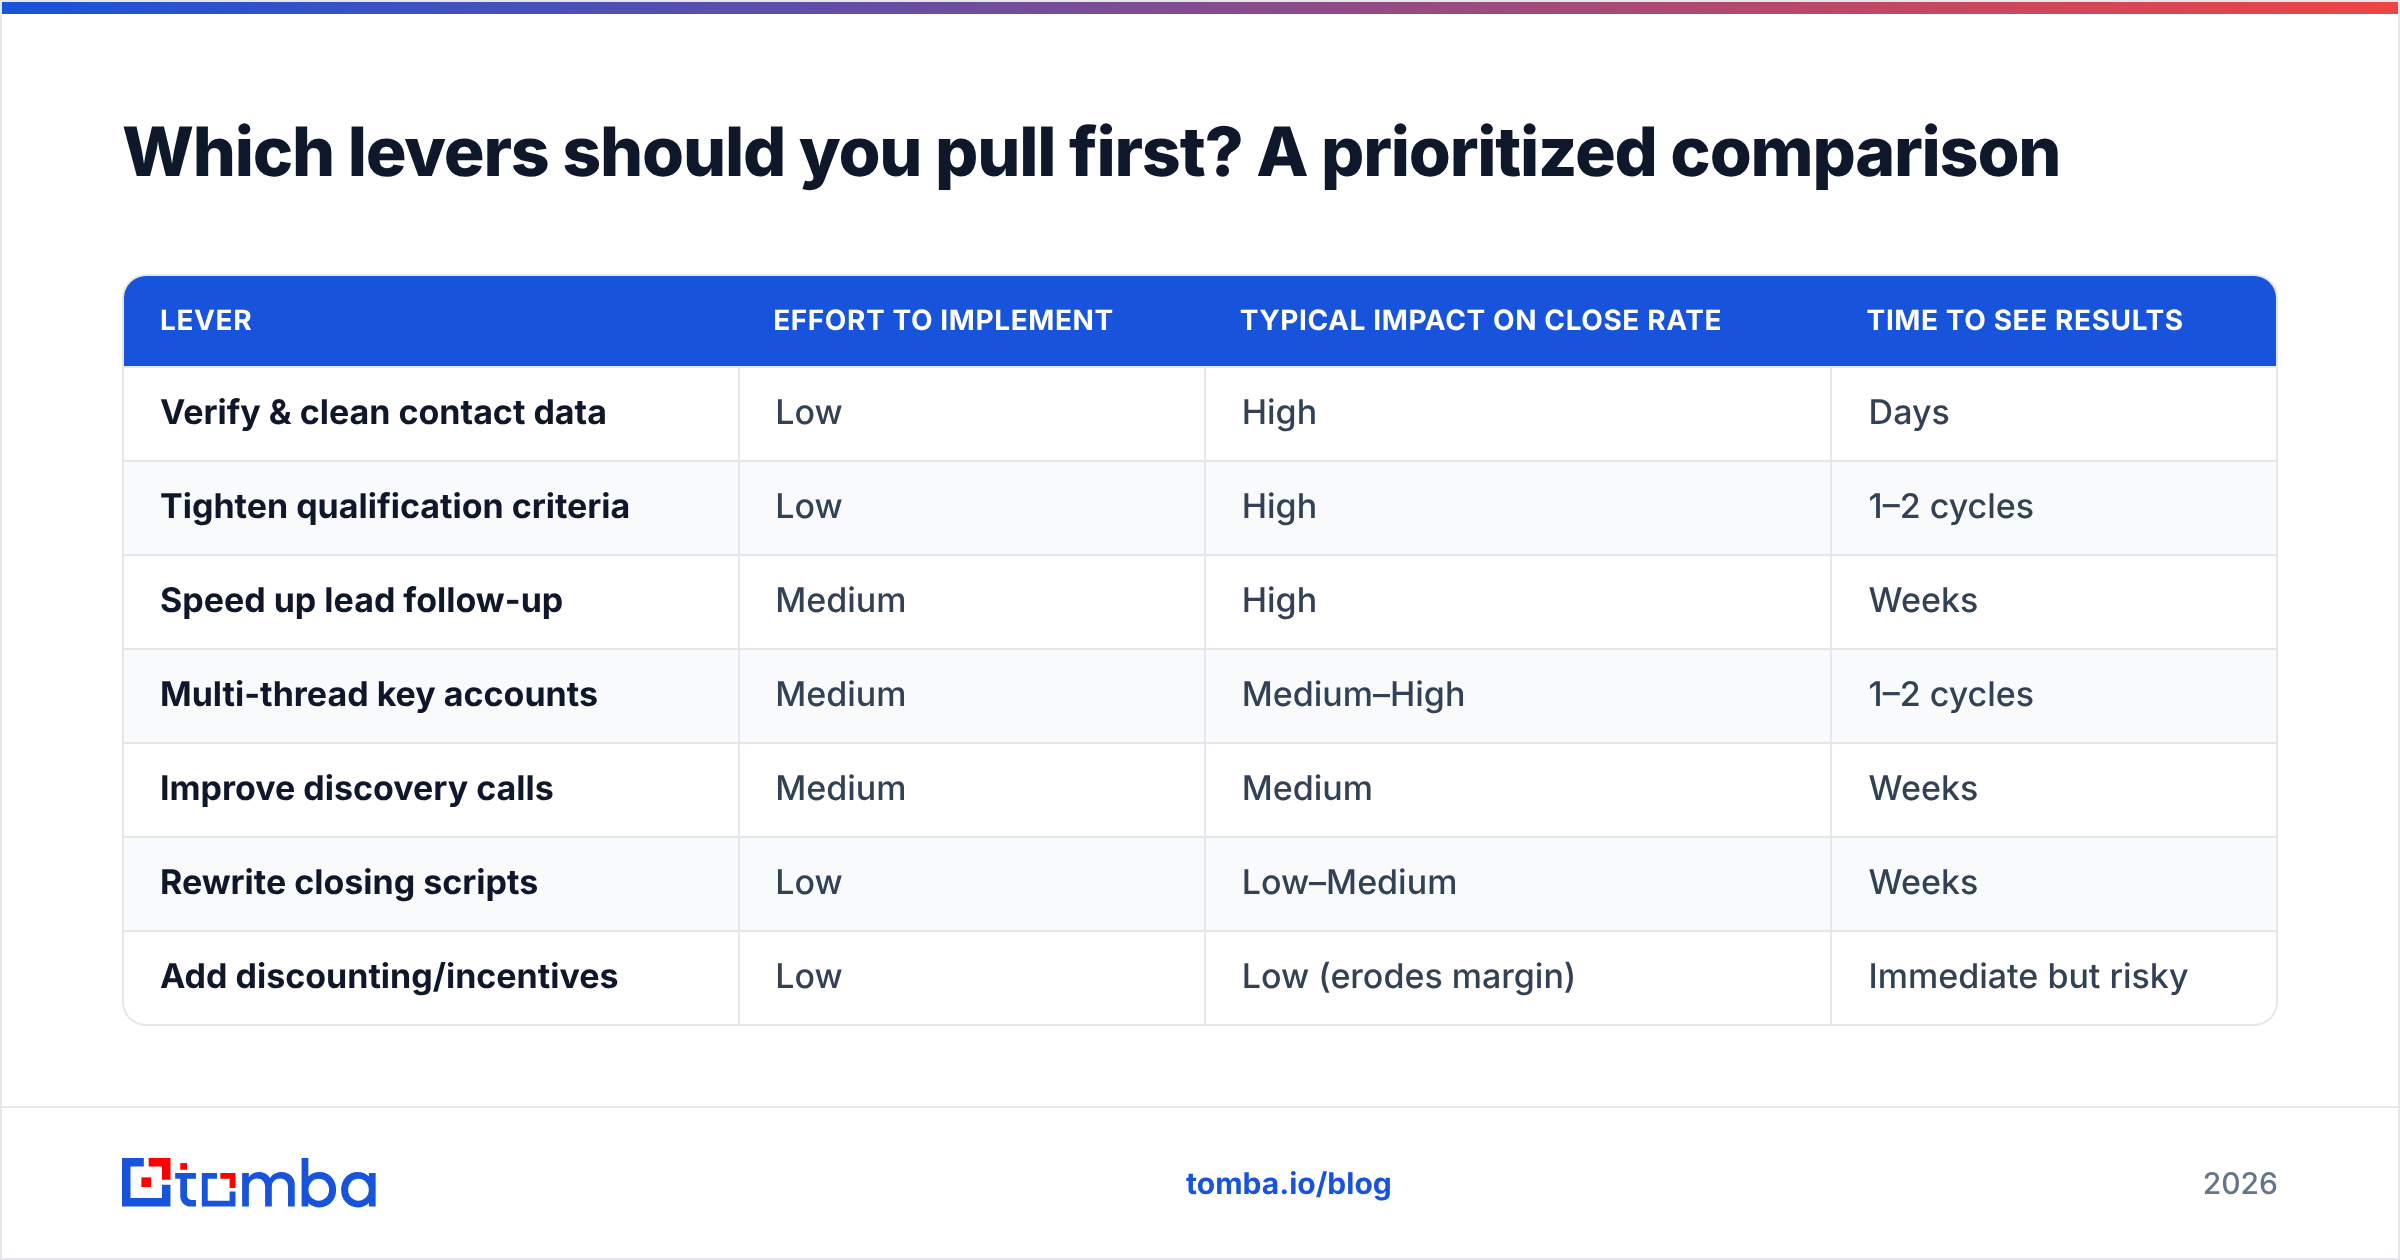
Which levers should you pull first? A prioritized comparison#
Not every improvement is worth the same effort. Here's how the common close-rate levers stack up.
| Lever | Effort to implement | Typical impact on close rate | Time to see results |
|---|---|---|---|
| Verify & clean contact data | Low | High | Days |
| Tighten qualification criteria | Low | High | 1–2 cycles |
| Speed up lead follow-up | Medium | High | Weeks |
| Multi-thread key accounts | Medium | Medium–High | 1–2 cycles |
| Improve discovery calls | Medium | Medium | Weeks |
| Rewrite closing scripts | Low | Low–Medium | Weeks |
| Add discounting/incentives | Low | Low (erodes margin) | Immediate but risky |
Notice the pattern: the highest-leverage moves — data hygiene and qualification — are also among the cheapest. Teams instinctively reach for closing scripts and discounts, the bottom of this list, because they're visible. The unglamorous top-of-funnel work is where the real gains hide.
You can validate this yourself. Read up on peer experiences on a review platform like G2 — the tools that consistently lift conversion are the ones that put accurate, enriched contacts in front of reps, not the ones promising a magic pitch.
How do you track close rates so the number stays honest?#
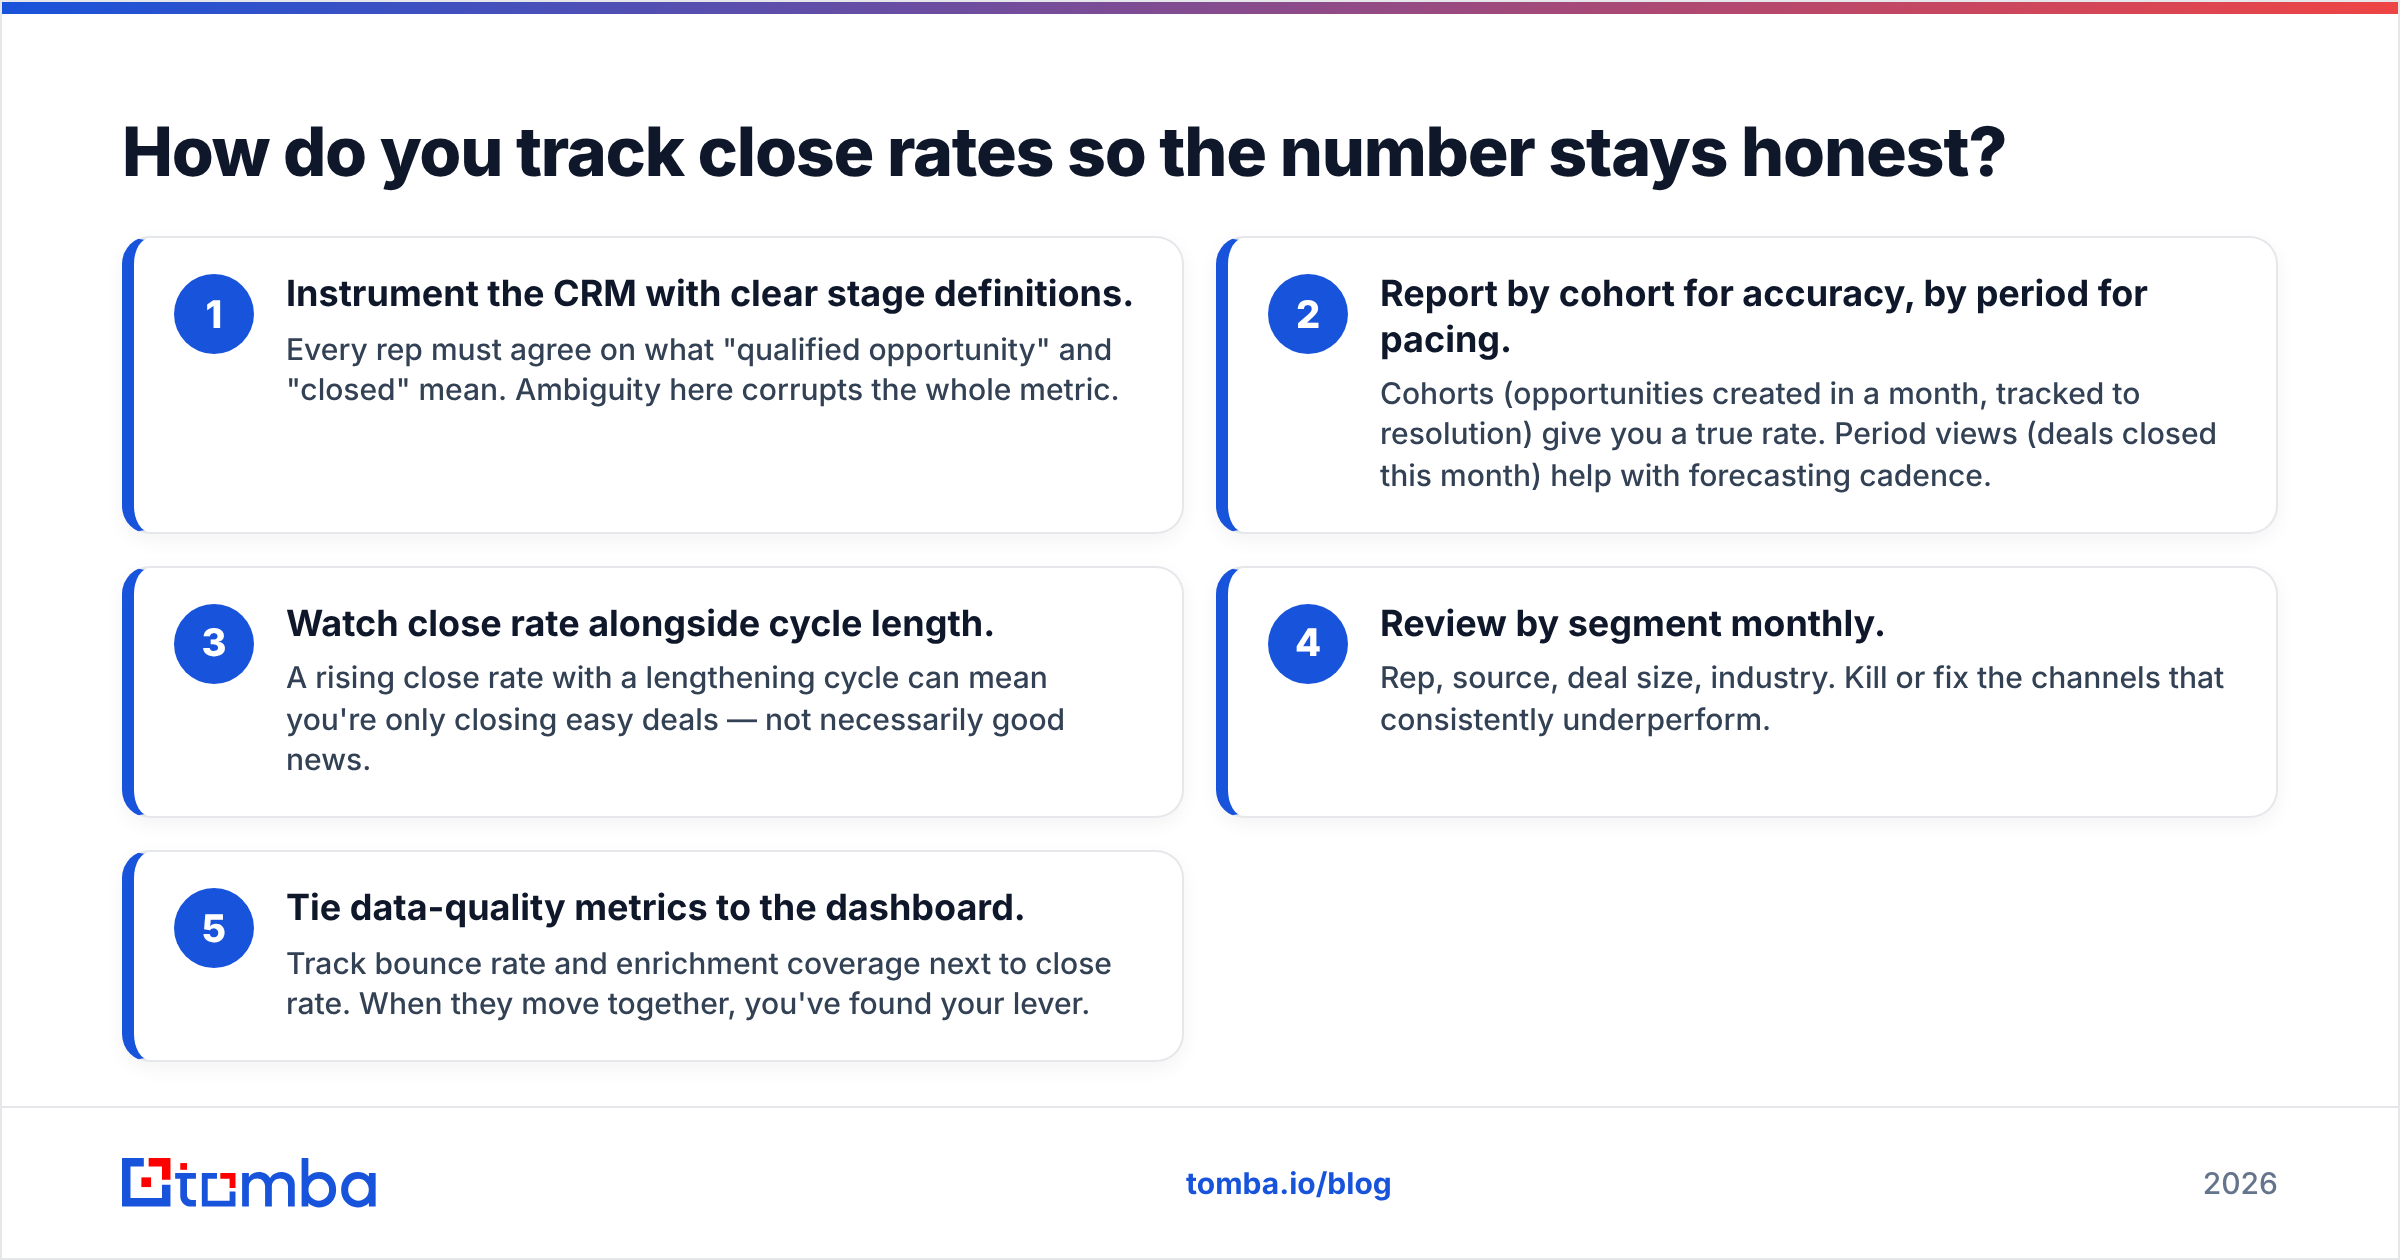
A close-rate metric is only as good as its hygiene. Build these habits into your operating rhythm.
- Instrument the CRM with clear stage definitions. Every rep must agree on what "qualified opportunity" and "closed" mean. Ambiguity here corrupts the whole metric.
- Report by cohort for accuracy, by period for pacing. Cohorts (opportunities created in a month, tracked to resolution) give you a true rate. Period views (deals closed this month) help with forecasting cadence.
- Watch close rate alongside cycle length. A rising close rate with a lengthening cycle can mean you're only closing easy deals — not necessarily good news.
- Review by segment monthly. Rep, source, deal size, industry. Kill or fix the channels that consistently underperform.
- Tie data-quality metrics to the dashboard. Track bounce rate and enrichment coverage next to close rate. When they move together, you've found your lever.
Keeping CRM records accurate is the unsung prerequisite for all of this. A pristine dashboard sitting on top of stale contact data is a beautifully rendered lie.
Frequently asked questions#
What's the difference between close rate and conversion rate? Conversion rate can refer to any stage-to-stage transition (visitor-to-lead, lead-to-opportunity). Close rate specifically measures opportunities-to-won. Close rate is one particular conversion rate — the last and most important one.
Should I include lost deals in my close rate? For a win rate, count won ÷ (won + lost) and exclude open deals. For a broader close rate, some teams divide by all opportunities entered. Just be consistent and label which you're using.
Can a close rate be too high? Yes. A rate above 40–50% often means you're under-filling the pipeline — you're only pursuing sure things and leaving growth on the table. Volume and rate have to be read together.
How often should I review close rates? Monthly for trend and segment analysis; quarterly for strategic decisions. Reviewing daily invites noise-chasing on small sample sizes.
Does lead source really change close rate that much? Dramatically. Referrals and inbound routinely close two to four times higher than cold paid leads. This is why blended averages mislead and segmentation is non-negotiable.
Close more by fixing the top of the funnel first#
The fastest path to a higher close rate rarely runs through a new sales script — it runs through better data reaching the right people faster. Before you invest in closing training, make sure every opportunity in your pipeline is real, reachable, and routed to the actual decision-maker.
Start there. Use Tomba's Email Finder to build clean, verified prospect lists so your reps spend their time in live conversations instead of chasing bounced emails and dead numbers. Pair it with verification and enrichment, tighten your qualification bar, and watch the one number that matters — your close rate — start climbing. Check the Tomba pricing plans, including a free tier to test the data quality on your own list before you commit.
Related guides#
Ready to find emails that actually work?
Join 150,000+ professionals who stopped guessing and started sending. Free credits on signup — no credit card required.
Get the Tomba newsletter
Practical outbound tactics and product updates — once every two weeks.
About the author