Closing Ratio Calculator: Formula, Benchmarks & Fixes
Learn how to calculate your closing ratio, see what a healthy benchmark looks like in 2026, and get the exact levers that move the number up.
Your closing ratio is the single number that tells you whether your pipeline is a growth engine or a leaky bucket. Most reps can quote their quota to the dollar but have no idea what percentage of their opportunities they actually win. This guide gives you the formula, a working closing ratio calculator you can rebuild in a spreadsheet in two minutes, honest 2026 benchmarks, and the specific fixes that move the number — not vague pep talk.
TL;DR#
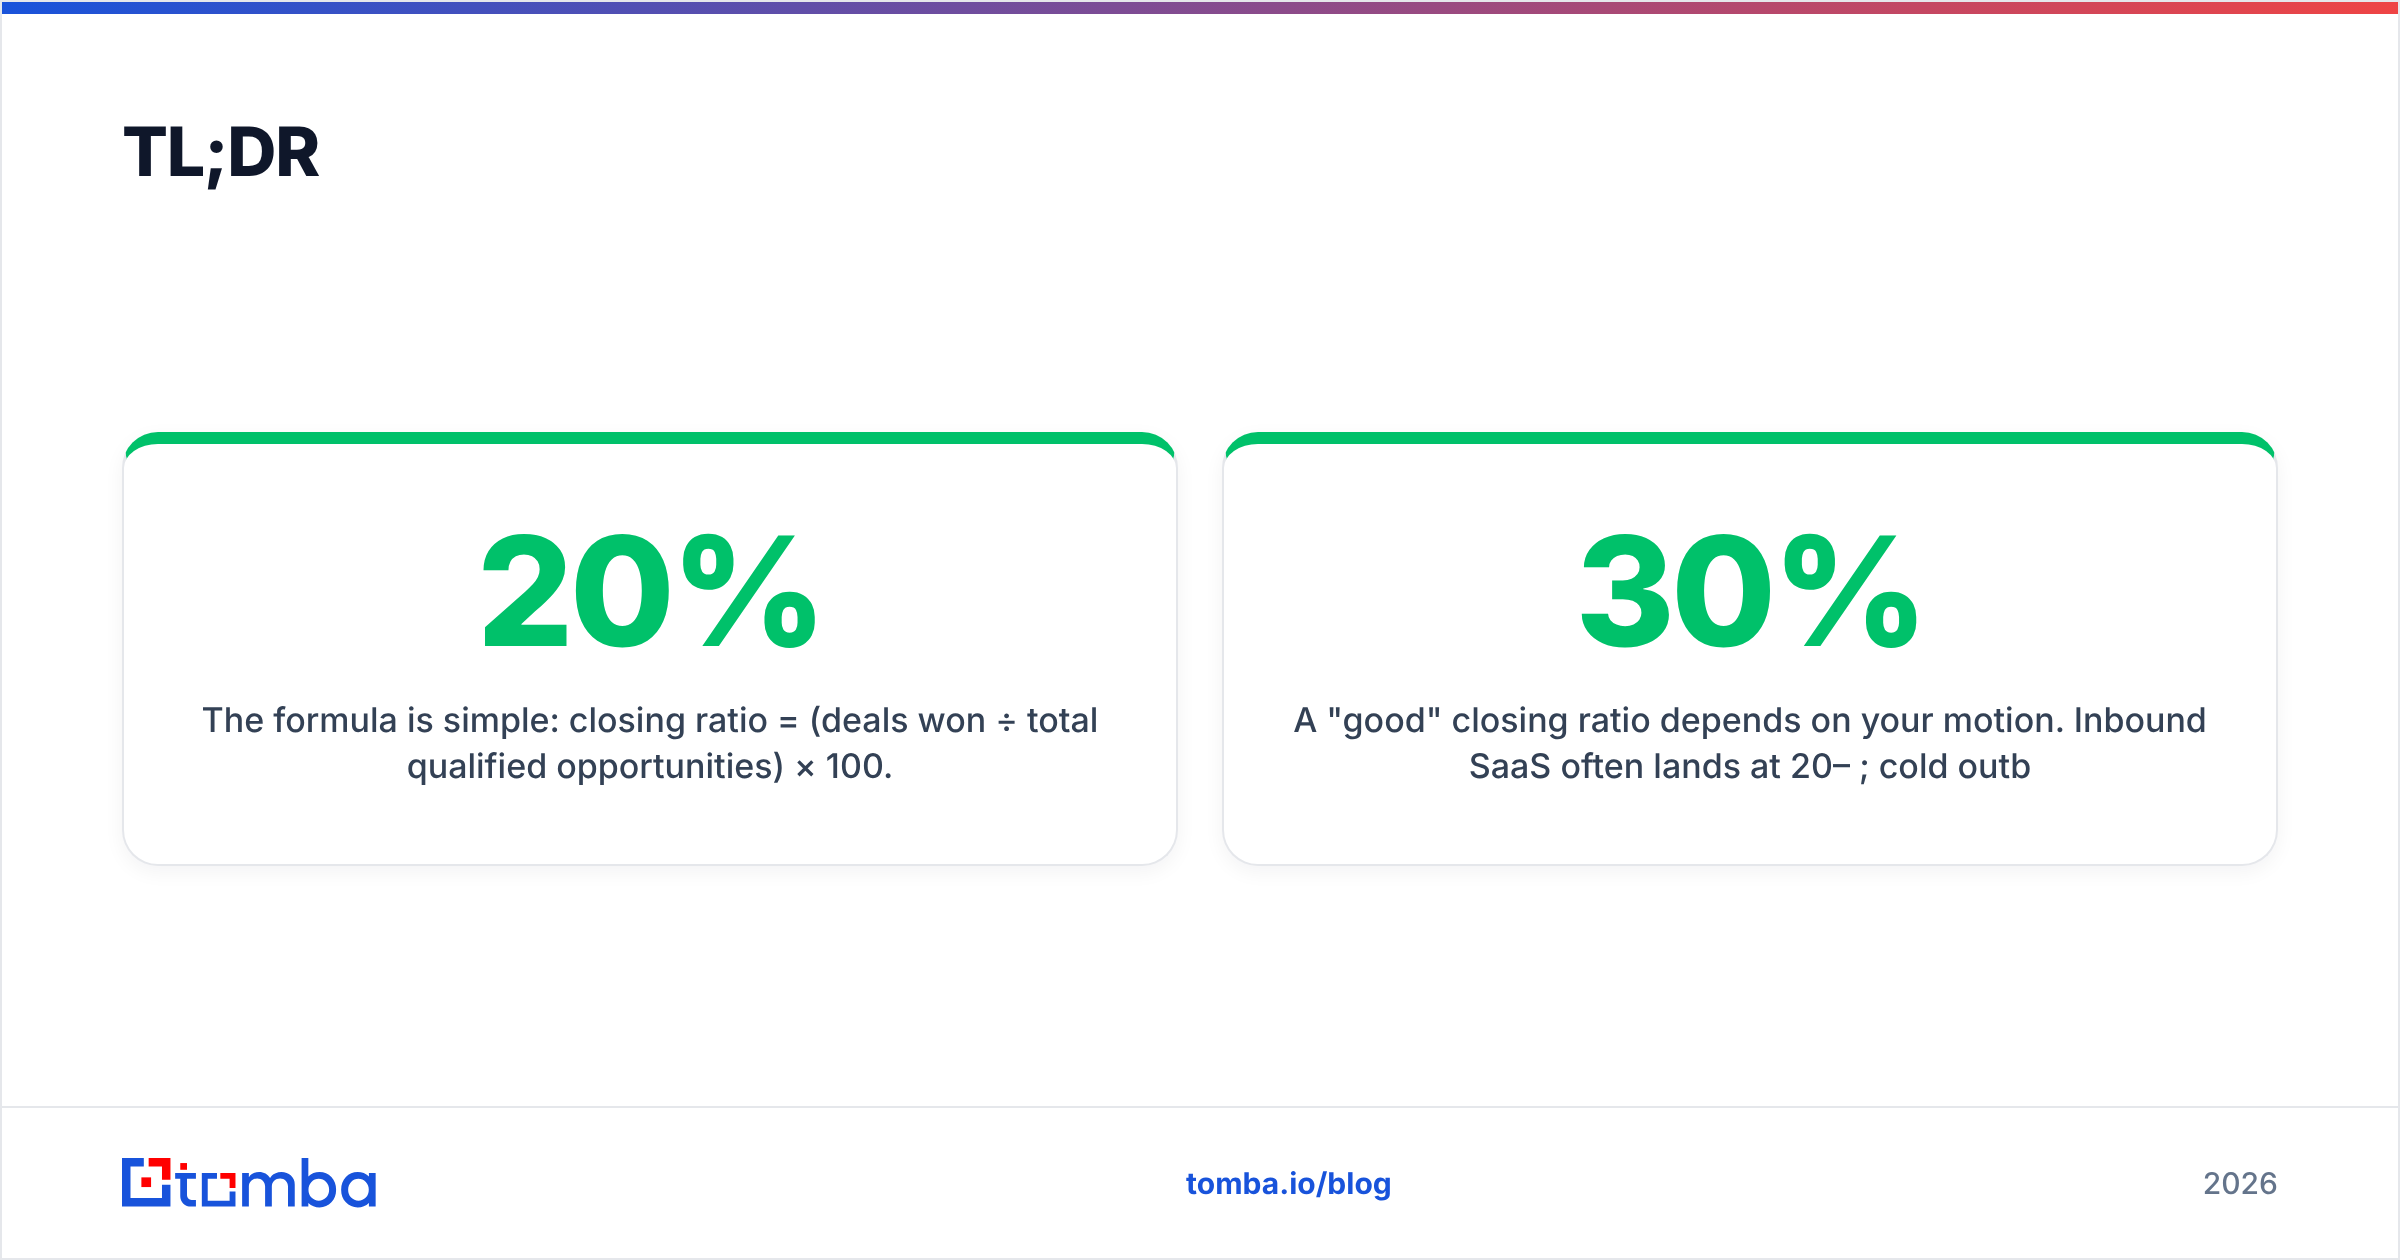
- The formula is simple: closing ratio = (deals won ÷ total qualified opportunities) × 100. A 20% ratio means you close 1 in 5.
- A "good" closing ratio depends on your motion. Inbound SaaS often lands at 20–30%; cold outbound is frequently 3–10%. Context beats vanity numbers.
- Bad data quietly tanks your ratio. Chasing wrong-fit or unreachable contacts inflates your opportunity count and drags the percentage down.
- The fastest lever is usually the top of funnel, not the close. Better-qualified, verified leads raise the ratio without changing your pitch.
- Track it by segment, rep, and source — a single blended number hides the parts of your process that are actually broken.
What is a closing ratio?#
Your closing ratio is the percentage of qualified opportunities that turn into won deals over a set period. Think of it like a basketball free-throw percentage: it does not matter how many shots you take if you cannot say how many go in. The ratio turns raw activity into a measure of effectiveness.
It is closely related to — and often used interchangeably with — win rate, though some teams draw a fine line: win rate counts wins against wins-plus-losses, while closing ratio sometimes counts against every opportunity that entered the stage, including those still open at period end. Pick one definition and apply it consistently. The trend matters more than the exact denominator.
A closing ratio answers three questions at once:
- Is your qualification honest? A sky-high ratio can mean you only advance sure things and starve your pipeline.
- Is your pitch converting? A collapsing ratio on healthy volume points at messaging, pricing, or product-market fit.
- Are you forecasting reality? Revenue Operations uses the ratio to convert pipeline dollars into a credible commit.
How do you calculate closing ratio?#
The core formula:
Closing ratio = (Number of deals closed-won ÷ Number of qualified opportunities) × 100
Say you worked 40 qualified opportunities last quarter and closed 8. Your closing ratio is (8 ÷ 40) × 100 = 20%. That is your baseline. Everything else is about deciding what counts as "qualified" and slicing the number so it tells you something useful.
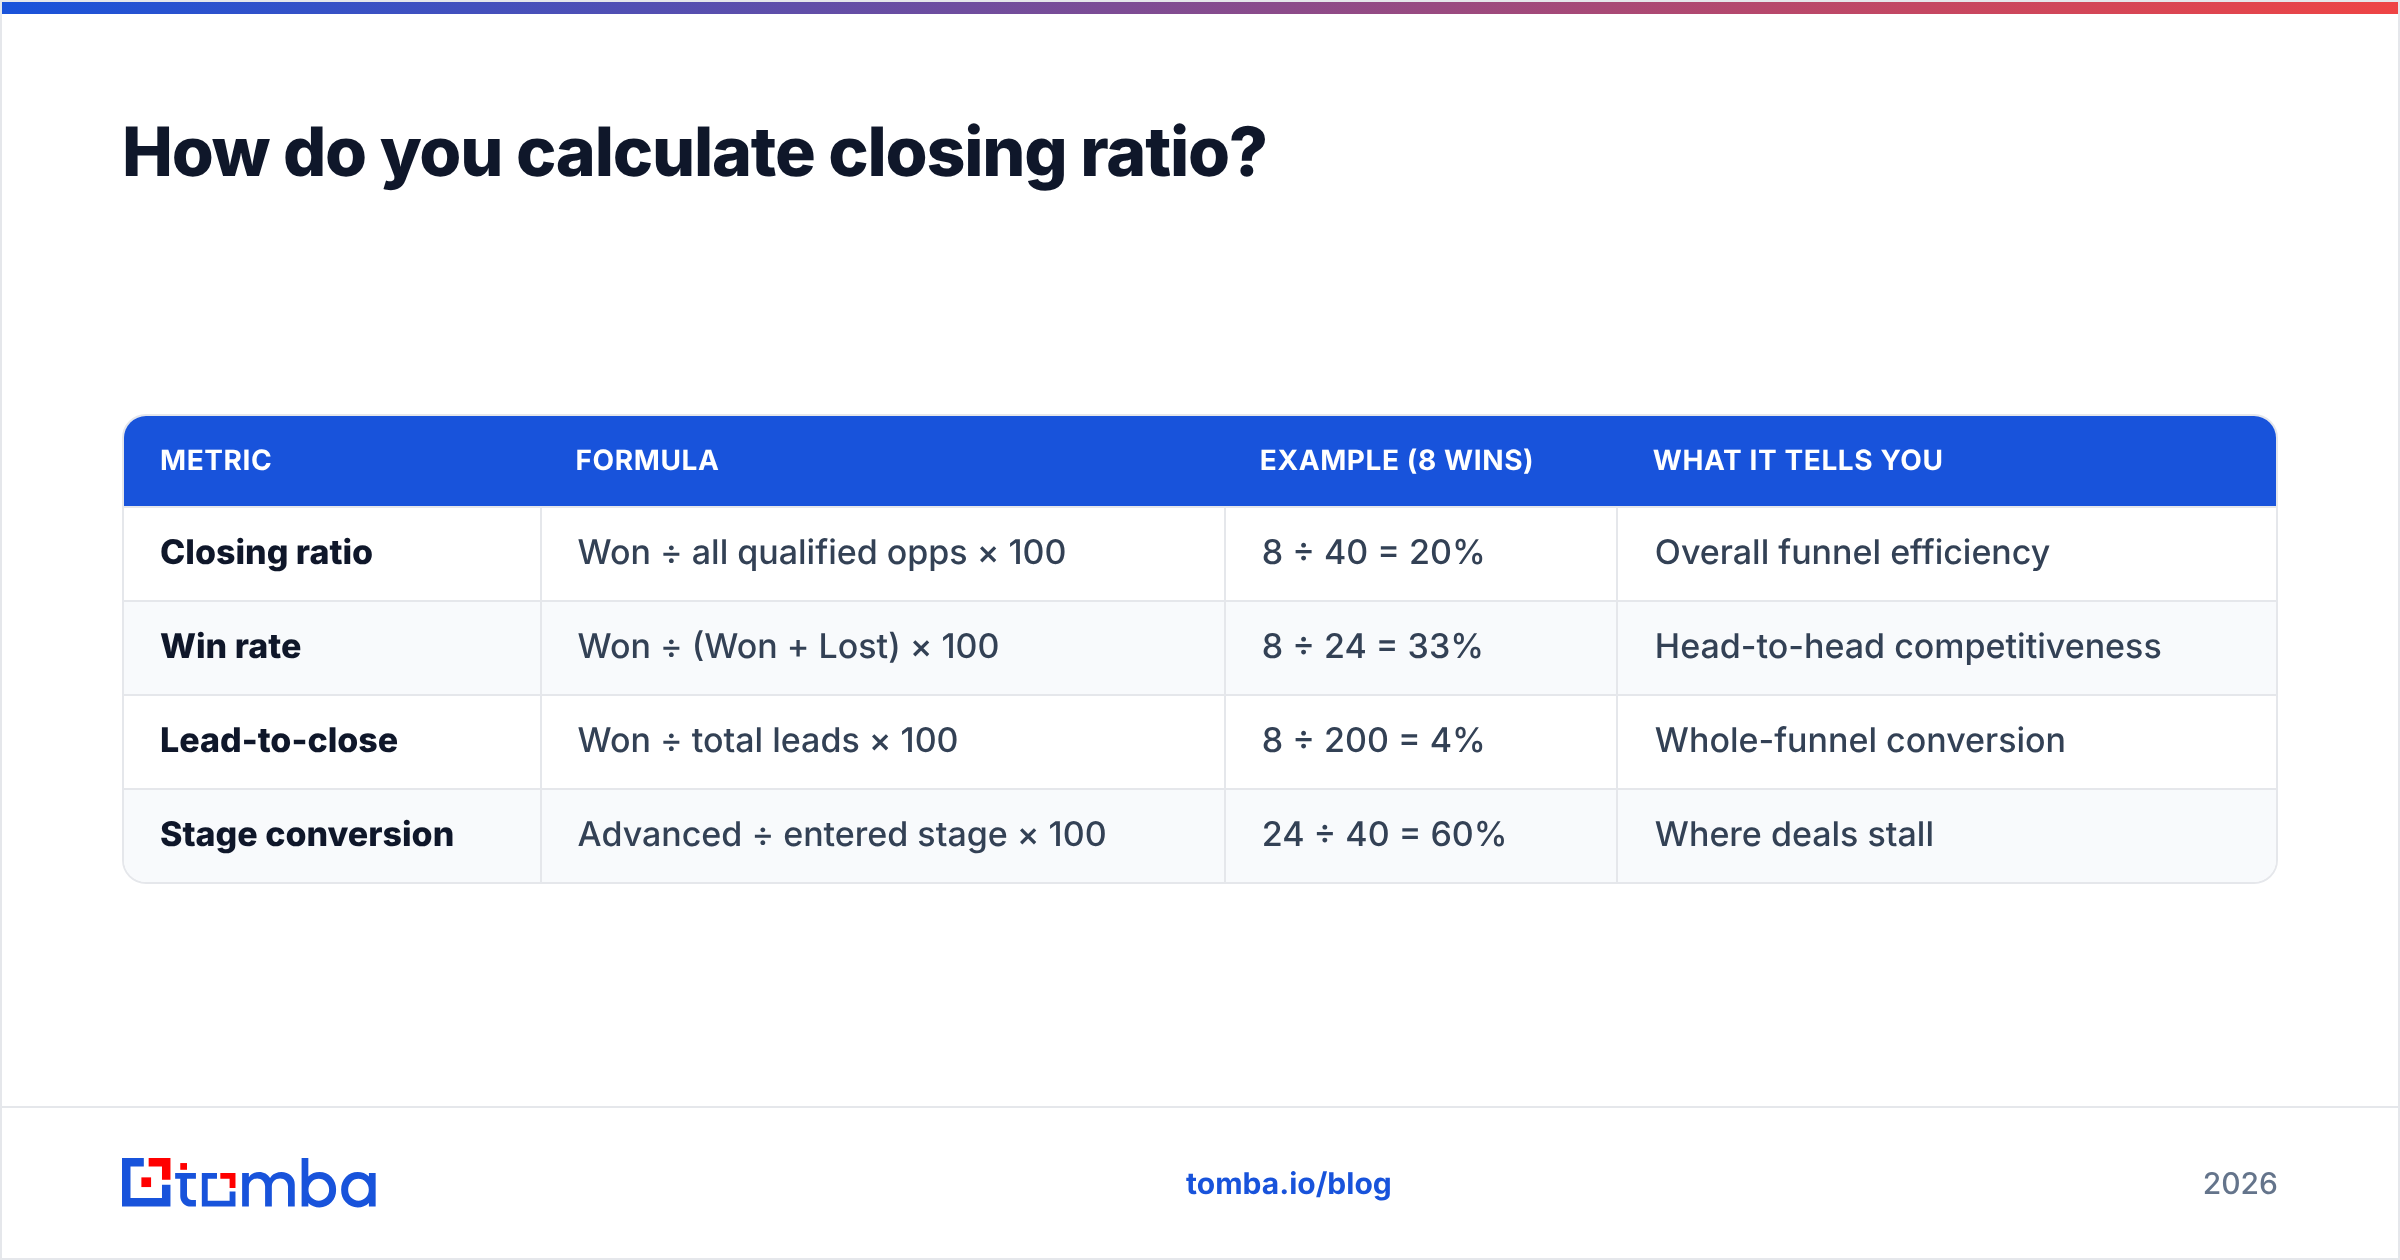
Here is how the same inputs produce very different readings depending on what you divide by:
| Metric | Formula | Example (8 wins) | What it tells you |
|---|---|---|---|
| Closing ratio | Won ÷ all qualified opps × 100 | 8 ÷ 40 = 20% | Overall funnel efficiency |
| Win rate | Won ÷ (Won + Lost) × 100 | 8 ÷ 24 = 33% | Head-to-head competitiveness |
| Lead-to-close | Won ÷ total leads × 100 | 8 ÷ 200 = 4% | Whole-funnel conversion |
| Stage conversion | Advanced ÷ entered stage × 100 | 24 ÷ 40 = 60% | Where deals stall |
Notice the same eight wins look like 4%, 20%, or 33% depending on the denominator. That is not a trick — it is why you must label which number you are quoting before comparing yourself to anyone.

Build the calculator in a spreadsheet#
You do not need software. In any spreadsheet:
- Cell B1 — Deals closed-won:
8 - Cell B2 — Qualified opportunities:
40 - Cell B3 — Closing ratio:
=B1/B2*100
Wrap it in =IFERROR(B1/B2*100, 0) so an empty pipeline does not throw a divide-by-zero error. Add columns for rep, lead source, and segment, and you have a closing ratio calculator that outperforms most paid dashboards because you control exactly what feeds it.
What is a good closing ratio in 2026?#
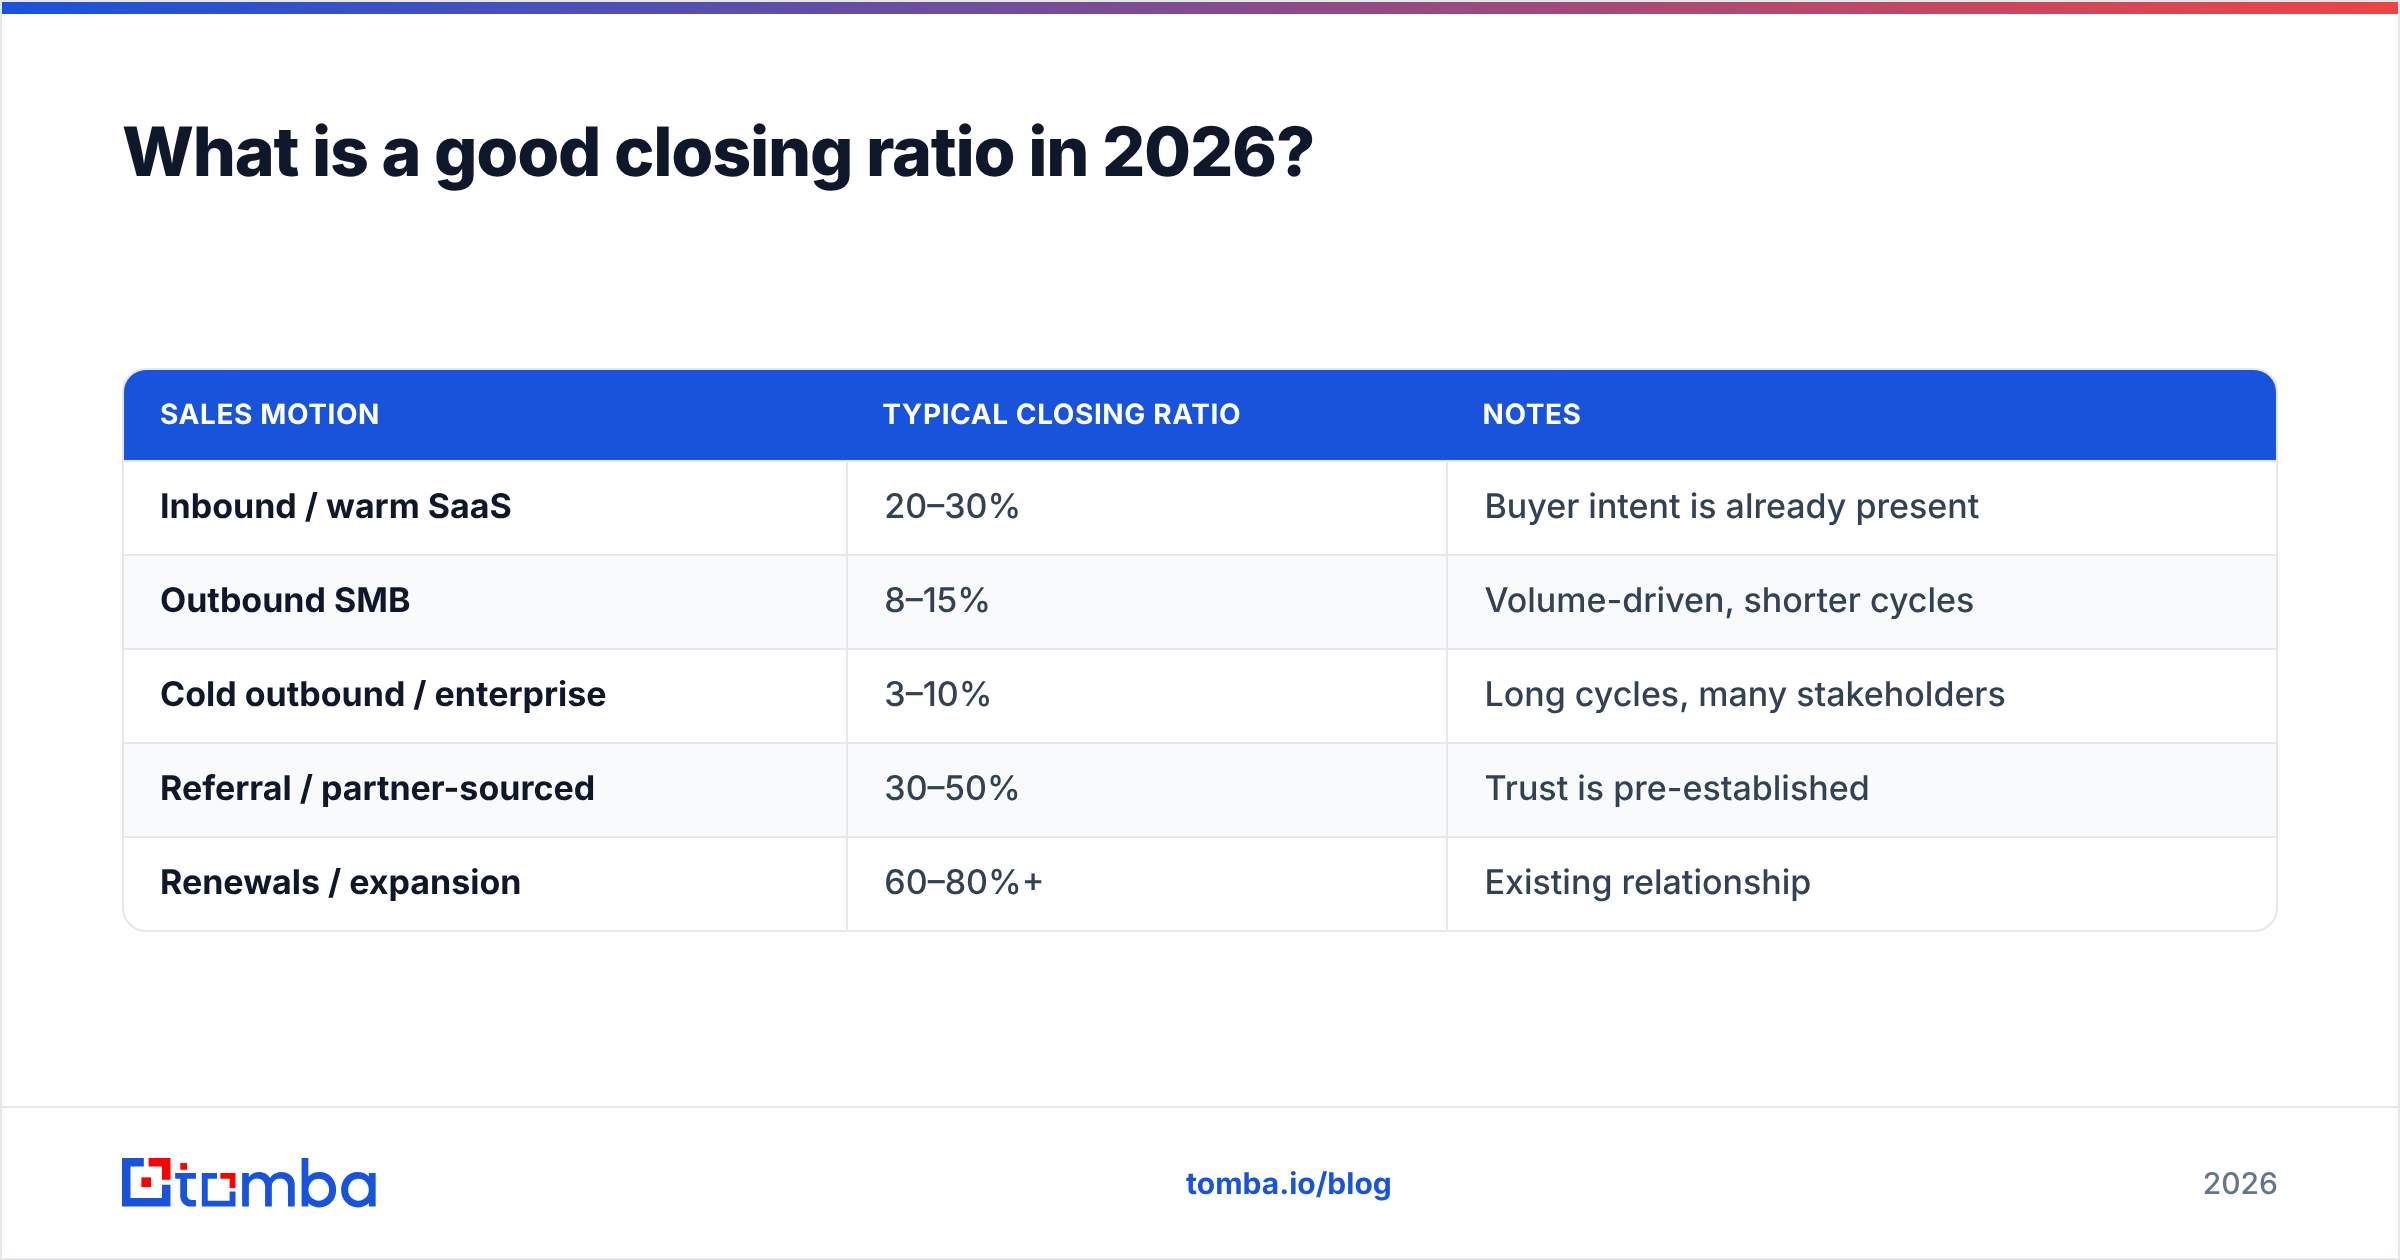
There is no universal "good" number — a good closing ratio is one that is trending up and beats your own prior quarters. That said, teams want reference points, so here are realistic ranges by motion:
| Sales motion | Typical closing ratio | Notes |
|---|---|---|
| Inbound / warm SaaS | 20–30% | Buyer intent is already present |
| Outbound SMB | 8–15% | Volume-driven, shorter cycles |
| Cold outbound / enterprise | 3–10% | Long cycles, many stakeholders |
| Referral / partner-sourced | 30–50% | Trust is pre-established |
| Renewals / expansion | 60–80%+ | Existing relationship |
If your cold-outbound ratio is 4%, you are inside the normal band — the leverage is in volume and targeting, not in beating yourself up over the percentage. If your inbound ratio is 8%, something upstream is broken: either marketing is passing unqualified leads, or your handoff and follow-up are leaking. According to sales benchmark research published by vendors like HubSpot and peer-reviewed on G2, the spread within a single industry is often wider than the spread between industries — which means your process, not your market, is usually the deciding factor.
Why is your closing ratio lower than it should be?#
Most low closing ratios trace back to one of four root causes, and only one of them is about closing skill.
- Weak qualification. You are counting tire-kickers as opportunities. This inflates the denominator and makes a decent sales team look ineffective. Tighten your qualified-opportunity definition (budget, authority, need, timeline) before blaming reps.
- Bad contact data. If a third of your "opportunities" are built on wrong emails, disconnected numbers, or people who left the company, you are burning cycles on ghosts. Verified, current data is the cheapest ratio boost available. Running prospects through a data enrichment step before they enter the pipeline keeps the denominator honest.
- Slow or inconsistent follow-up. Deals decay. A qualified opportunity worked on day 30 converts far worse than one worked on day 1. This is a process problem, fixable with sequencing and a clean CRM cadence.
- Message-market mismatch. If you lose consistently at the same stage to the same objection, the fix is positioning, not persistence.

The reason data quality sits so high on this list: it silently corrupts every other metric. A wrong email address does not just cost one email — it costs the entire opportunity that never should have been counted, and it drags your closing ratio down for reasons that have nothing to do with how well your reps sell.
How do you improve your closing ratio?#
Raising the ratio is usually a top-of-funnel and mid-funnel exercise, not a closing-table trick. Work these levers in order:
- Fix the denominator first. Re-audit what you call "qualified." If a lead cannot pass a two-line fit check, it does not belong in the count. This alone can lift a reported ratio 5–10 points without changing behavior.
- Feed the funnel verified contacts. Reaching the right decision-maker on the first attempt compresses cycle time and lifts conversion. This is where a reliable email finder earns its keep — accurate contacts mean fewer dead opportunities inflating your base.
- Score and route by fit. Send your best-fit leads to your strongest closers. Random assignment wastes your highest-probability deals on your least-ready reps.
- Shorten time-to-first-touch. Speed-to-lead is one of the most durable predictors of conversion. Automate the handoff so no qualified opportunity waits.
- Run loss reviews monthly. Tag every closed-lost reason. Patterns — price, timing, a specific competitor — tell you exactly which lever to pull next quarter.
- Coach to the stage, not the number. If deals die in "proposal," role-play proposals. Coaching the ratio in the abstract changes nothing.
A worked example#
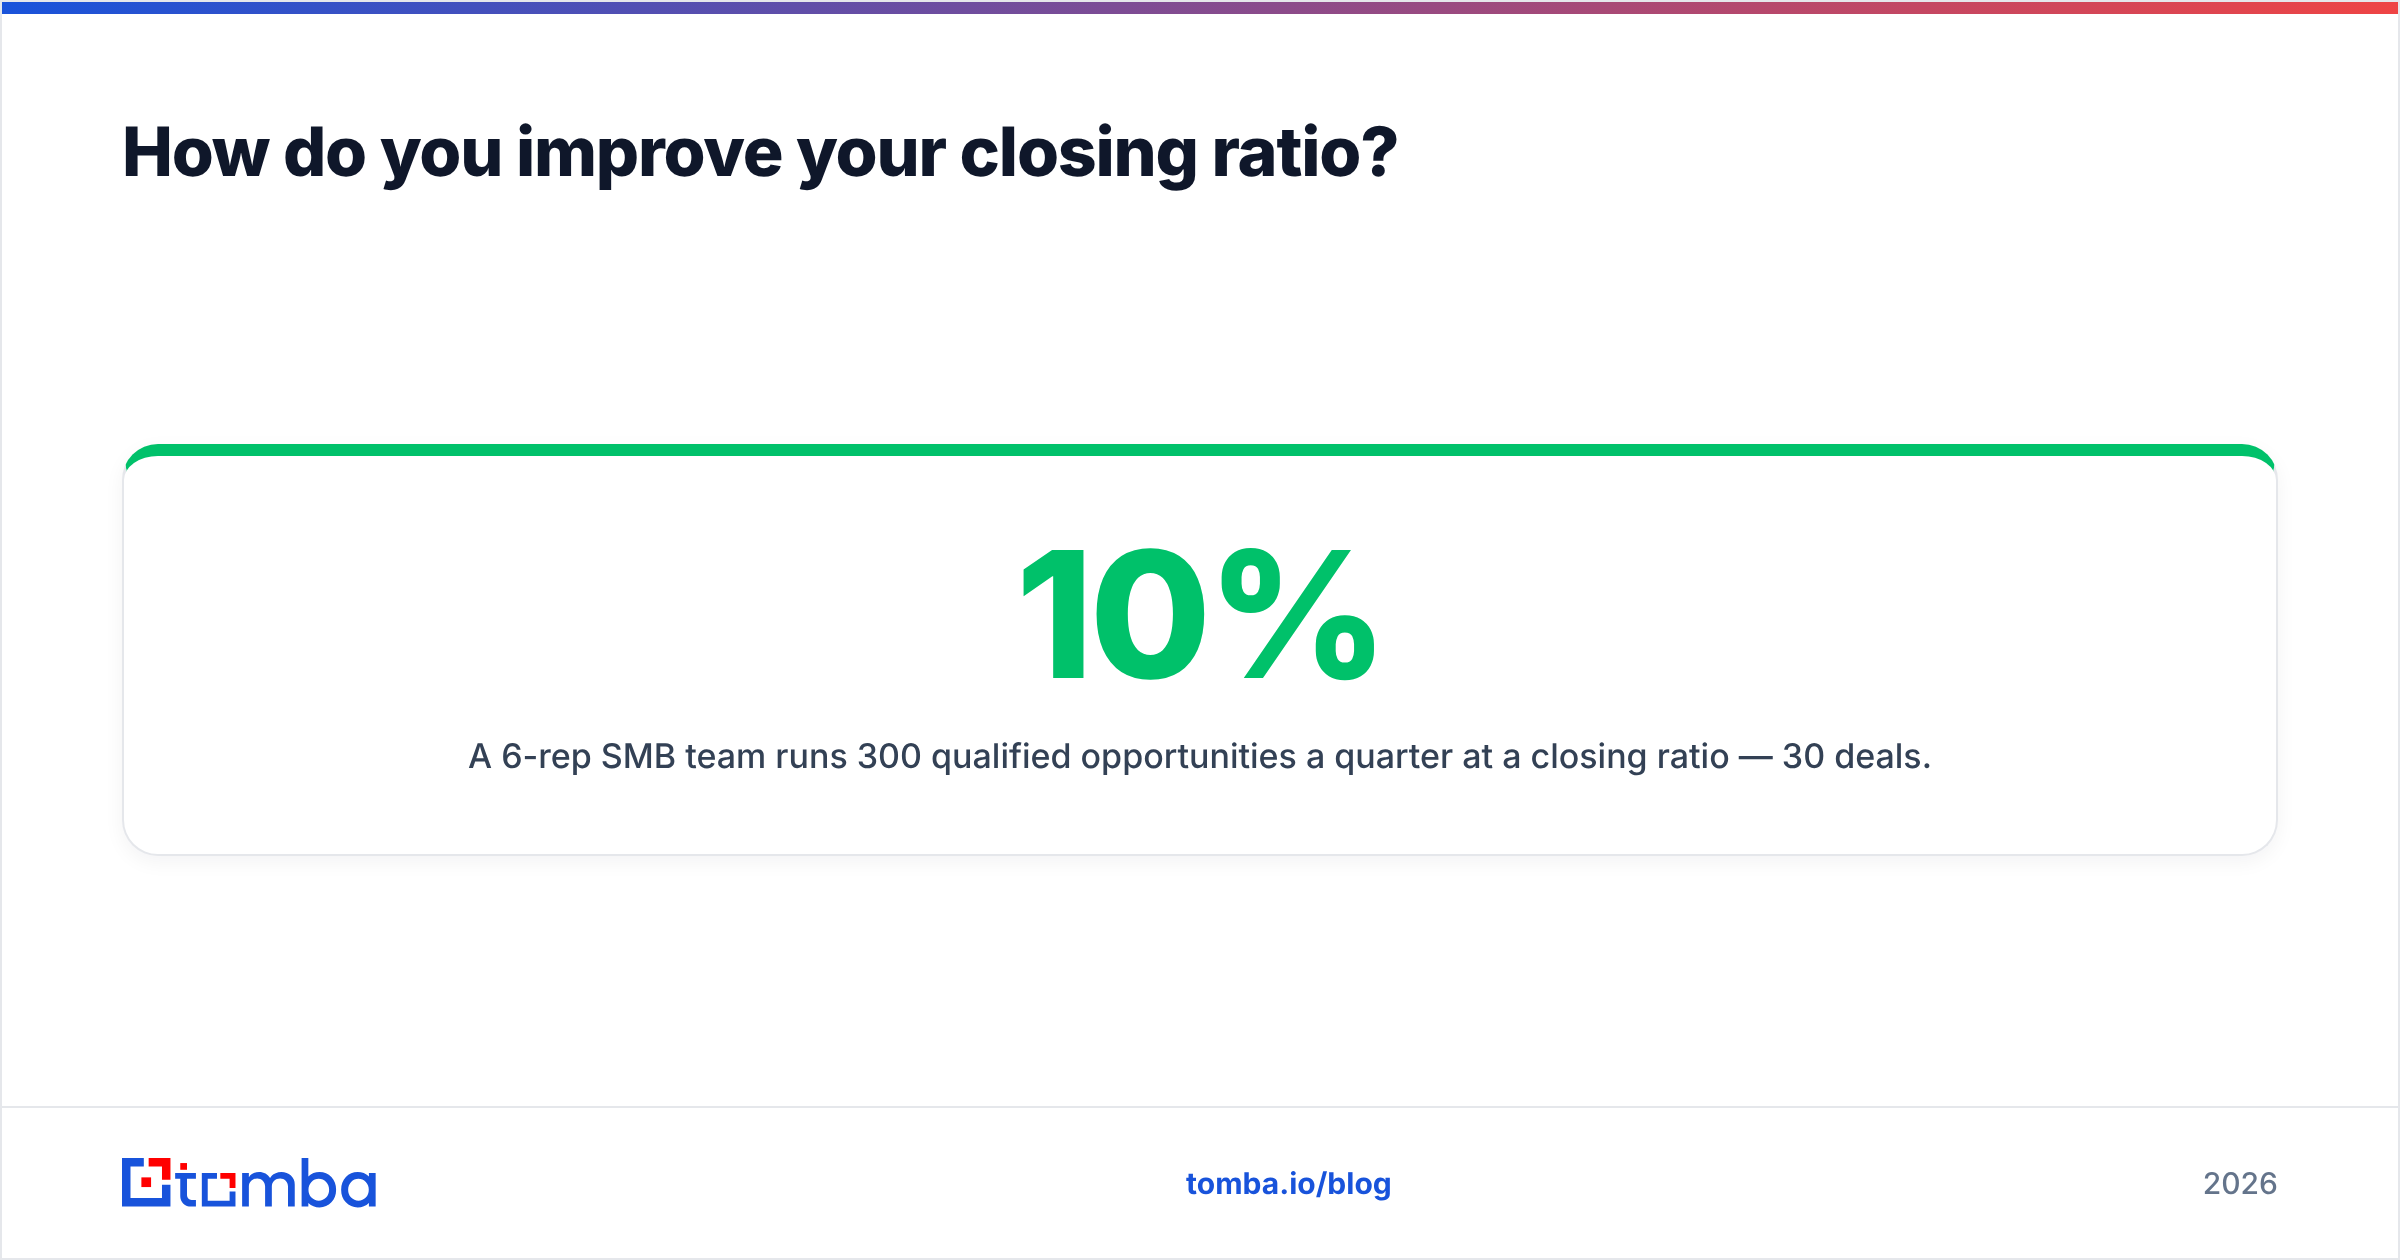
A 6-rep SMB team runs 300 qualified opportunities a quarter at a 10% closing ratio — 30 deals. An audit finds 20% of "qualified" opps were built on stale or wrong contacts that never truly engaged. After adding a verification and enrichment step, the real qualified count drops to 240, and reaching decision-makers faster lifts genuine conversion. Next quarter: 240 opportunities, 34 wins. The ratio jumps from 10% to 14% and total deals rise — from a data fix, not a new pitch. That is the pattern most teams miss: the closing ratio improved because the inputs got cleaner, not because anyone worked harder.
How often should you measure it?#
Match the cadence to your sales cycle. A team with a 14-day cycle can read the closing ratio weekly and act on it. A team with a 9-month enterprise cycle should watch stage-conversion rates weekly but only judge the full closing ratio quarterly — anything shorter is noise. Whatever the cadence, always segment:
- By rep — surfaces coaching needs and top performers to model.
- By lead source — tells marketing which channels produce real revenue, not just volume. Salesforce's own State of Sales reporting repeatedly finds that source-level conversion varies more than any other cut of the data.
- By segment or product — reveals where you have product-market fit and where you are forcing a sale.
- By deal size — big deals almost always close at lower ratios; a blended number will make your enterprise motion look broken when it is simply different.
A single blended closing ratio is a vanity metric. The segmented version is a diagnostic tool.
Common closing ratio mistakes to avoid#
- Comparing across definitions. Your 25% and a competitor's 25% may measure different things. Compare yourself to your own trend line.
- Ignoring the denominator. Reps game the number by never marking weak deals as opportunities. Audit stage-entry discipline.
- Optimizing the ratio at the cost of volume. A 40% ratio on 20 deals loses to a 20% ratio on 200. Revenue is the goal; the ratio is a lens.
- Treating it as a rep-only metric. Marketing, RevOps, and data quality all move the closing ratio. Owning it solely with the sales team hides the real levers.
Frequently asked questions#
Is closing ratio the same as conversion rate? Not exactly. Conversion rate usually spans the whole funnel (lead to customer), while closing ratio focuses on qualified opportunities to won deals. Closing ratio is a late-funnel view; conversion rate is end-to-end.
Can a closing ratio be too high? Yes. A very high ratio often means you are under-qualifying volume — only advancing near-certain deals and leaving pipeline on the table. If your ratio is 60% on a cold motion, you are probably not taking enough shots.
What data do I need to calculate it accurately? Two clean numbers: verified qualified opportunities and confirmed closed-won deals, over a fixed window. The accuracy of the ratio is only as good as the accuracy of what you counted as "qualified" — which is why contact-data hygiene matters more than the formula itself.
Start with cleaner inputs#
A closing ratio calculator only tells the truth when the pipeline feeding it is real. If a chunk of your opportunities are built on guessed emails and stale contacts, no formula will save the number — you will just measure your own noise. Fix the inputs first: verify who you are talking to, reach the right decision-maker on the first try, and stop counting ghosts as opportunities.
That is exactly where Tomba's Email Finder fits. Find accurate, current professional emails by name, company, or domain, so every opportunity that enters your pipeline is reachable and real — and your closing ratio finally reflects how well you sell, not how bad your data is. Start free with 25 searches a month, and see what your ratio looks like when the denominator is honest. Check Tomba pricing when you are ready to scale.
Related guides#
// get started
Find, verify and enrich your first contacts today
Start on the free plan with 25 searches a month, then scale when your team is ready.
Free plan · No credit card required · GDPR & CCPA
// about the author