What Is CLTV? The 2026 Guide to Customer Lifetime Value
CLTV tells you what a customer is really worth over time. Here's how to calculate it, which formula to trust, and how to turn lifetime value into a GTM growth lever in 2026.

Customer lifetime value is one of those metrics everyone quotes and almost no one calculates the same way twice. Ask three people on your revenue team what your CLTV is, and you'll get three numbers — usually because they're mixing up gross revenue, margin, and retention assumptions. This guide fixes that.
TL;DR#
- CLTV (customer lifetime value) is the total profit you expect from an average customer across the entire relationship — not just their first order.
- The honest formula uses gross margin, not revenue:
CLTV = (Average Revenue per Account × Gross Margin %) ÷ Churn Rate. - The single most-watched number is the CLTV:CAC ratio — most B2B SaaS teams target 3:1 or higher.
- CLTV is only as trustworthy as your customer data. Bad emails, stale accounts, and duplicate records inflate churn and distort every downstream number.
- Use CLTV to decide who to acquire, who to keep, and how much to spend — not as a vanity slide.
What is CLTV, in plain English?#
Think of a customer like a fruit tree, not a single piece of fruit. The first sale is one apple. CLTV asks: how many apples will this tree give you over its whole life, minus what it costs to keep it watered?
Technically, customer lifetime value (CLTV, sometimes CLV or LTV) is the total net profit a business expects to earn from a single customer over the entire duration of the relationship. It rolls up first purchase, repeat purchases, upsells, and renewals — then subtracts the cost of serving that customer.
The reason it matters: acquisition is a one-time event, but revenue compounds over years. A customer who pays you $1,000 a month for four years is worth wildly more than one who churns after ninety days, even if they signed the same initial contract. CLTV is how you tell those two apart before you've spent a year finding out the hard way.
For a broader grounding in how this fits your operating model, see the revenue operations discipline that usually owns this metric.
How do you calculate CLTV? (The formulas that actually hold up)#
There are three common formulas, ordered from "back-of-napkin" to "board-ready."
1. The simple version (revenue-based):
CLTV = Average Purchase Value × Purchase Frequency × Customer LifespanFast, but it ignores margin and cost-to-serve, so it overstates value — sometimes by 3-4x.
2. The margin-adjusted version (recommended for B2B):
CLTV = (Average Revenue per Account × Gross Margin %) ÷ Customer Churn RateThis is the one most RevOps and finance teams trust. It answers "how much profit, not revenue, does the average account generate before it leaves?"
3. The discounted version (for long-cycle enterprise):
Applies a discount rate to future cash flows because a dollar in year four is worth less than a dollar today. Useful when contracts run 5+ years, overkill for PLG or SMB.
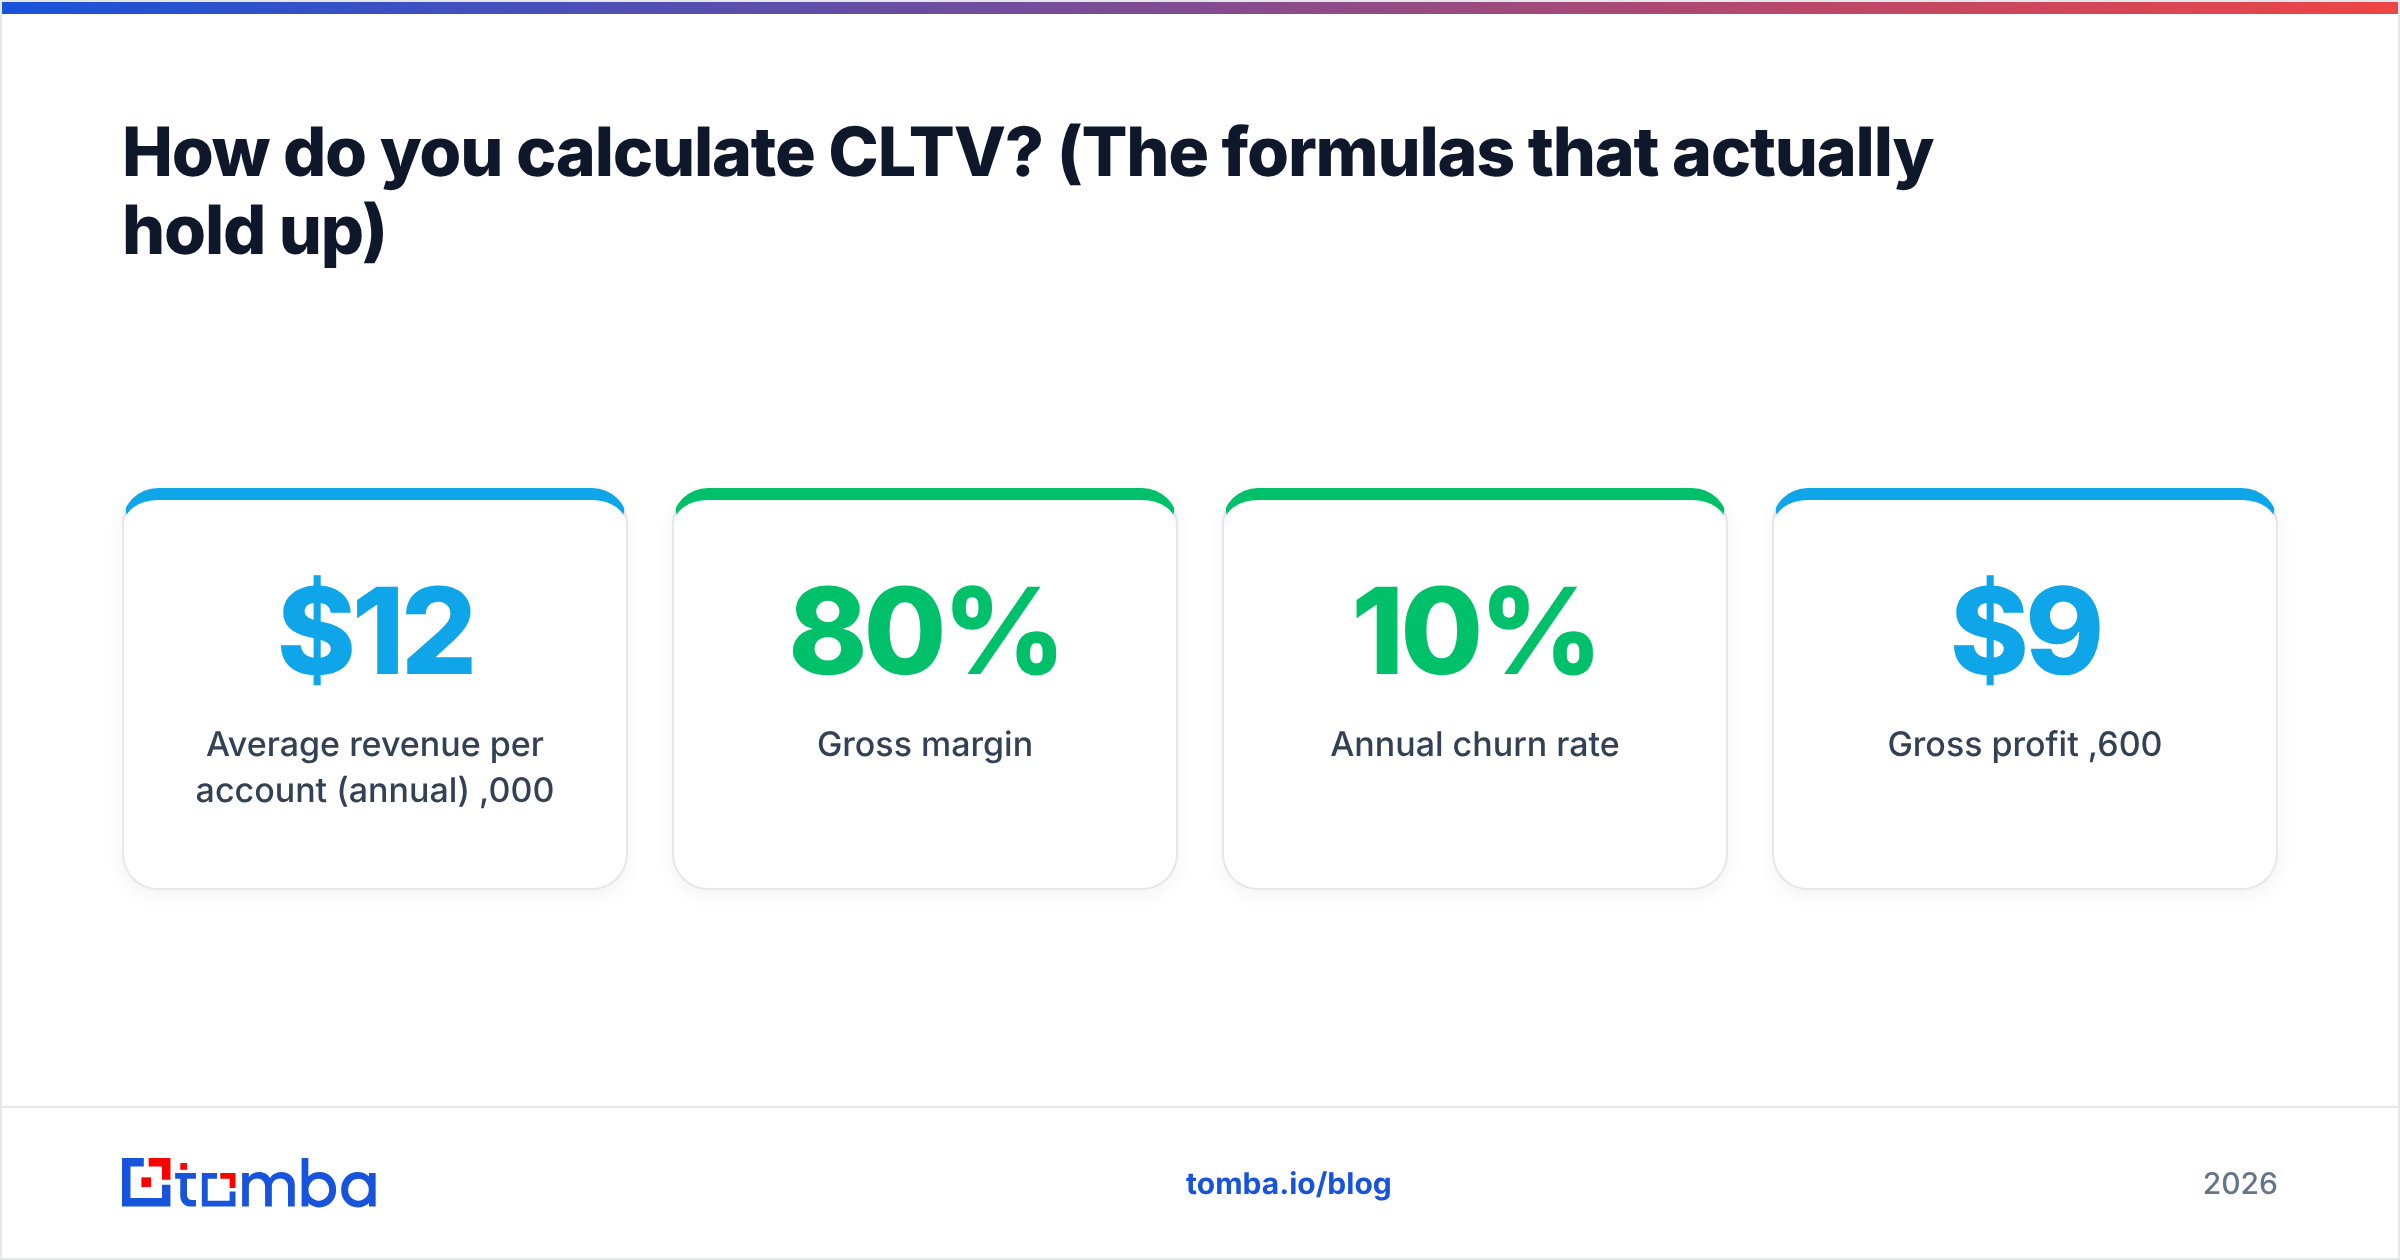
Here's a worked example using the margin-adjusted formula:
| Input | Value |
|---|---|
| Average revenue per account (annual) | $12,000 |
| Gross margin | 80% |
| Annual churn rate | 10% |
| Gross profit per year | $9,600 |
| CLTV = $9,600 ÷ 0.10 | $96,000 |
That $96,000 is the number you compare against acquisition cost — not the $12,000 contract, and definitely not the $60,000 of raw four-year revenue.
Which CLTV formula should you use?#
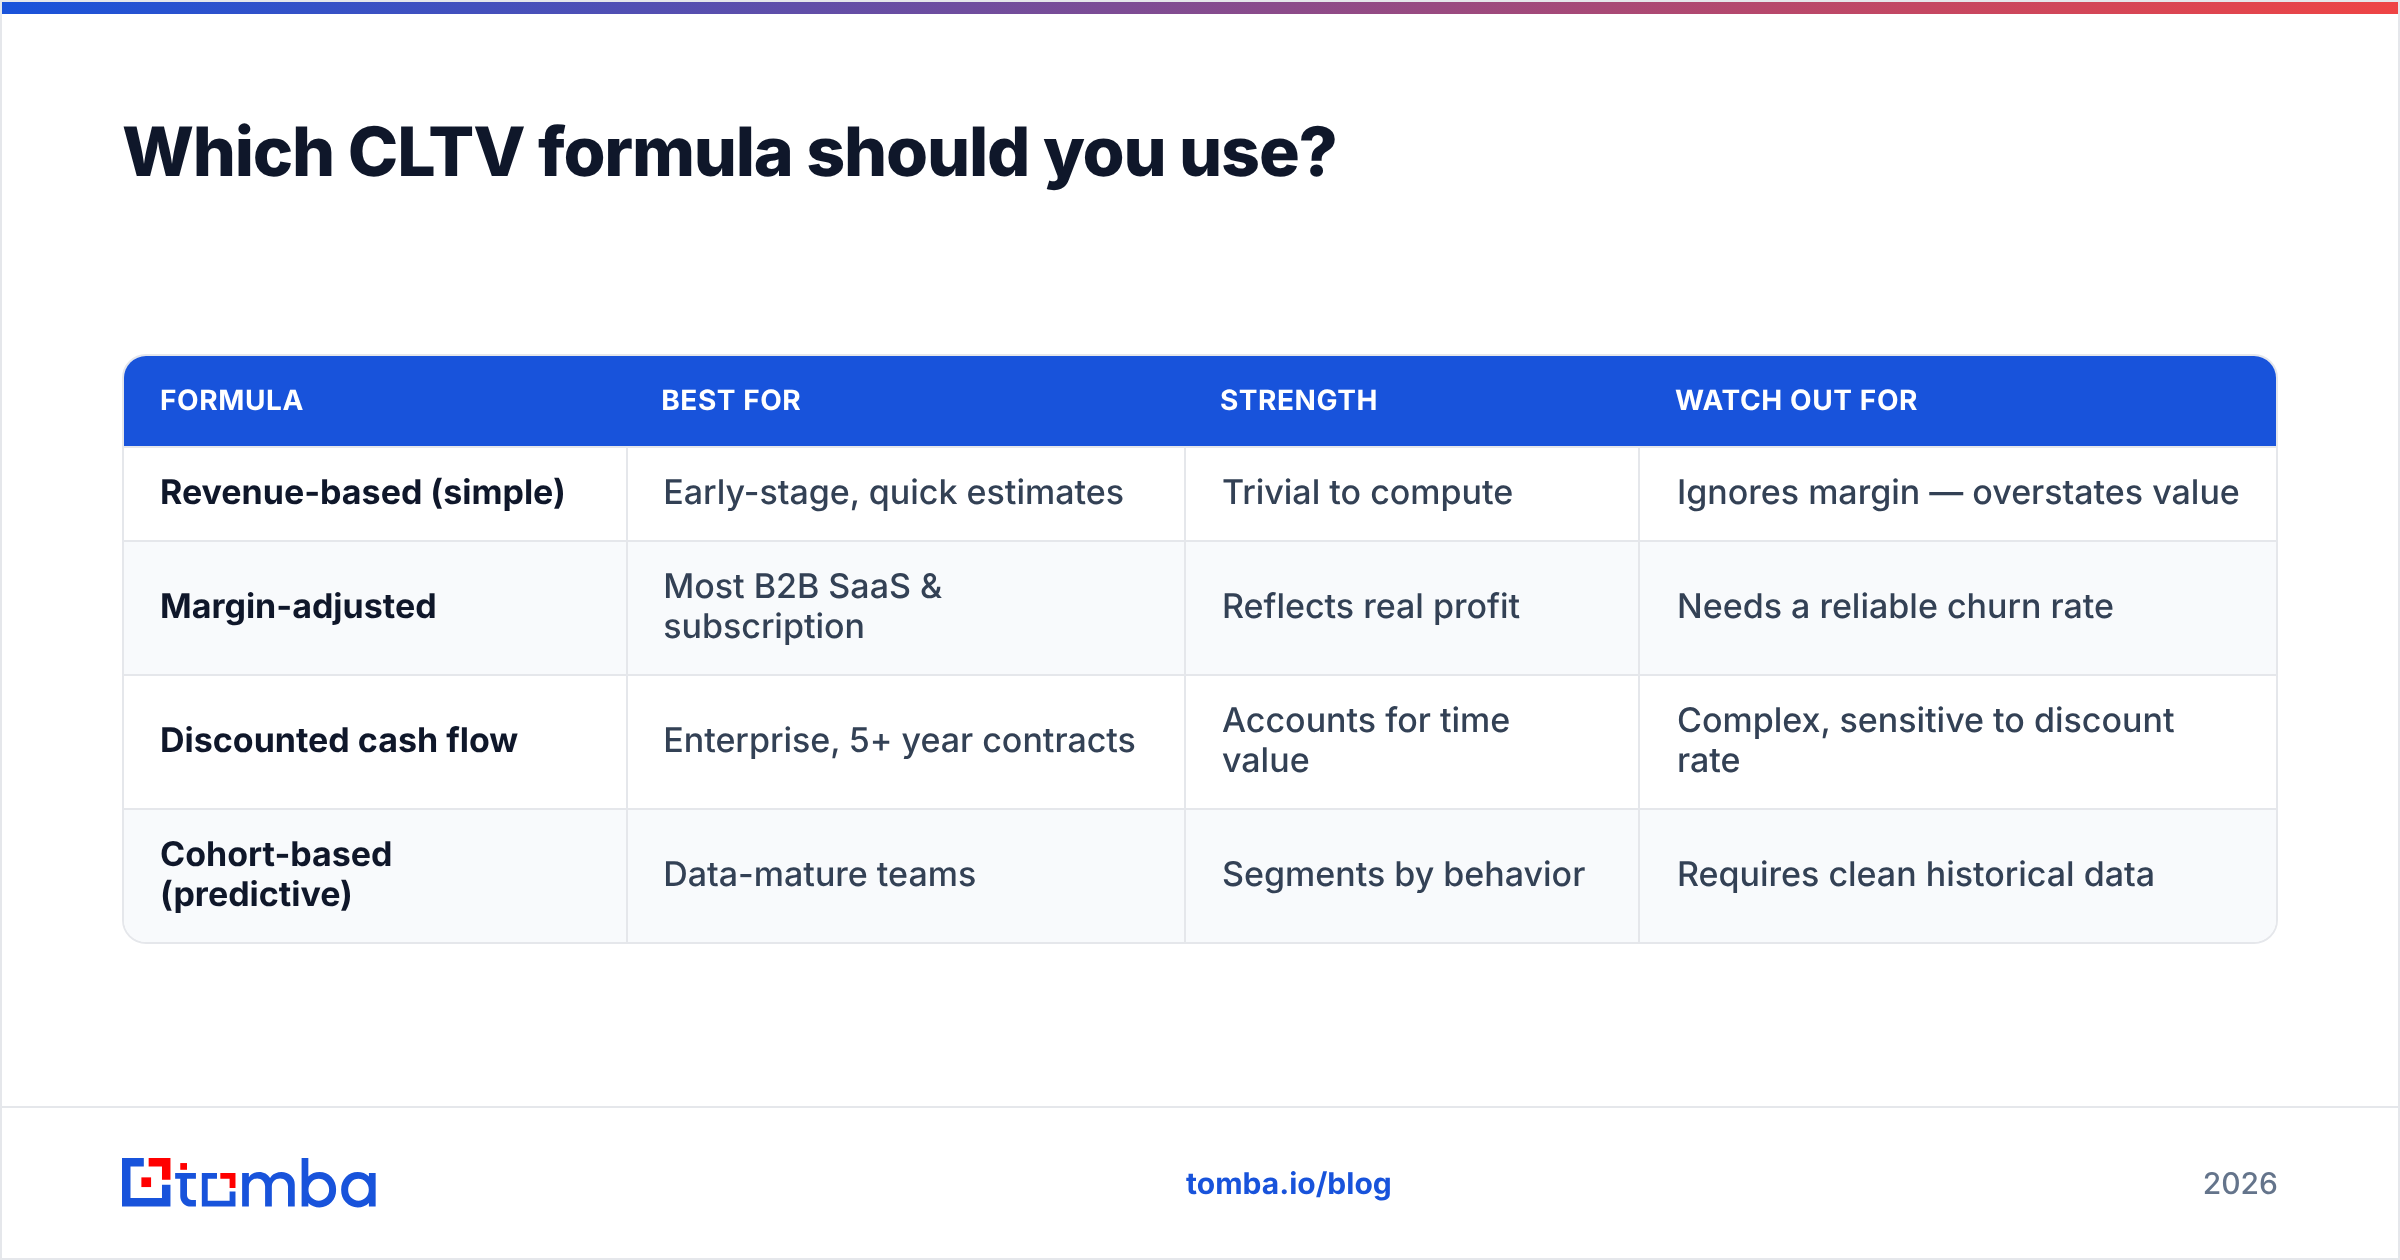
Match the formula to your business model. Here's the decision at a glance.
| Formula | Best for | Strength | Watch out for |
|---|---|---|---|
| Revenue-based (simple) | Early-stage, quick estimates | Trivial to compute | Ignores margin — overstates value |
| Margin-adjusted | Most B2B SaaS & subscription | Reflects real profit | Needs a reliable churn rate |
| Discounted cash flow | Enterprise, 5+ year contracts | Accounts for time value | Complex, sensitive to discount rate |
| Cohort-based (predictive) | Data-mature teams | Segments by behavior | Requires clean historical data |
If you only adopt one, use the margin-adjusted formula. It's the sweet spot of rigor and effort, and it's the version your CFO will accept without a fight.
What's a good CLTV:CAC ratio?#
The headline number is the ratio of lifetime value to customer acquisition cost (CAC), and the widely cited benchmark is 3:1.
- Below 1:1 — you lose money on every customer. Stop scaling, fix the funnel.
- 1:1 to 3:1 — you're viable but under-earning relative to spend; margins are thin.
- 3:1 — the healthy zone most SaaS investors and boards look for.
- Above 5:1 — often a sign you're under-investing in growth and leaving market share on the table.
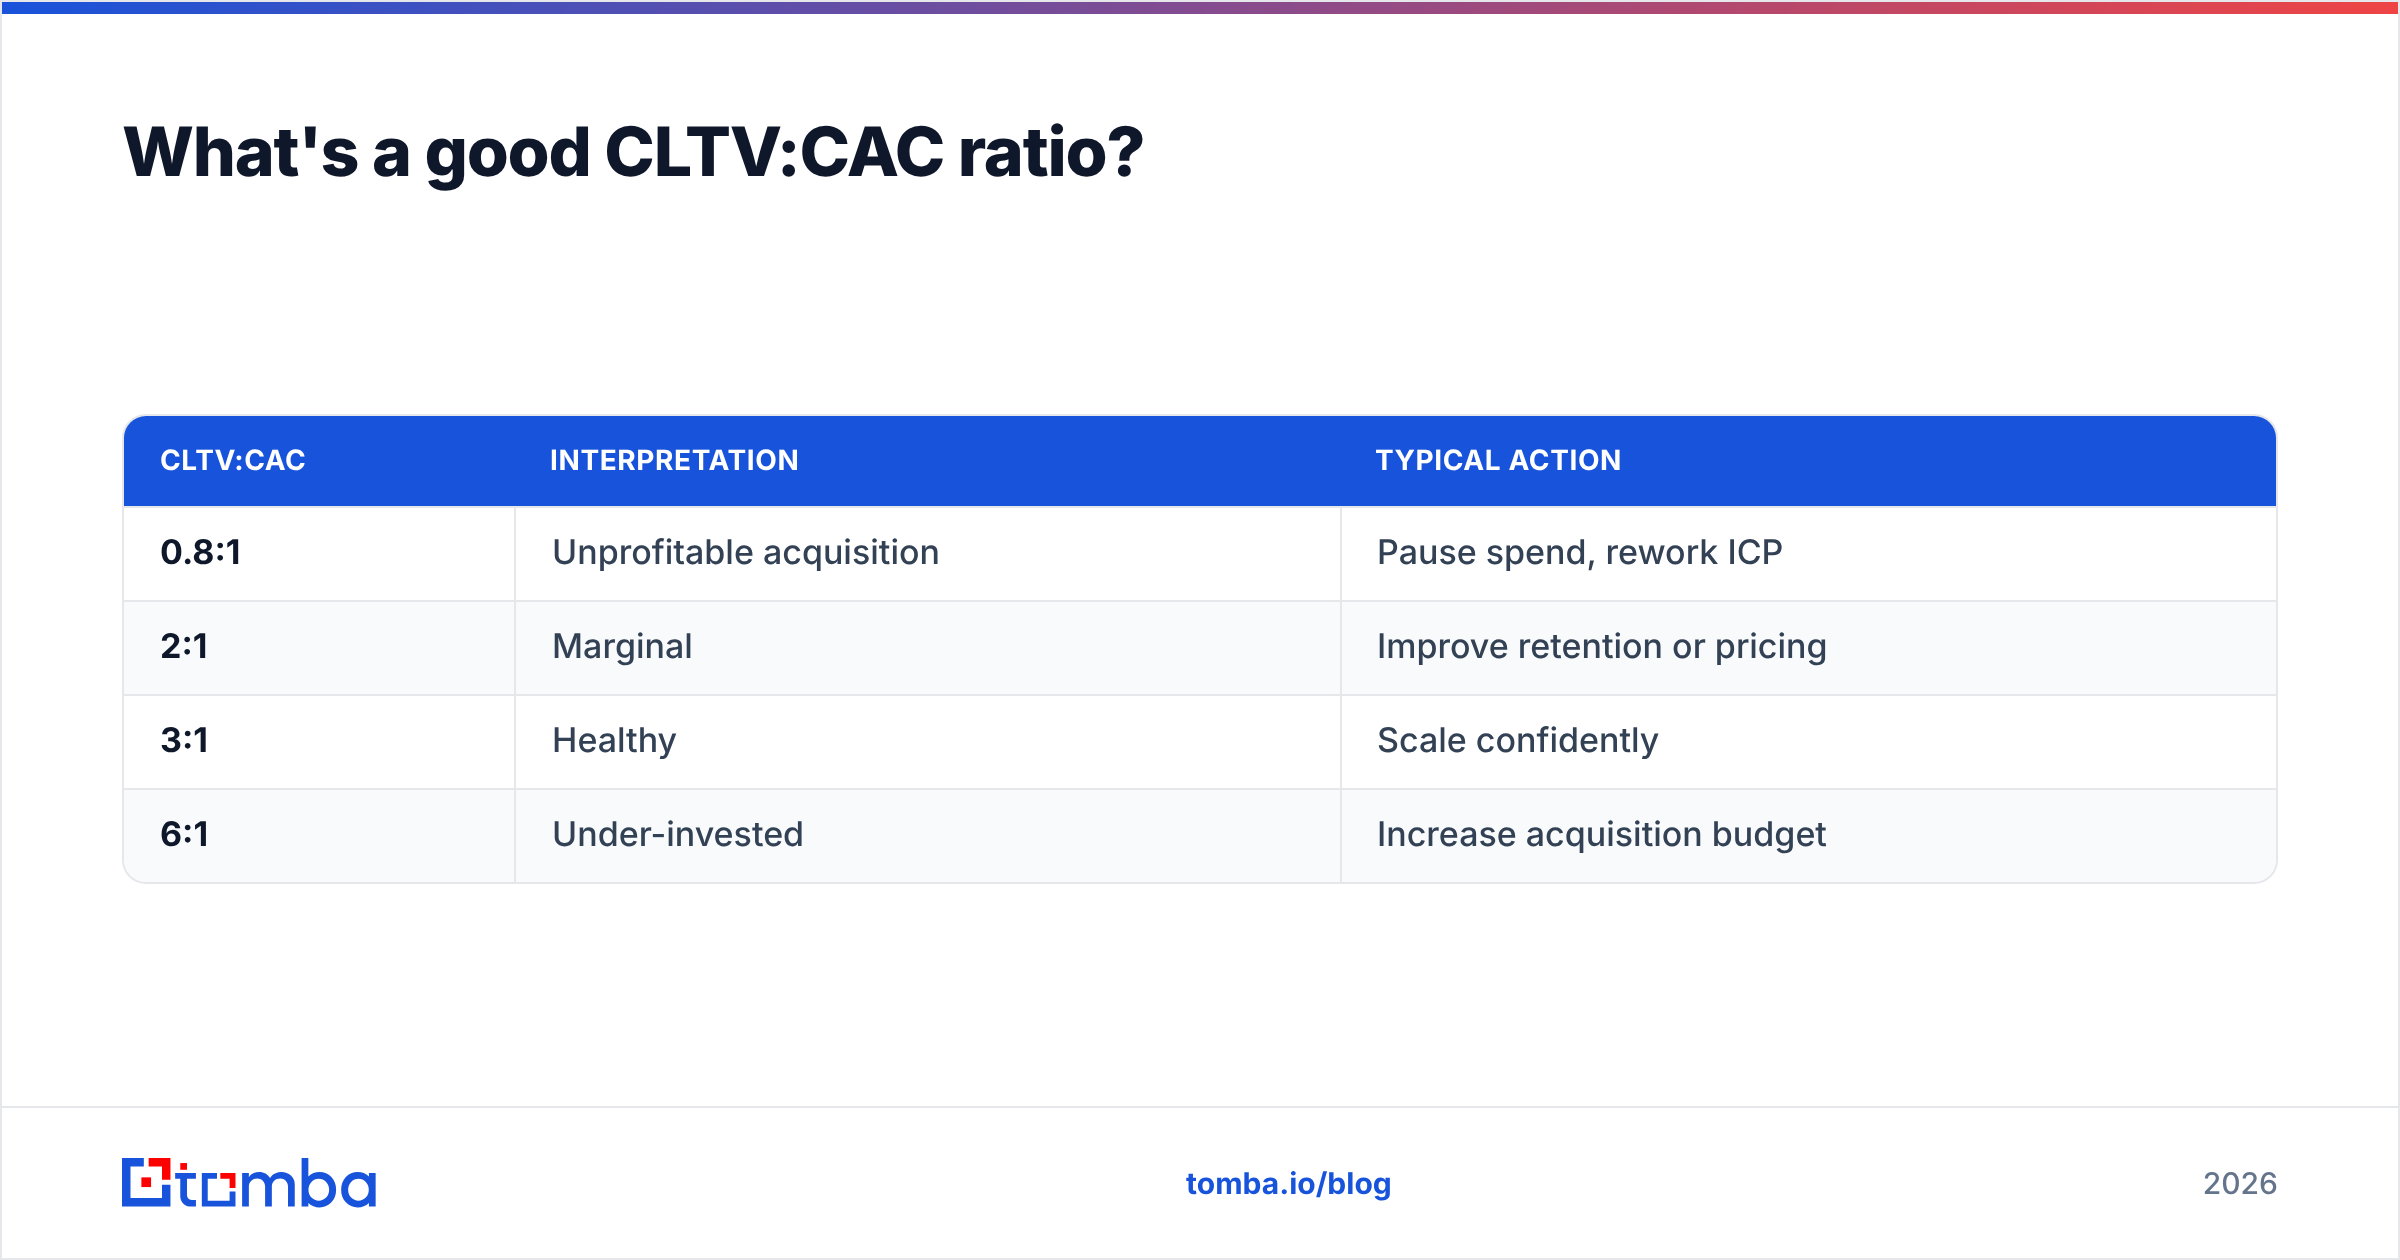
A quick sanity table:
| CLTV:CAC | Interpretation | Typical action |
|---|---|---|
| 0.8:1 | Unprofitable acquisition | Pause spend, rework ICP |
| 2:1 | Marginal | Improve retention or pricing |
| 3:1 | Healthy | Scale confidently |
| 6:1 | Under-invested | Increase acquisition budget |
HubSpot and most GTM analysts converge on this same 3:1 rule of thumb; you can read HubSpot's own breakdown of customer lifetime value for their version of the math. The point of the ratio isn't to hit a magic number — it's to know which lever (acquisition, retention, or price) to pull next.
Why does data quality make or break your CLTV?#
Here's the uncomfortable truth: CLTV is a garbage-in, garbage-out metric. Every input — churn rate, account count, revenue per account — sits on top of your CRM data. When that data is dirty, your CLTV is fiction.
Three ways bad data quietly wrecks the number:
- Duplicate accounts inflate your customer count, dragging average revenue per account down and making healthy customers look marginal.
- Stale or invalid contact data breaks retention outreach. If your renewal emails bounce because the champion left, you record avoidable churn that punishes CLTV.
- Missing firmographics make cohort segmentation impossible, so you can't see that enterprise accounts have 4x the CLTV of SMB — you just see a blurry average.
This is where clean acquisition and enrichment pay for themselves. Sourcing verified contacts with a reliable email finder and keeping records current through data enrichment means your churn and revenue inputs reflect reality. A well-maintained B2B database isn't a nice-to-have for CLTV — it's the foundation the whole calculation stands on.

How do you increase CLTV?#
You move CLTV by changing one of its inputs: revenue per account, margin, or churn. In practice, four levers do most of the work.
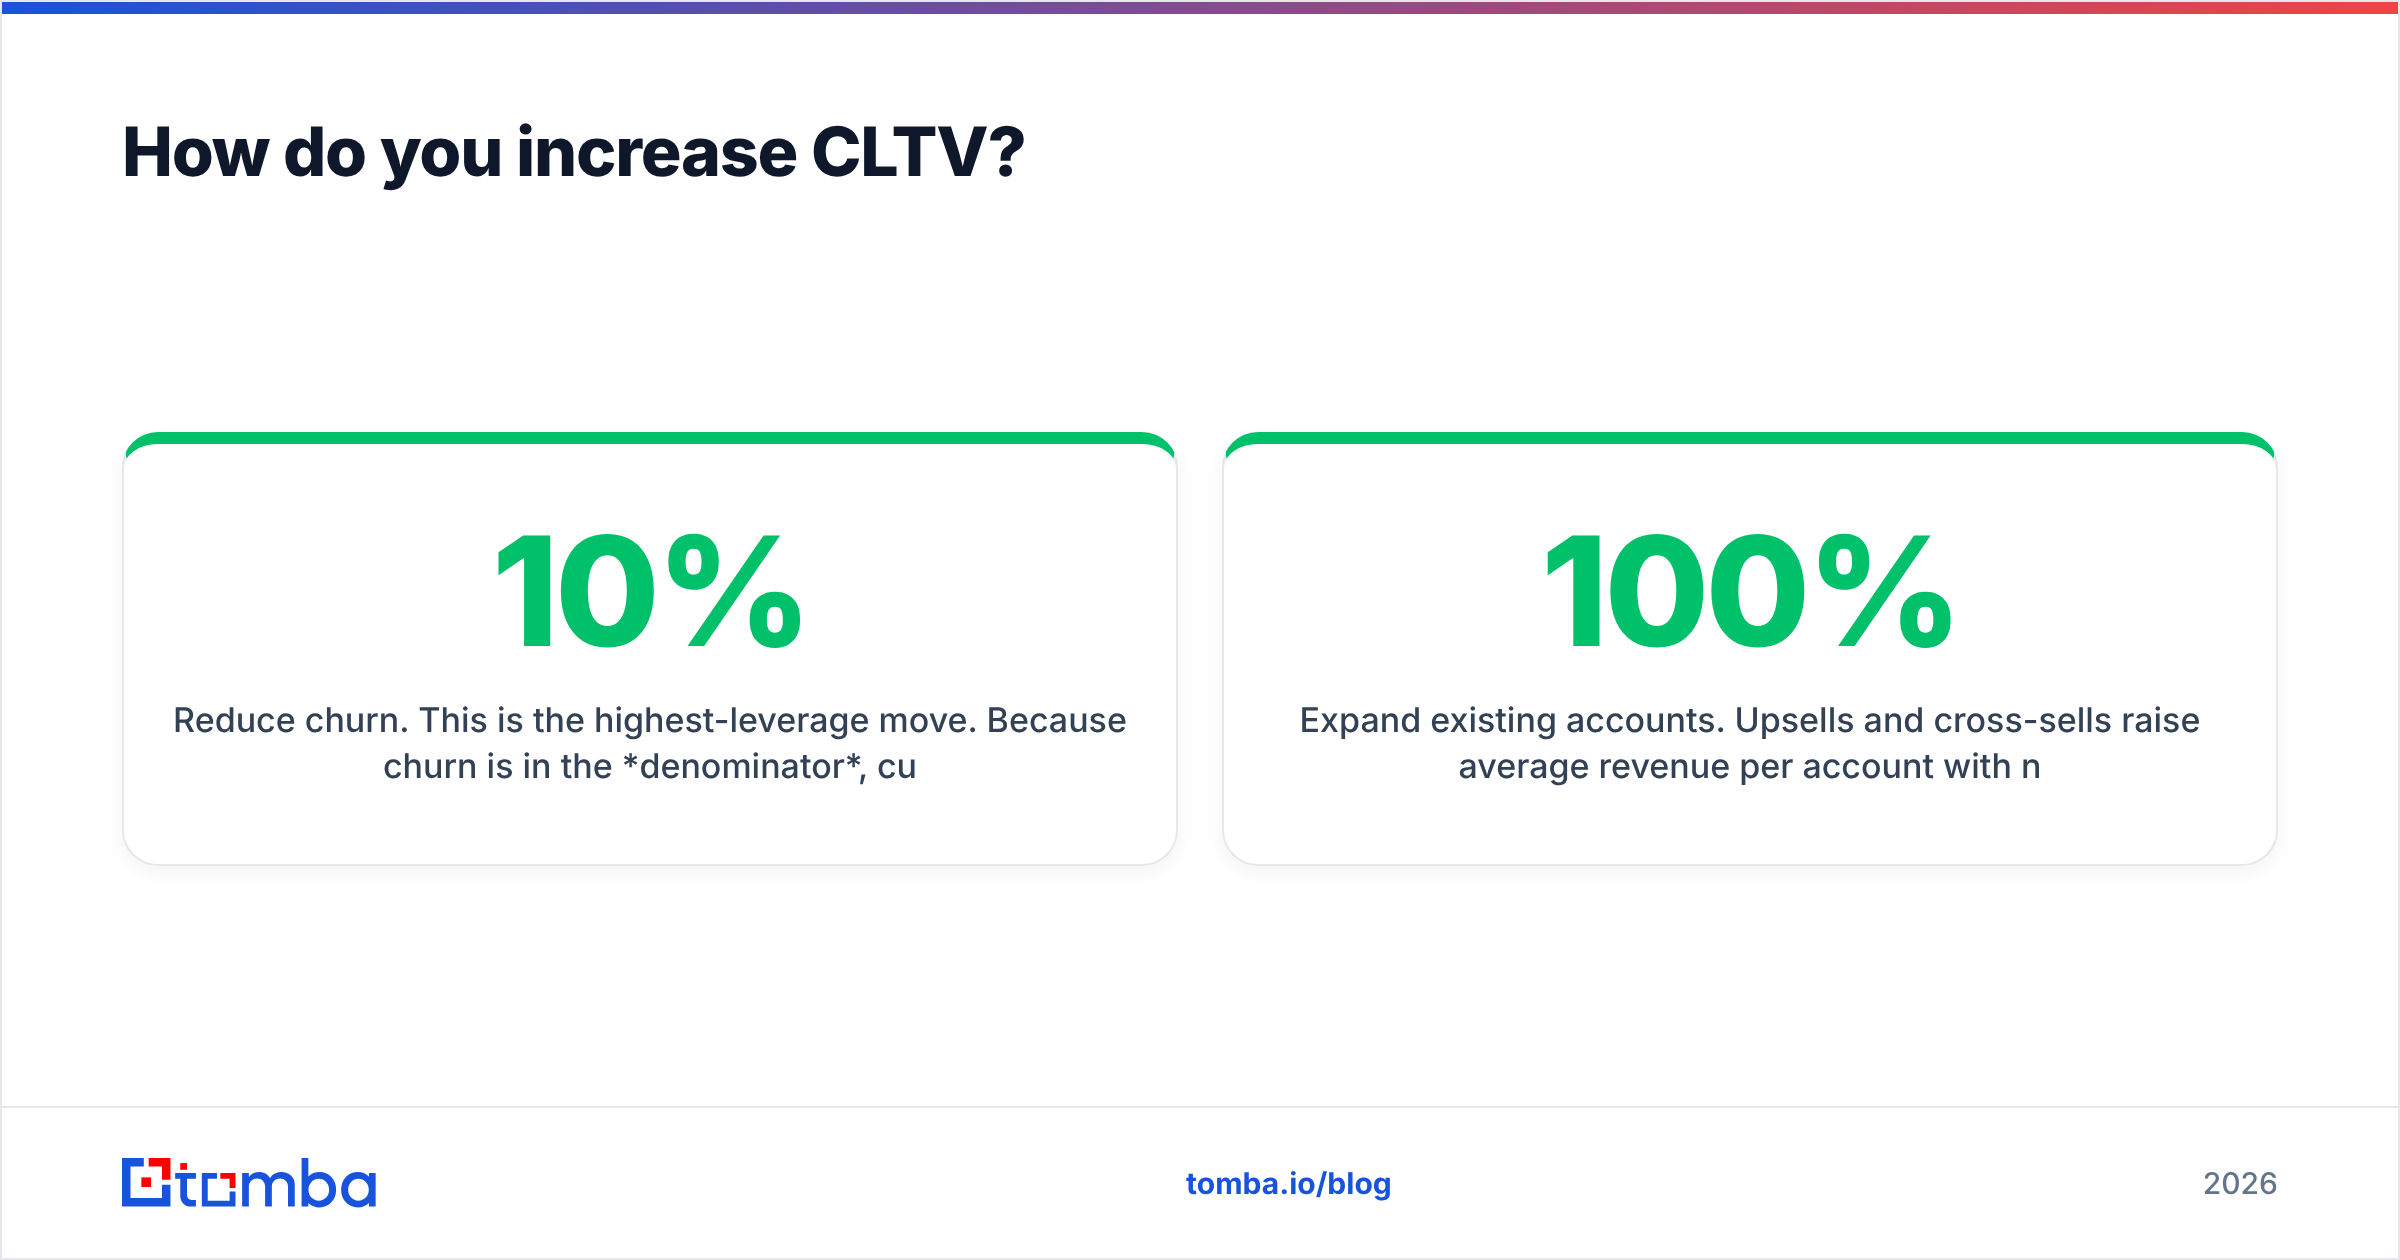
- Reduce churn. This is the highest-leverage move. Because churn is in the denominator, cutting it from 10% to 8% raises the earlier example's CLTV from $96,000 to $120,000 — a 25% gain from a 2-point improvement. Onboarding, proactive success touches, and health scoring all feed this.
- Expand existing accounts. Upsells and cross-sells raise average revenue per account with near-zero acquisition cost, which is why net revenue retention above 100% is the gold standard in SaaS.
- Improve gross margin. Automate manual delivery, self-serve the low-touch tier, and price for value rather than cost. Every margin point flows straight into CLTV.
- Sharpen your ICP. Acquiring customers who look like your best cohorts — not just anyone who converts — lifts the average lifetime value of every new signup. Salesforce's guidance on customer retention is a solid primer on the success motions behind this.
Notice that three of the four levers are retention and expansion, not acquisition. That's the whole insight behind CLTV: keeping and growing a good customer beats chasing a new one almost every time.
What are the most common CLTV mistakes?#
Even sophisticated teams trip on these:
- Using revenue instead of margin. The number one error. Revenue-based CLTV can be 3-4x too high, which leads you to overspend on acquisition.
- Assuming a static churn rate. Churn varies by cohort, segment, and season. One blended number hides that your SMB tier is bleeding while enterprise is rock-solid.
- Ignoring cost-to-serve. A high-revenue account that eats 40 support hours a month may have lower CLTV than a quiet mid-market one.
- Treating CLTV as a single number. It's a distribution. Segment it by acquisition channel, plan tier, and industry, or you'll optimize for the average and starve your best cohort.
- Never revisiting it. CLTV drifts as pricing, product, and churn change. Recompute quarterly, not once.
Gartner's research on customer analytics maturity makes a similar point: the value isn't the metric itself, it's the operational decisions it drives.
How does CLTV fit into your GTM motion?#
CLTV isn't a finance-only figure — it should touch every team:
- Marketing caps CAC by channel using CLTV, killing spend on channels that acquire low-value cohorts.
- Sales prioritizes deals and pods that resemble high-CLTV customers, and knows how much discounting a given account can absorb.
- Customer Success ranks accounts by lifetime value to allocate scarce CSM hours where they protect the most future revenue.
- Product decides roadmap bets by whether a feature moves retention or expansion for high-CLTV segments.
When all four teams pull from the same CLTV definition — built on the same clean data — you get an aligned GTM engine instead of four departments optimizing different numbers. That shared source of truth, again, comes back to data hygiene: consistent contact enrichment and verified records so every team is scoring the same reality.
Frequently asked questions#
Is CLTV the same as LTV? Yes. CLTV, CLV, and LTV all refer to customer lifetime value. "CLTV" and "CLV" simply emphasize the customer dimension; the math is identical.
How often should I recalculate CLTV? Quarterly for most B2B teams, or whenever pricing, packaging, or churn shifts materially. Static CLTV numbers go stale fast.
What churn rate should I use if mine swings a lot? Use segmented churn — separate rates for SMB, mid-market, and enterprise — rather than a blended average. A single volatile number produces a meaningless CLTV.
Can I calculate CLTV without historical data? You can estimate it with the simple formula and industry benchmarks, but predictive, cohort-based CLTV needs clean historical retention and revenue data to be trustworthy.
The bottom line#
CLTV is the metric that tells you which customers to chase, which to keep, and how much either is worth. Get the formula right (use margin, not revenue), watch the CLTV:CAC ratio (aim for 3:1), and — above all — build it on data you trust. The most elegant lifetime-value model in the world collapses the moment your churn rate is inflated by bounced renewal emails and duplicate accounts.
That's the part most teams skip. Before you model a single cohort, make sure the contacts feeding your CRM are real, current, and deduplicated. Start with verified, accurate contact data from the Tomba Email Finder — find the right decision-makers by domain, name, or company, keep your account records clean, and give every CLTV calculation a foundation it deserves. Check Tomba pricing to see which plan fits your team, from the free tier up.
Related guides#
Ready to find emails that actually work?
Join 150,000+ professionals who stopped guessing and started sending. Free credits on signup — no credit card required.
Get the Tomba newsletter
Practical outbound tactics and product updates — once every two weeks.
About the author