Cold Email ROI Calculator: How to Model Real Pipeline Returns
Most cold email ROI math stops at open rates. Here's the full model — data cost, bounce drag, reply-to-meeting decay, and CAC — plus the three levers that actually change the number.
TL;DR
- A cold email ROI calculator is just six multiplications and one subtraction. The hard part is sourcing honest inputs, not building the spreadsheet.
- Model the full chain: contacts → delivered → replies → positive replies → meetings booked → meetings held → opportunities → closed deals. Skipping a stage inflates your projection by 2-4x.
- Bounce rate is the cheapest lever to fix and the one most teams ignore. Going from 12% bounce to 2% recovers ~11% of your pipeline before you touch a single word of copy.
- Report on gross-margin ROI and cost per meeting, not revenue ROI. Revenue ROI makes every campaign look like a genius decision.
- Baseline scenario in this post: $500 spent, 7 meetings held, 0.88 deals, $5,292 revenue, $567 CAC. Every number is reconstructed step by step below.
What is a cold email ROI calculator?#
A cold email ROI calculator is a model that converts campaign inputs (contacts, costs, conversion rates) into outputs you can defend in a board meeting: cost per meeting, customer acquisition cost, payback period, and return multiple.
Think of it like a water pipe with seven joints. Water goes in at one end — your contact list. At every joint, some leaks out: bad addresses, ignored emails, polite no-thanks replies, no-shows, stalled deals. What comes out the far end is revenue. The calculator's job is to tell you how much leaks at each joint, and which joint is worth paying a plumber to fix.
Most teams build a calculator with two joints — "we sent 1,000 emails, we got 3 customers, ROI is great" — and then wonder why the next campaign returns nothing. The gap between those two campaigns lives in the joints they never modeled.
What inputs does the model actually need?#
Here is the minimum viable input set. Each one should come from your own historical data, not from a vendor's landing page.
- List size and data cost. How many contacts, and what you paid per contact — including the credits you burned on failed lookups.
- Deliverability inputs. Bounce rate, spam-placement estimate, and inbox capacity (how many sends per mailbox per day before your sender reputation degrades).
- Engagement inputs. Reply rate on delivered mail, and the share of replies that are actually positive. Open rate is not an input — Apple Mail Privacy Protection made it noise.
- Meeting inputs. Positive-reply-to-meeting-booked rate, and show rate on booked meetings.
- Sales inputs. Meeting-to-opportunity rate, opportunity-to-close rate, average contract value, and gross margin.
- Cost inputs. Data, sending infrastructure, sequencer license, and — the one everyone forgets — the fully-loaded hourly cost of the human running it.
If you cannot fill in more than four of these from real data, you do not have a calculator. You have a wish.

How do you calculate cold email ROI step by step?#
Let's run a concrete B2B SaaS scenario. Mid-market ACV, one SDR, one month.
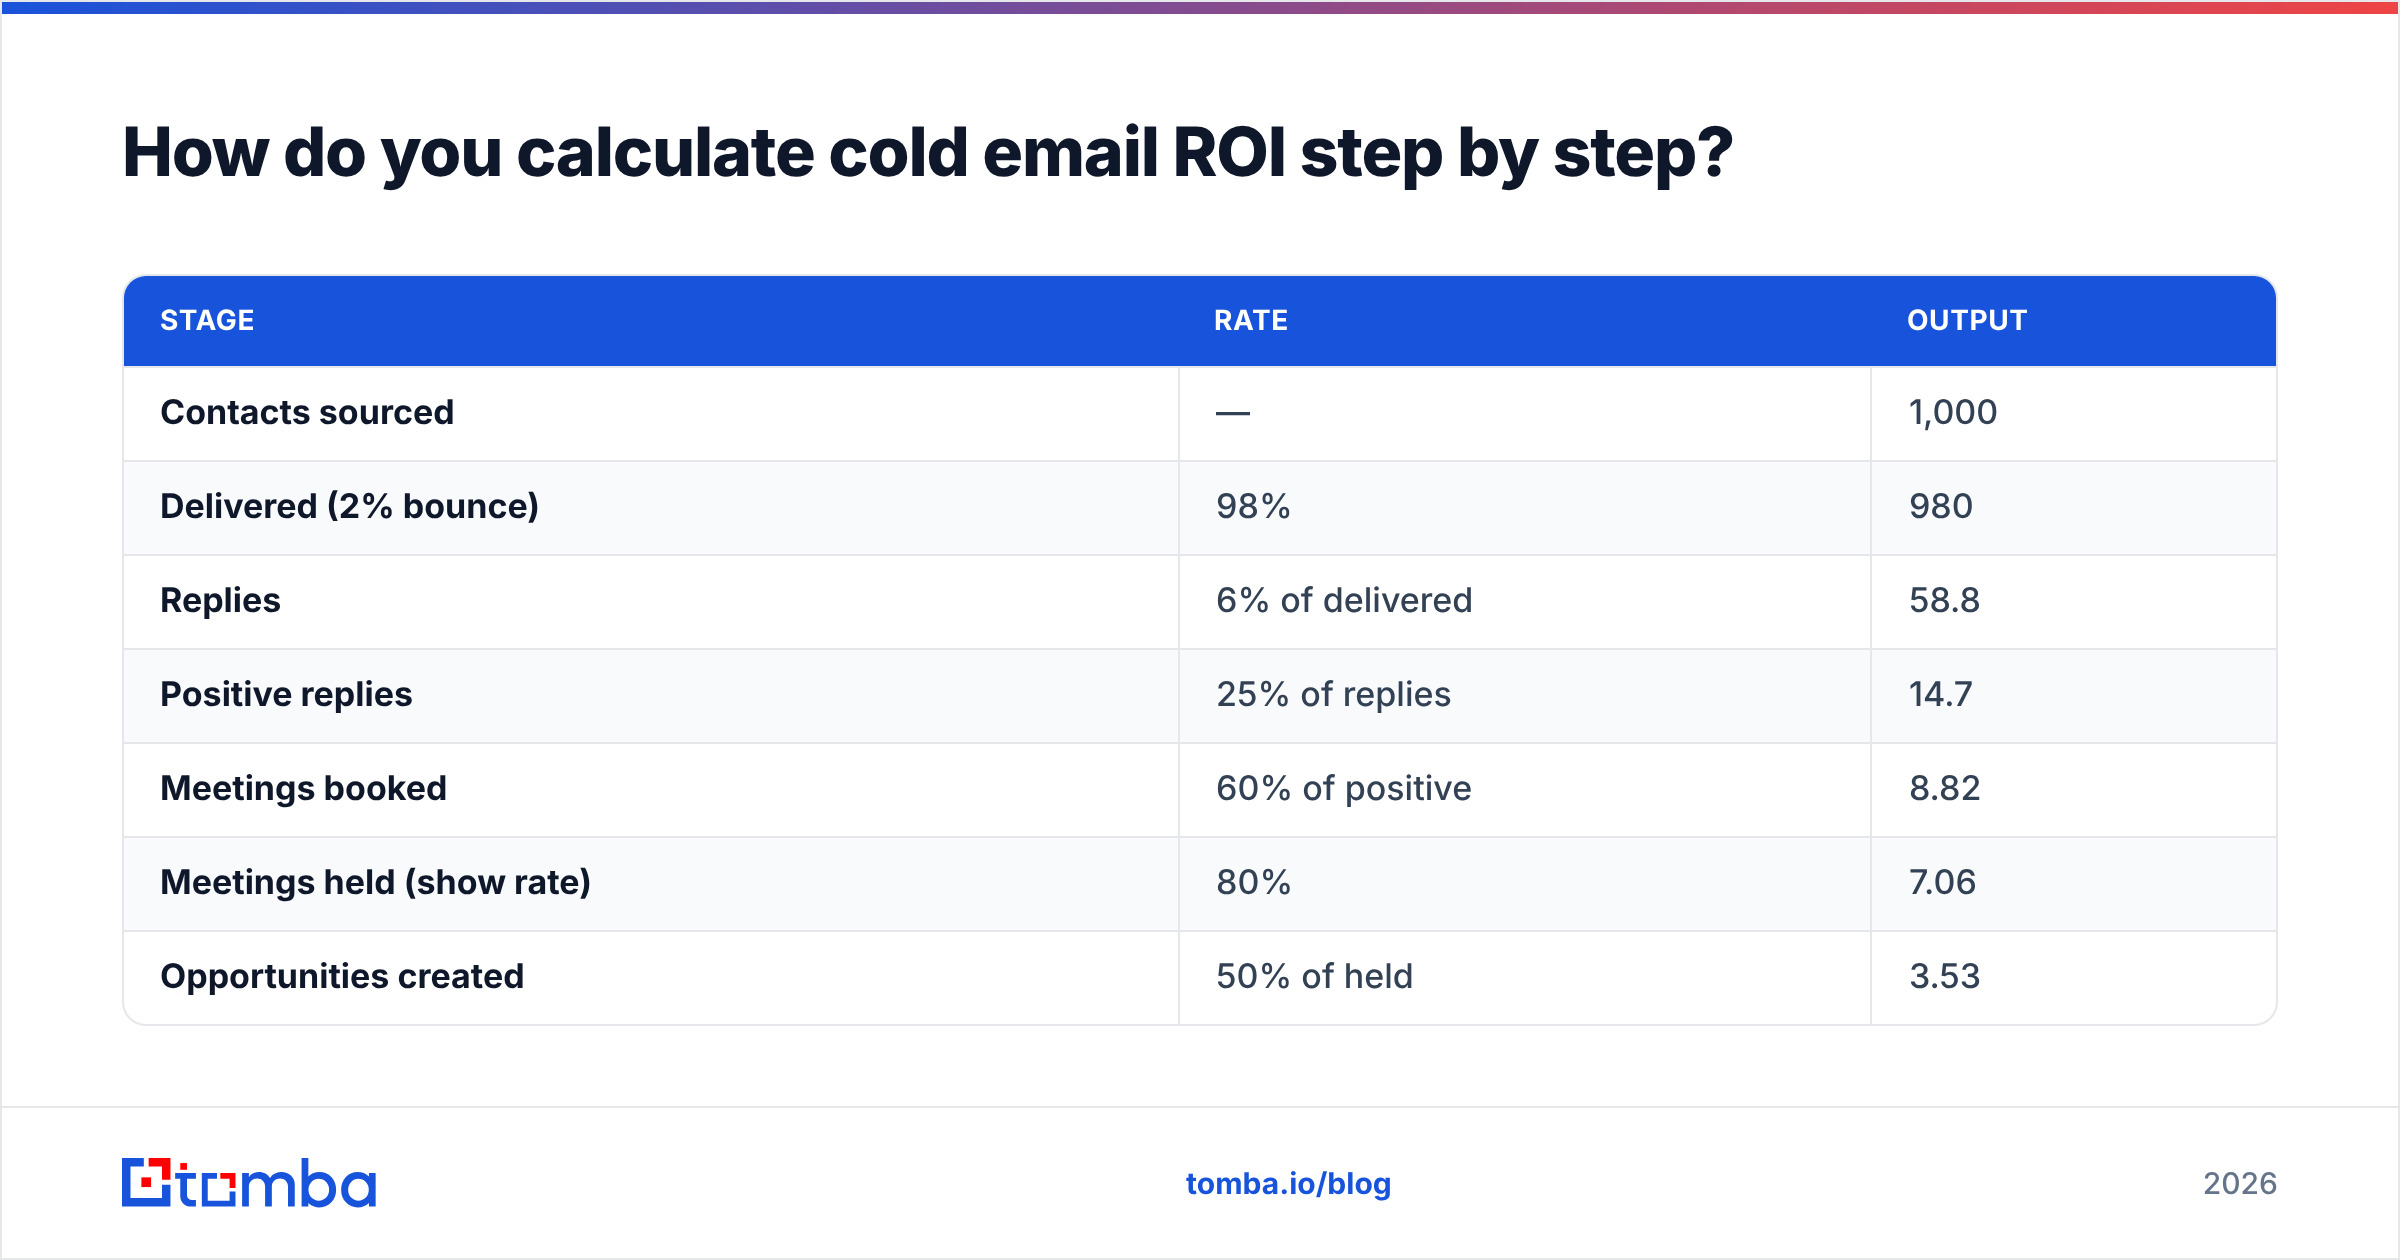
Starting point: 1,000 sourced contacts.
| Stage | Rate | Output |
|---|---|---|
| Contacts sourced | — | 1,000 |
| Delivered (2% bounce) | 98% | 980 |
| Replies | 6% of delivered | 58.8 |
| Positive replies | 25% of replies | 14.7 |
| Meetings booked | 60% of positive | 8.82 |
| Meetings held (show rate) | 80% | 7.06 |
| Opportunities created | 50% of held | 3.53 |
| Closed-won deals | 25% of opps | 0.88 |
At an ACV of $6,000, that 0.88 deals is $5,292 in new revenue.
Now the cost side:
| Cost line | Amount |
|---|---|
| Data (1,000 contacts, sourced + verified) | $103 |
| Sending infrastructure (3 mailboxes + domains) | $60 |
| Sequencer license (prorated) | $97 |
| SDR time (6 hrs @ $40 fully loaded) | $240 |
| Total campaign cost | $500 |
Revenue ROI = ($5,292 − $500) / $500 = 9.58x, or 958%.
That number is real, but it is also the number that gets people fired six months later. Apply gross margin — call it 80% for a software product — and your gross profit is $4,234. Gross-margin ROI = ($4,234 − $500) / $500 = 7.47x.
Two more metrics matter more than the ROI multiple:
- Cost per meeting held: $500 / 7.06 = $71
- CAC (campaign-marginal): $500 / 0.88 = $567
Compare that CAC to your customer acquisition cost from other channels. If paid search is bringing customers in at $1,400 and cold email at $567, the strategic question answers itself — and it answers itself in a way that no "958% ROI" headline ever could.
One honest caveat: this CAC is marginal. It excludes your AE's salary, your CRM seat, your marketing overhead. Blended CAC will always be higher. Say so out loud in the board deck before someone else does.
Which lever moves the number most?#
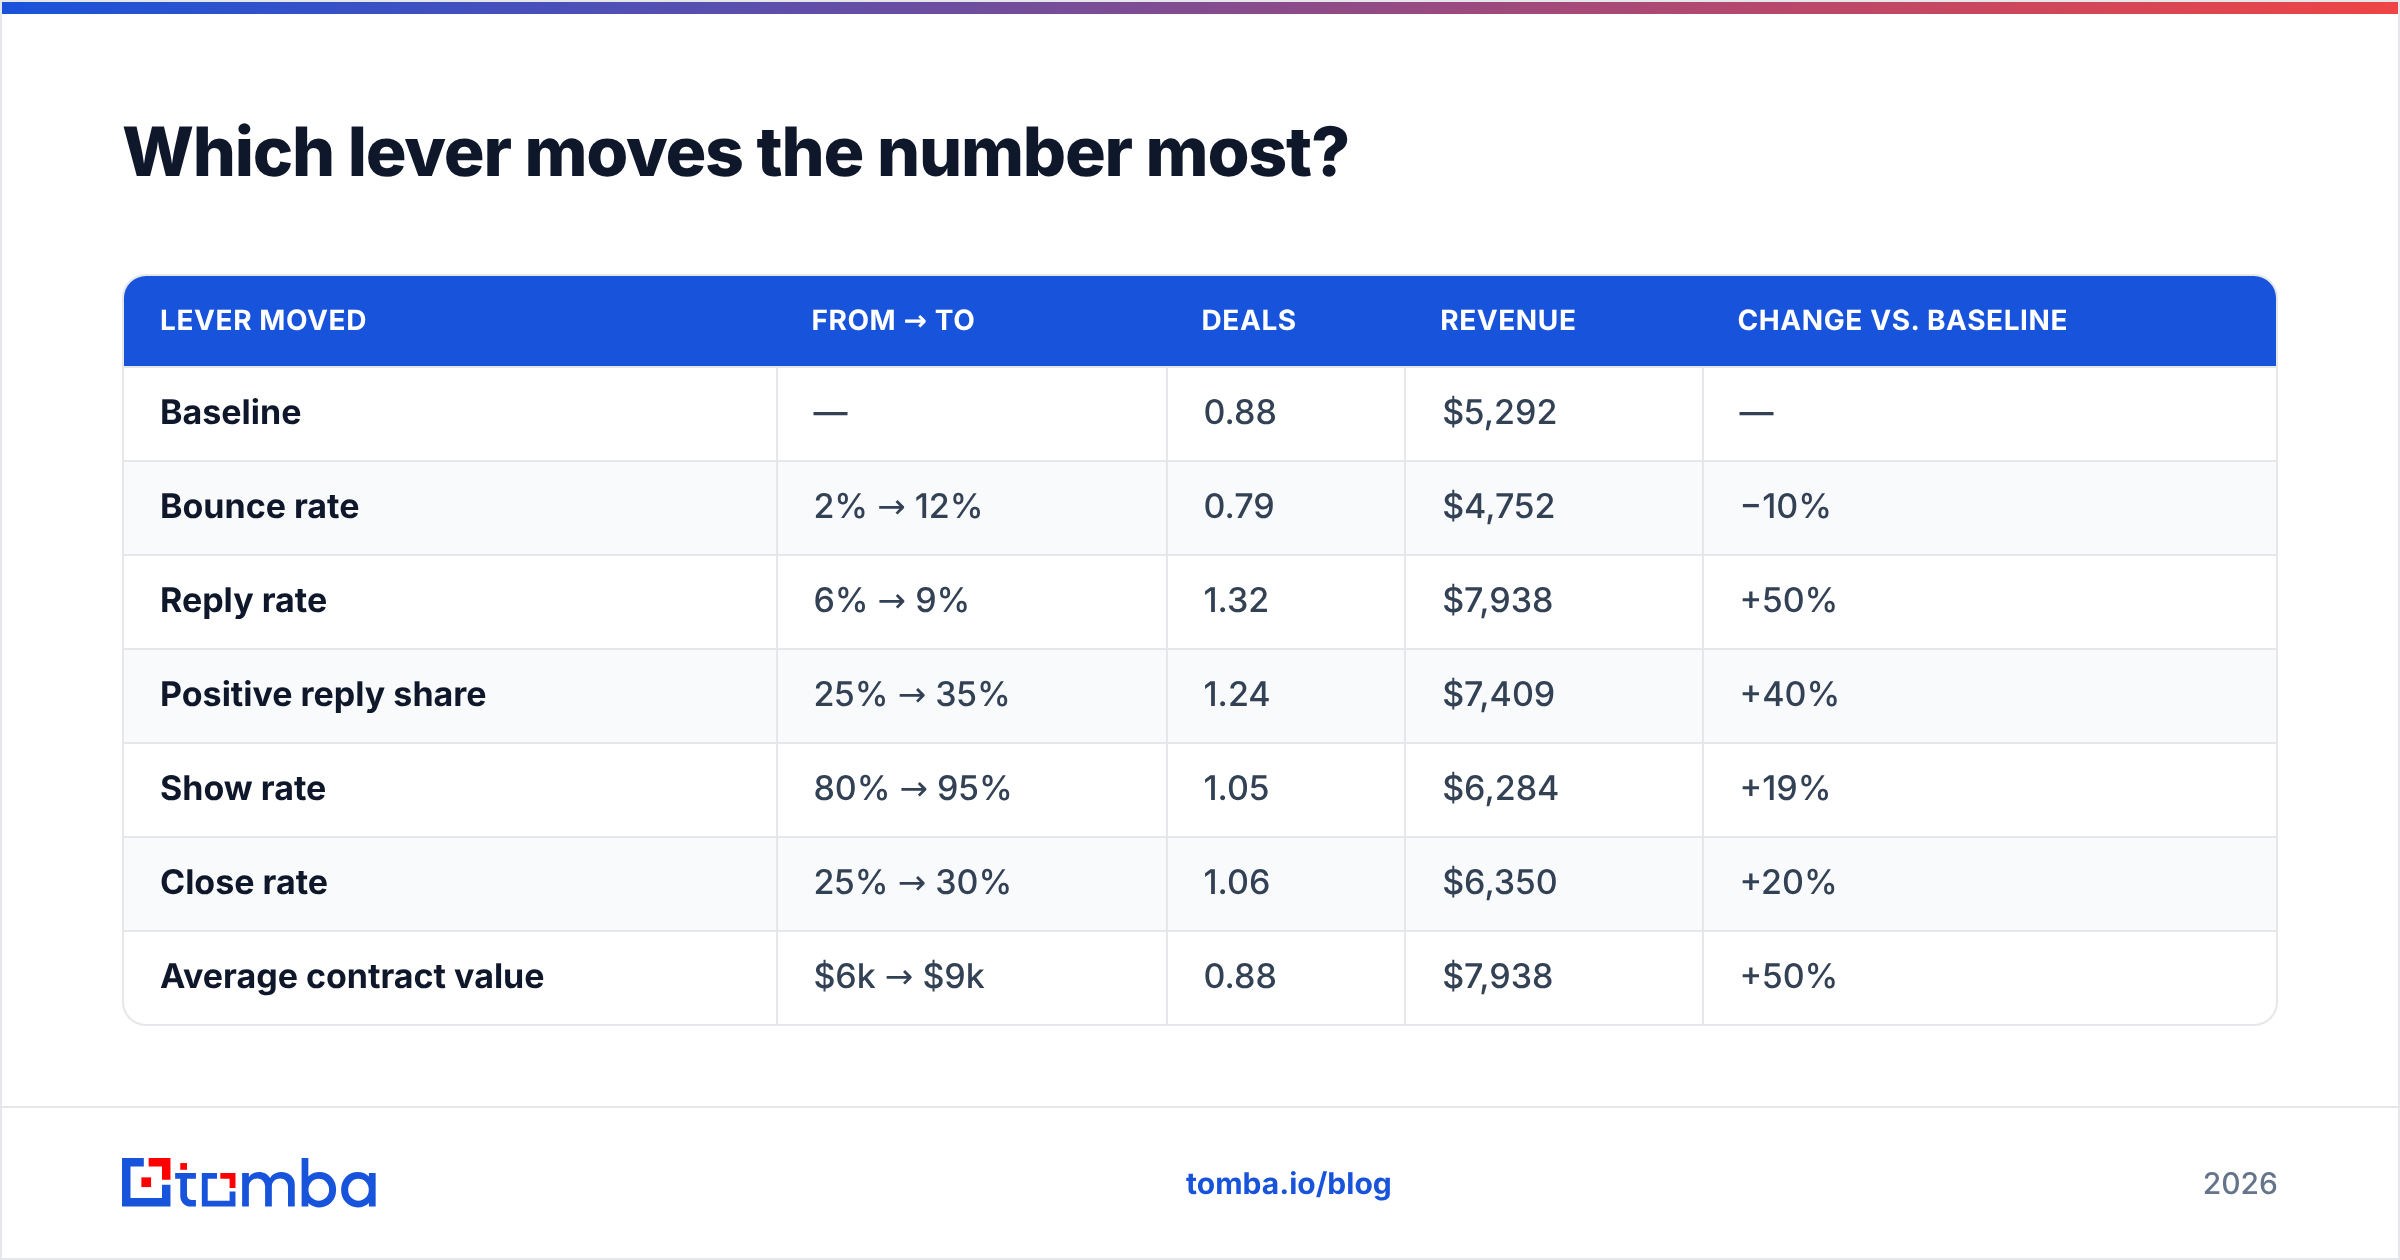
This is where a calculator earns its keep. Change one input at a time from the baseline and watch what happens to closed-won revenue.
| Lever moved | From → To | Deals | Revenue | Change vs. baseline |
|---|---|---|---|---|
| Baseline | — | 0.88 | $5,292 | — |
| Bounce rate | 2% → 12% | 0.79 | $4,752 | −10% |
| Reply rate | 6% → 9% | 1.32 | $7,938 | +50% |
| Positive reply share | 25% → 35% | 1.24 | $7,409 | +40% |
| Show rate | 80% → 95% | 1.05 | $6,284 | +19% |
| Close rate | 25% → 30% | 1.06 | $6,350 | +20% |
| Average contract value | $6k → $9k | 0.88 | $7,938 | +50% |
Three things fall out of this table.
First, reply rate and ACV are tied for the biggest single lever. A 50% revenue lift from a 3-point reply-rate improvement is why copy and targeting get all the attention. It's earned attention.
Second, ACV is the lever nobody talks about in cold email posts — because it isn't a cold email problem. Moving upmarket by one segment does more for your ROI than any subject line ever will. If your calculator says ACV is your biggest lever, stop optimizing sequences and go fix your ICP.
Third, bounce rate is asymmetric. The 12% → 2% fix only "recovers" 10% of revenue in this table, which looks small. But that framing is wrong, and here's why: a 12% bounce rate does not just cost you 12% of your sends. It torches your email deliverability and drags the reply rate on the other 88% down with it. Mailbox providers treat high hard-bounce volume as a spam-trap signal. Once you're in the promotions tab or the junk folder, your 6% reply rate becomes a 2% reply rate, and the calculator — which assumed independence between bounce and reply — has quietly lied to you.
The compounding version of that row is closer to −40% revenue, not −10%. Deliverability inputs are the one place where a naive linear model understates the damage.
How does data sourcing change the math?#
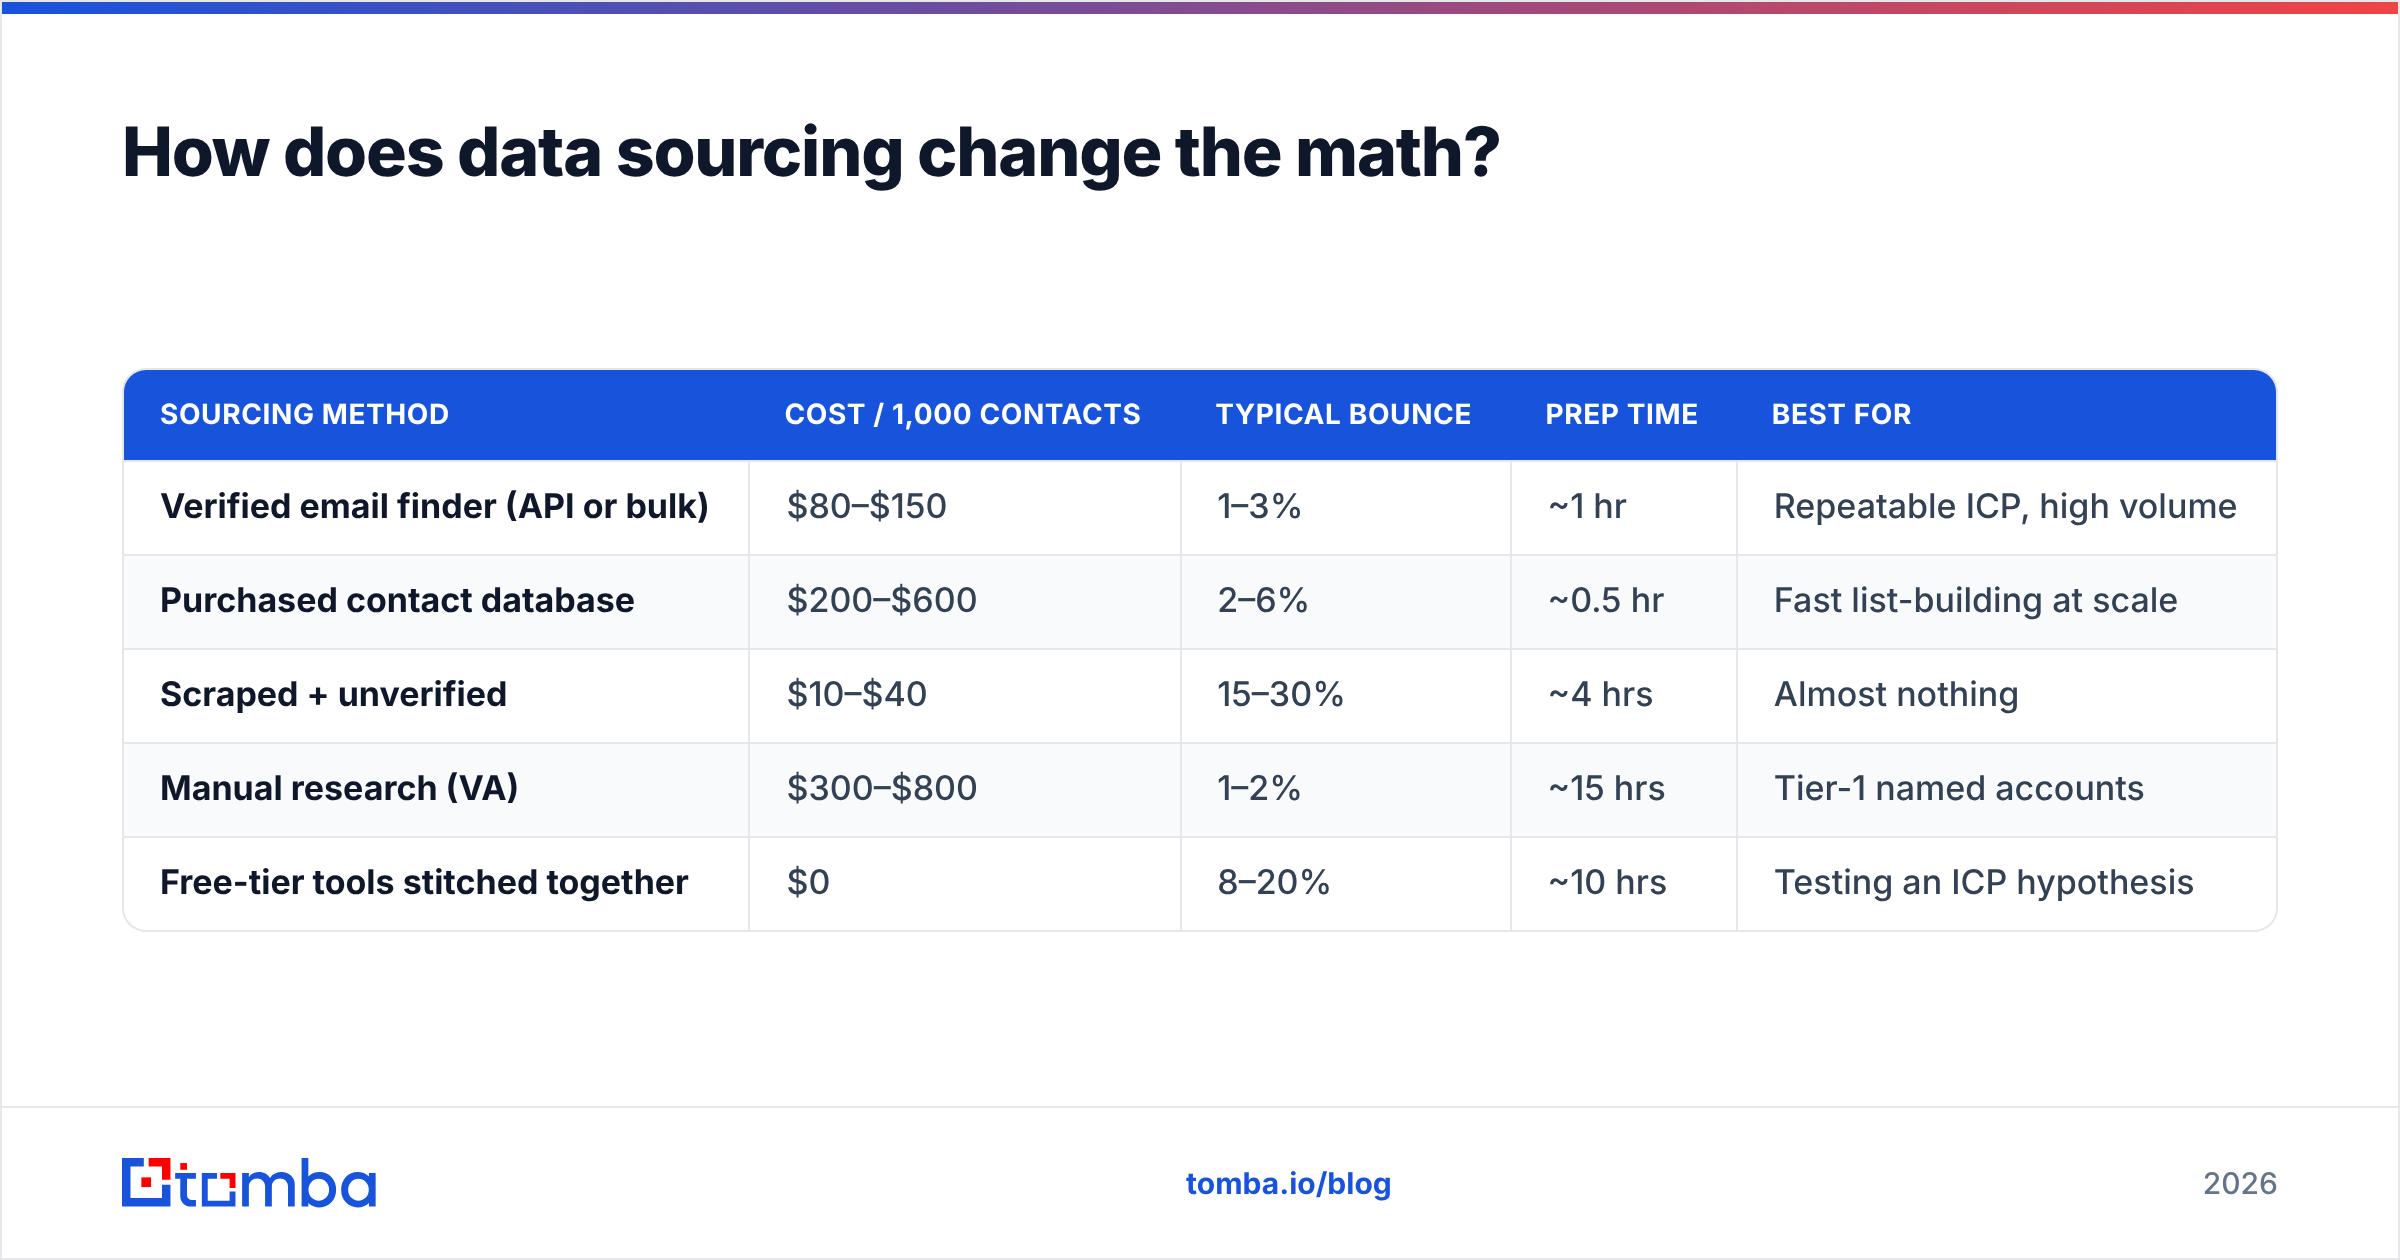
The $103 data line in our cost table is doing a lot of quiet work. Change it and you change bounce rate, reply rate, and SDR hours all at once.
| Sourcing method | Cost / 1,000 contacts | Typical bounce | Prep time | Best for |
|---|---|---|---|---|
| Verified email finder (API or bulk) | $80–$150 | 1–3% | ~1 hr | Repeatable ICP, high volume |
| Purchased contact database | $200–$600 | 2–6% | ~0.5 hr | Fast list-building at scale |
| Scraped + unverified | $10–$40 | 15–30% | ~4 hrs | Almost nothing |
| Manual research (VA) | $300–$800 | 1–2% | ~15 hrs | Tier-1 named accounts |
| Free-tier tools stitched together | $0 | 8–20% | ~10 hrs | Testing an ICP hypothesis |
Run the scraped-and-unverified row through the calculator: you save $70 on data, you lose ~$1,300 in revenue to bounce drag alone, and you burn three extra SDR hours ($120). Net effect: you spent $50 to lose $1,350. That is the single most common unforced error in outbound, and it happens because the data line is the only cost people can see at purchase time.
Purchased databases sit in a different place on the curve. Vendors like BookYourData sell pre-built, human-verified lists with published accuracy guarantees — you pay more per contact than you would running your own lookups, but you skip the enrichment step entirely and start sending on day one. For teams whose bottleneck is SDR hours rather than budget, that trade is frequently correct. For teams building a repeatable, ICP-specific motion where the same domains get searched every month, a bulk email finder with a verification pass usually wins on cost per deliverable contact — which is the only cost per contact that belongs in the calculator.
Whichever route you take, run a verify emails pass on the list before it touches your sequencer. Verification is cheap. Domain reputation is not.

What does a realistic payback period look like?#
ROI multiples are a vanity framing when you're spending money in month one and collecting it in month five. Payback period is the honest version.
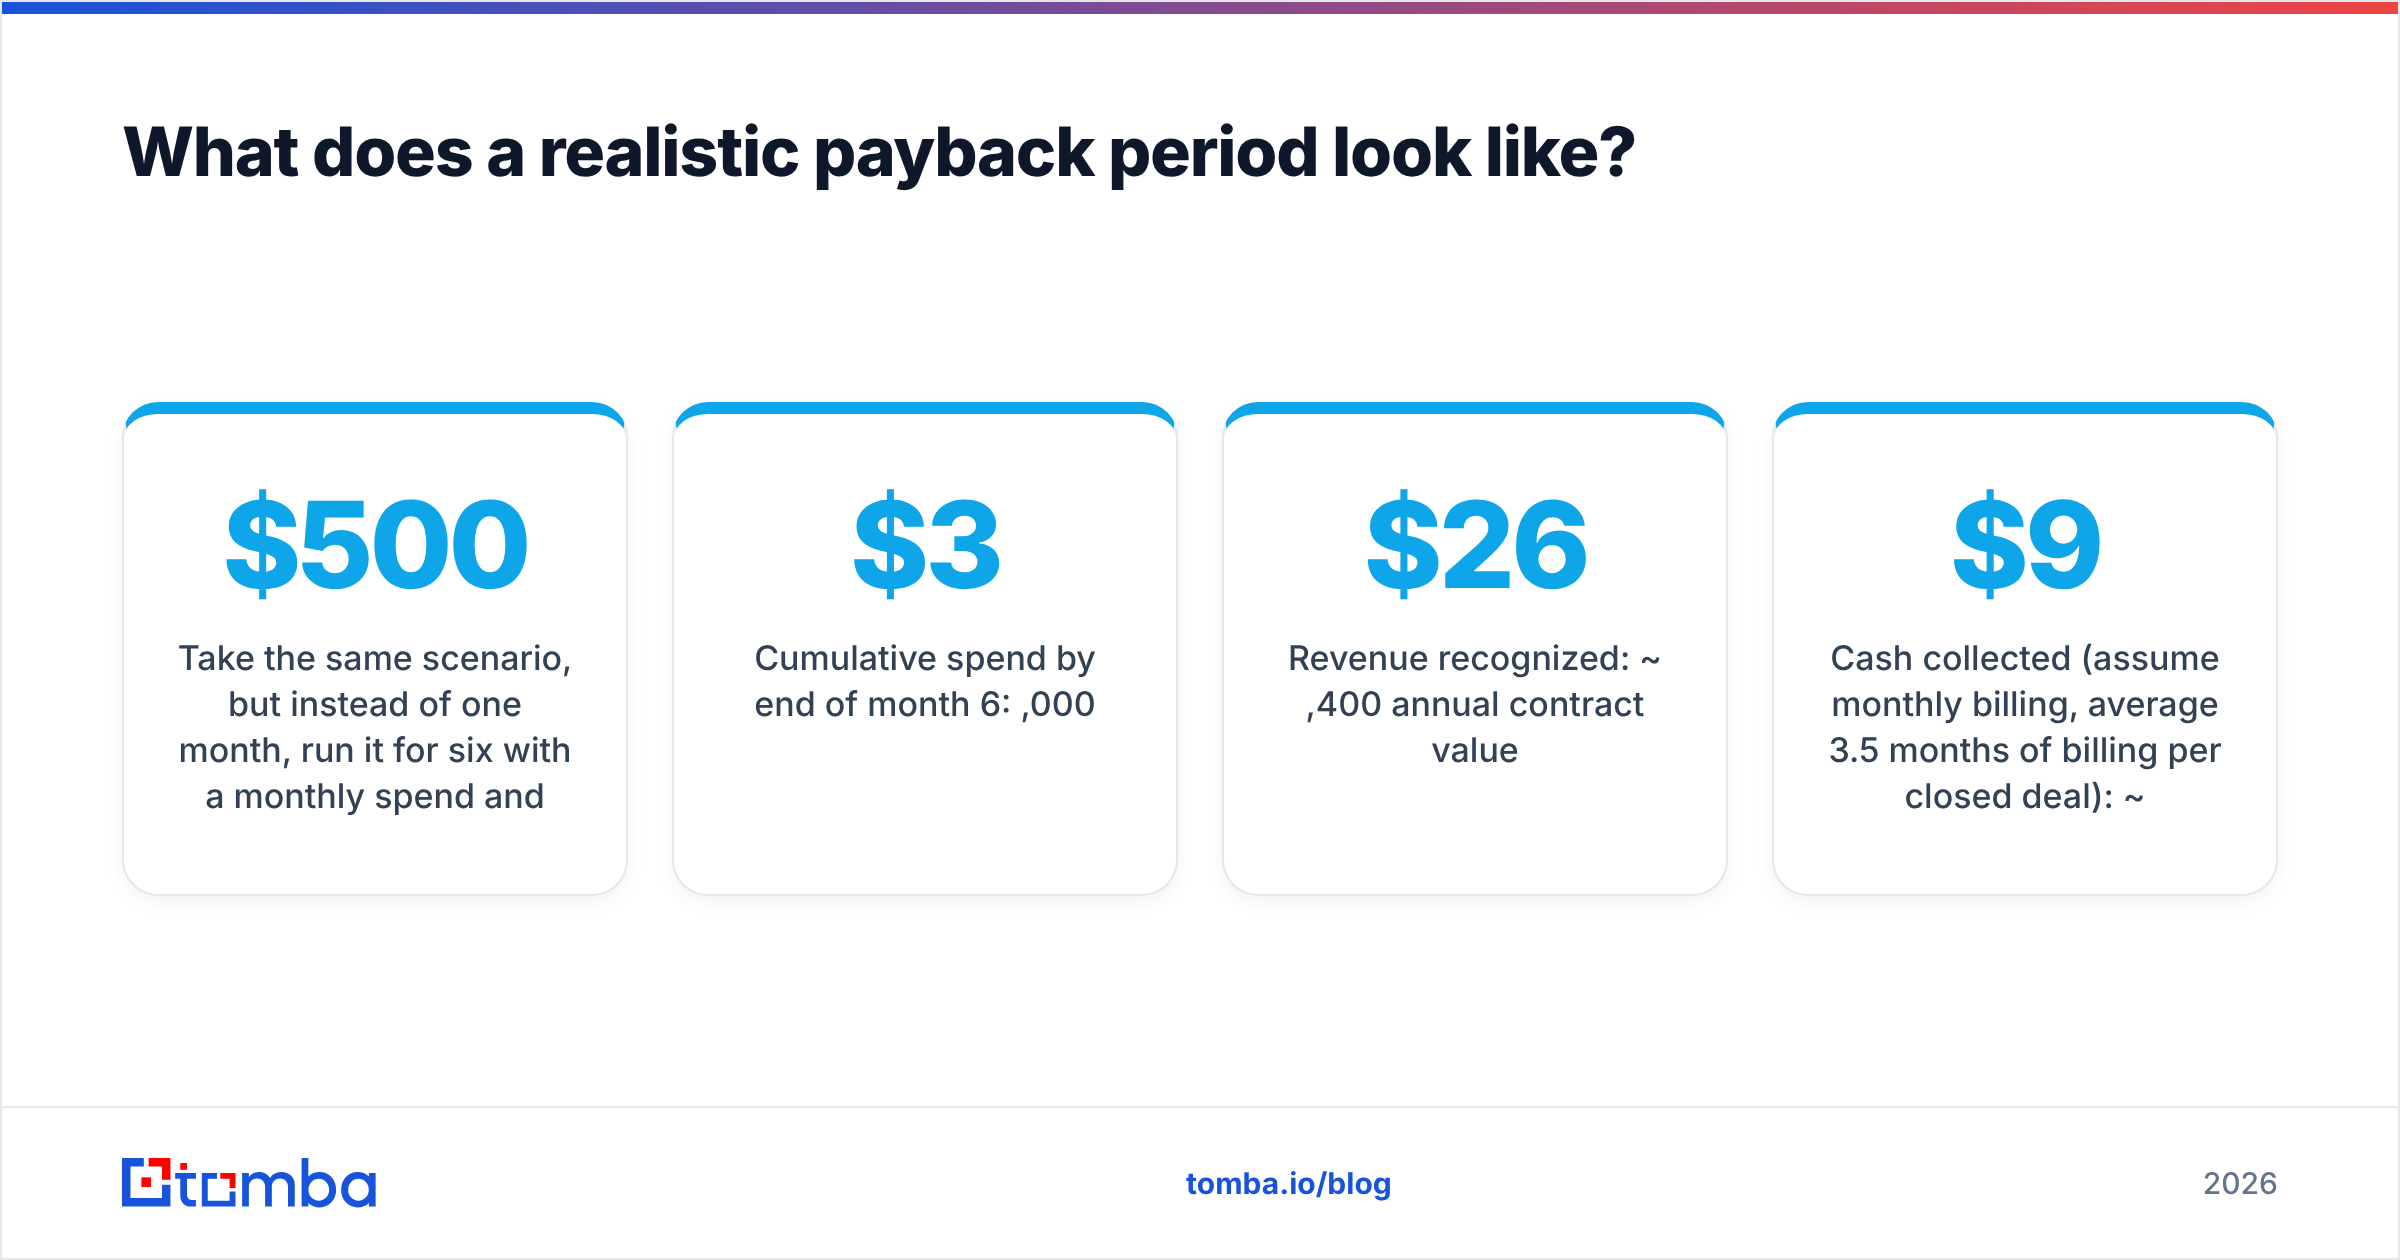
Take the same scenario, but instead of one month, run it for six with a $500 monthly spend and a 45-day average sales cycle.
- Cumulative spend by end of month 6: $3,000
- Deals closed (0.88/mo, first deals landing in month 2 after cycle lag): ~4.4
- Revenue recognized: ~$26,400 annual contract value
- Cash collected (assume monthly billing, average 3.5 months of billing per closed deal): ~$9,240
- Cash-basis payback: roughly month 4
That's the number that determines whether you can scale the channel with cash flow or need to fund it out of a raise. A 9.58x ROI multiple that takes eleven months to convert into cash is a very different business decision than the same multiple in four months. HubSpot's sales resources and most RevOps playbooks now push teams toward payback-period reporting for exactly this reason.
If you have a multi-year contract with annual prepay, payback collapses to month 2 and cold email becomes the cheapest capital in your business. If you sell $49/month self-serve, cold email may never pay back at all — the CAC-to-LTV math simply doesn't clear. Run the model before you hire the SDR.
What are the most common ways this model breaks?#
Double-counting attribution. A prospect gets a cold email, ignores it, then converts through a demo request three weeks later. Both channels claim the deal. If your calculator uses last-touch and your paid team uses first-touch, your combined "ROI" exceeds 100% of actual revenue. Pick one convention and make everyone use it.
Using open rate anywhere. Apple's Mail Privacy Protection pre-fetches images, which means a meaningful share of your "opens" are machines. Any model with open rate in the chain is producing fiction. Reply rate on delivered mail is the first honest signal.
Ignoring inbox capacity as a constraint. Your model says "send 5,000/month." Your infrastructure says three mailboxes at 40 sends/day = ~3,600/month before reputation risk. The calculator should output the number of mailboxes required, not just assume the sends happen. Volume you can't safely send isn't revenue, it's a spam complaint waiting to happen.
Confusing marginal CAC with blended CAC. Covered above, worth repeating. Your CFO already knows the difference. Get there first.
Assuming the levers are independent. They aren't. Better data raises deliverability, which raises reply rate, which raises positive-reply share (because you're reaching the right person, not a catch-all inbox). A one-variable-at-a-time sensitivity table is a starting point, not a forecast. When you tighten your ICP and your data quality together, the compounding is real and the model will understate your results — which is a much more pleasant way to be wrong.
How do you build this in a spreadsheet in 20 minutes?#
Five columns, one row per stage, and one assumptions block.
- Assumptions block. Every rate lives here in its own named cell — bounce, reply, positive-reply, book, show, opp, close, ACV, margin. Nothing hardcoded in the funnel rows.
- Funnel rows. Each row multiplies the row above by one assumption cell. Eight rows, contacts to closed-won.
- Cost block. Data, infrastructure, tooling, human hours × fully-loaded rate. Sum it.
- Outputs block. Revenue, gross profit, ROI multiple, cost per meeting held, marginal CAC, months to cash payback.
- Sensitivity table. A two-way data table with reply rate on one axis and ACV on the other. This one grid answers 80% of the questions your leadership will ask.
Then do the thing almost nobody does: after the campaign ships, go back and overwrite every assumption with the actual observed rate. The calculator's real value isn't the forecast — it's the postmortem. Three cycles of forecast-then-correct and your assumptions block becomes the most valuable document in your GTM stack. Check tool reviews on G2 if you want to sanity-check vendor-claimed rates against what practitioners report; assume vendor benchmarks are the 90th percentile, not the median.
Where should you start?#
Start at the joint that leaks the most and costs the least to fix. For almost every team running outbound today, that is data quality — because it's the only input that silently degrades three downstream metrics at once, and the only one where a $100 spend reliably returns a four-figure swing.
Pull 100 contacts from your current list, run them through a verifier, and see what percentage come back risky or invalid. If it's over 5%, you don't have a copy problem or a targeting problem. You have a list problem wearing a copy problem's clothes.
When you're ready to fix the input side, Tomba Email Finder sources professional email addresses by domain, name, or company, with verification built into the same workflow — so the contacts that enter your sequencer are the contacts your calculator assumed. The free tier gives you 25 searches a month to test the accuracy claim yourself; Starter runs $49/mo and Growth $99/mo, with full Tomba pricing laid out per credit so you can drop the real number straight into your data cost line.
Build the model. Fill it with your own numbers. Then go fix the leakiest joint.
Related guides#
// get started
Find, verify and enrich your first contacts today
Start on the free plan with 25 searches a month, then scale when your team is ready.
Free plan · No credit card required · GDPR & CCPA
// about the author