Cold Email Stats 2026: 40 Benchmarks That Actually Matter
Most cold email stats you see quoted are averages of averages, scraped from vendor blogs that never published their sample. Here's what the numbers actually look like in 2026 — and which ones predict revenue.
TL;DR
- Open rate is no longer a usable cold email stat. Apple Mail Privacy Protection and Gmail image proxying inflate it by 20–40 percentage points depending on your recipient mix, and nobody can tell you exactly how much.
- The three stats that still correlate with pipeline: bounce rate, reply rate, and positive reply rate. Everything else is diagnostic at best.
- Reported cold email reply rates cluster between 1% and 5% for cold, unsegmented lists and 8–15% for tightly targeted lists under 200 contacts. The gap is list quality, not copy.
- Keep bounce rate under 2%. Google and Yahoo's bulk sender rules put spam complaint rate under 0.3%, and there is no grace period.
- Almost every "average cold email statistic" you'll find is a vendor's own customer data, self-reported, with no denominator. Treat published cold email stats as directional ranges, not targets.
What do cold email stats actually measure in 2026?#
Here's the short answer: less than they did five years ago, and the good ones measure recipient behavior, not mailbox rendering.
Think of email metrics like a car dashboard. Open rate used to be your speedometer. Then somebody replaced the speedometer with a needle that jumps to 70 mph whenever the car's shadow crosses a sensor — regardless of whether you're moving. That's what Apple Mail Privacy Protection did in 2021 and what Gmail's image proxy has always partially done. The needle still moves. It just doesn't mean anything.
What's left is a smaller, harder set of numbers:
- Bounce rate — the percentage of sends that never reached a mailbox. This is a data-quality stat, not a copy stat. It's the only metric on this list you can fix before you hit send.
- Reply rate — humans typing words back. Impossible to fake, impossible to inflate with a tracking pixel. This is the closest thing cold email has to a north star.
- Positive reply rate — replies that express interest, as a share of total sends. The stat your CFO cares about, and the one most teams never separate from #2.
- Spam complaint rate — the percentage of recipients who hit "report spam." Google and Yahoo enforce a hard ceiling here for bulk senders.
- Meetings booked per 1,000 sends — the only stat that ties directly to revenue. Everything above is an input to this.
- Domain health signals — authentication pass rate, blocklist status, sending IP reputation. Not a marketing metric; an infrastructure one.
Notice what's missing: open rate, click rate, and "engagement score." Click rate still has narrow diagnostic value if you're sending links and want to know whether a specific asset lands. Open rate has none.
Why did open rate stop being a real cold email stat?#
Because a machine opens your email before the human does.
Apple Mail Privacy Protection, enabled by default on the Apple Mail app since iOS 15, pre-fetches remote images — including your tracking pixel — through a proxy server. The recipient may never look at the message. Your dashboard says they opened it. Gmail has proxied images through googleusercontent.com since 2013, which breaks geolocation and device data even when it doesn't fully fake the open event.
The practical effect: if 45% of your list reads mail in Apple Mail (roughly the share of the mobile email client market Apple has held for years, per industry client-share tracking), your reported open rate is inflated by a number you cannot compute. You can't even measure the inflation, because you don't know your list's client mix.
Teams that still optimize subject lines against open rate are A/B testing a random number generator.

The workaround most serious senders adopted: strip the tracking pixel entirely. Removing it improves deliverability slightly (remote images are a mild spam signal on cold mail), and forces the team to optimize against reply rate — which was always the better target anyway.
What are the real cold email benchmark numbers?#
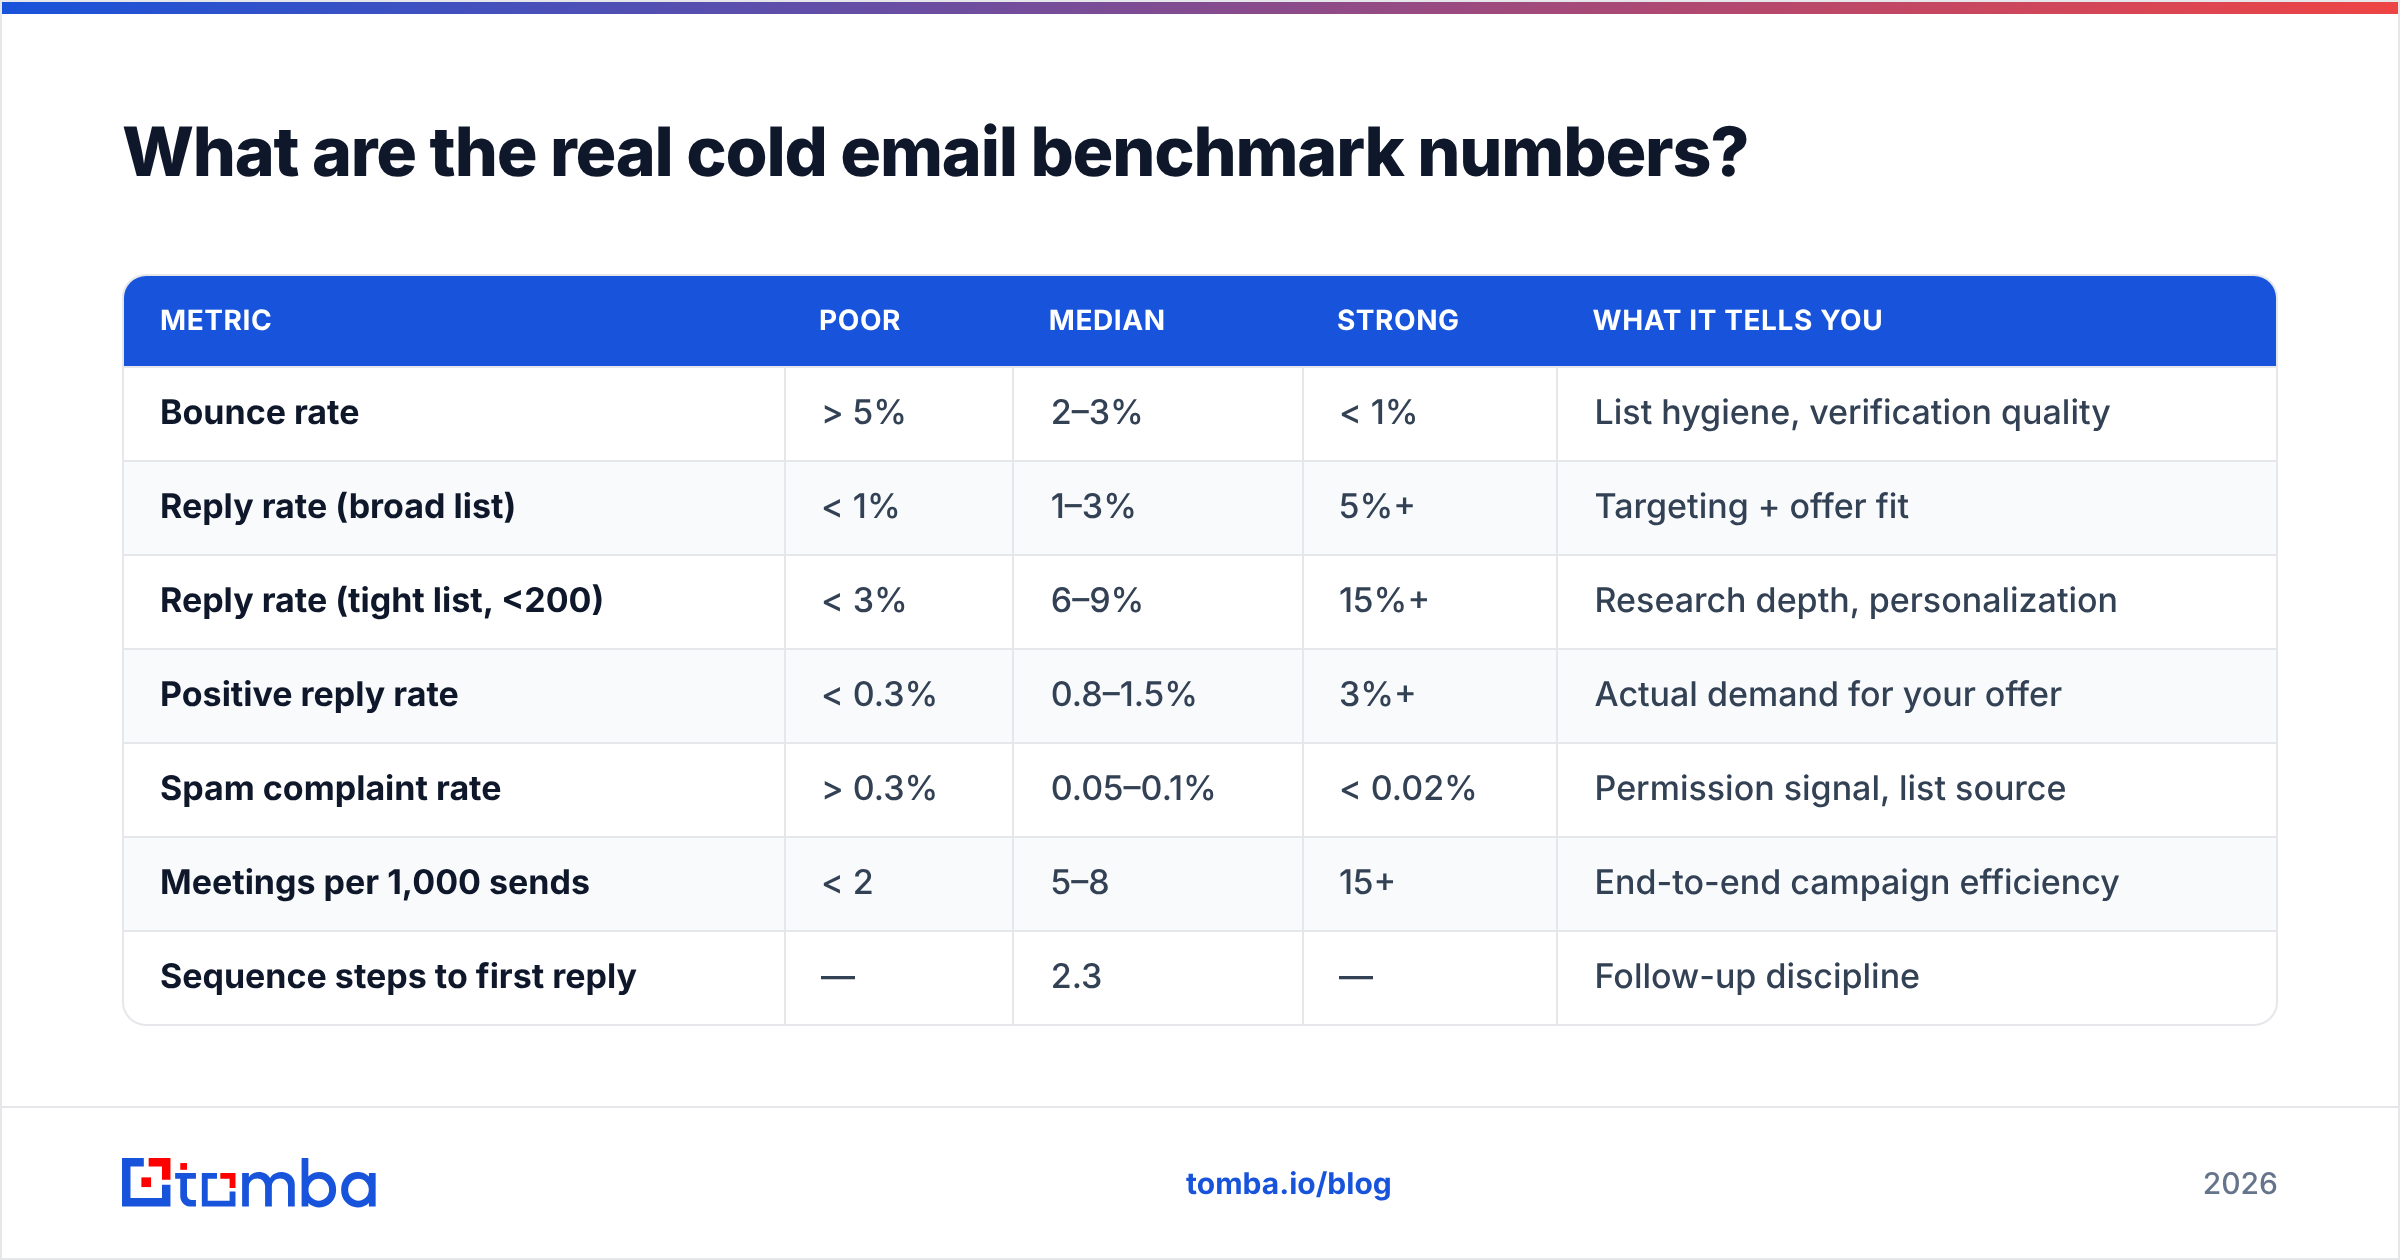
Below are the ranges most commonly reported across vendor benchmark studies and public sales-statistics roundups. Read them as distributions, not targets. A 3% reply rate on a 10,000-contact blast and a 3% reply rate on a 100-contact ABM list are completely different businesses.
| Metric | Poor | Median | Strong | What it tells you |
|---|---|---|---|---|
| Bounce rate | > 5% | 2–3% | < 1% | List hygiene, verification quality |
| Reply rate (broad list) | < 1% | 1–3% | 5%+ | Targeting + offer fit |
| Reply rate (tight list, <200) | < 3% | 6–9% | 15%+ | Research depth, personalization |
| Positive reply rate | < 0.3% | 0.8–1.5% | 3%+ | Actual demand for your offer |
| Spam complaint rate | > 0.3% | 0.05–0.1% | < 0.02% | Permission signal, list source |
| Meetings per 1,000 sends | < 2 | 5–8 | 15+ | End-to-end campaign efficiency |
| Sequence steps to first reply | — | 2.3 | — | Follow-up discipline |
| Deliverability (inbox placement) | < 80% | 85–92% | 95%+ | Domain + authentication health |
Two caveats you should hold onto.
First, the denominator problem. When a sending platform publishes "our users see an average 8.5% reply rate," that average is drawn from campaigns that ran on their platform — which excludes every campaign that got the account suspended, every domain that got blocklisted, and every list that bounced so hard the user quit. Survivorship bias is baked into every published cold email stat, including the ones above. The true population average is lower.
Second, medians beat averages. Cold email outcomes are power-law distributed. A handful of hyper-targeted campaigns pull the mean far above what a typical campaign achieves. When a stat is quoted as an "average," ask whether it's a mean or a median. It's almost always a mean, and it's almost always misleading.
How much does list quality actually move the numbers?#
More than copy. More than send time. More than subject line, sequence length, or the AI personalization tool you just bought.
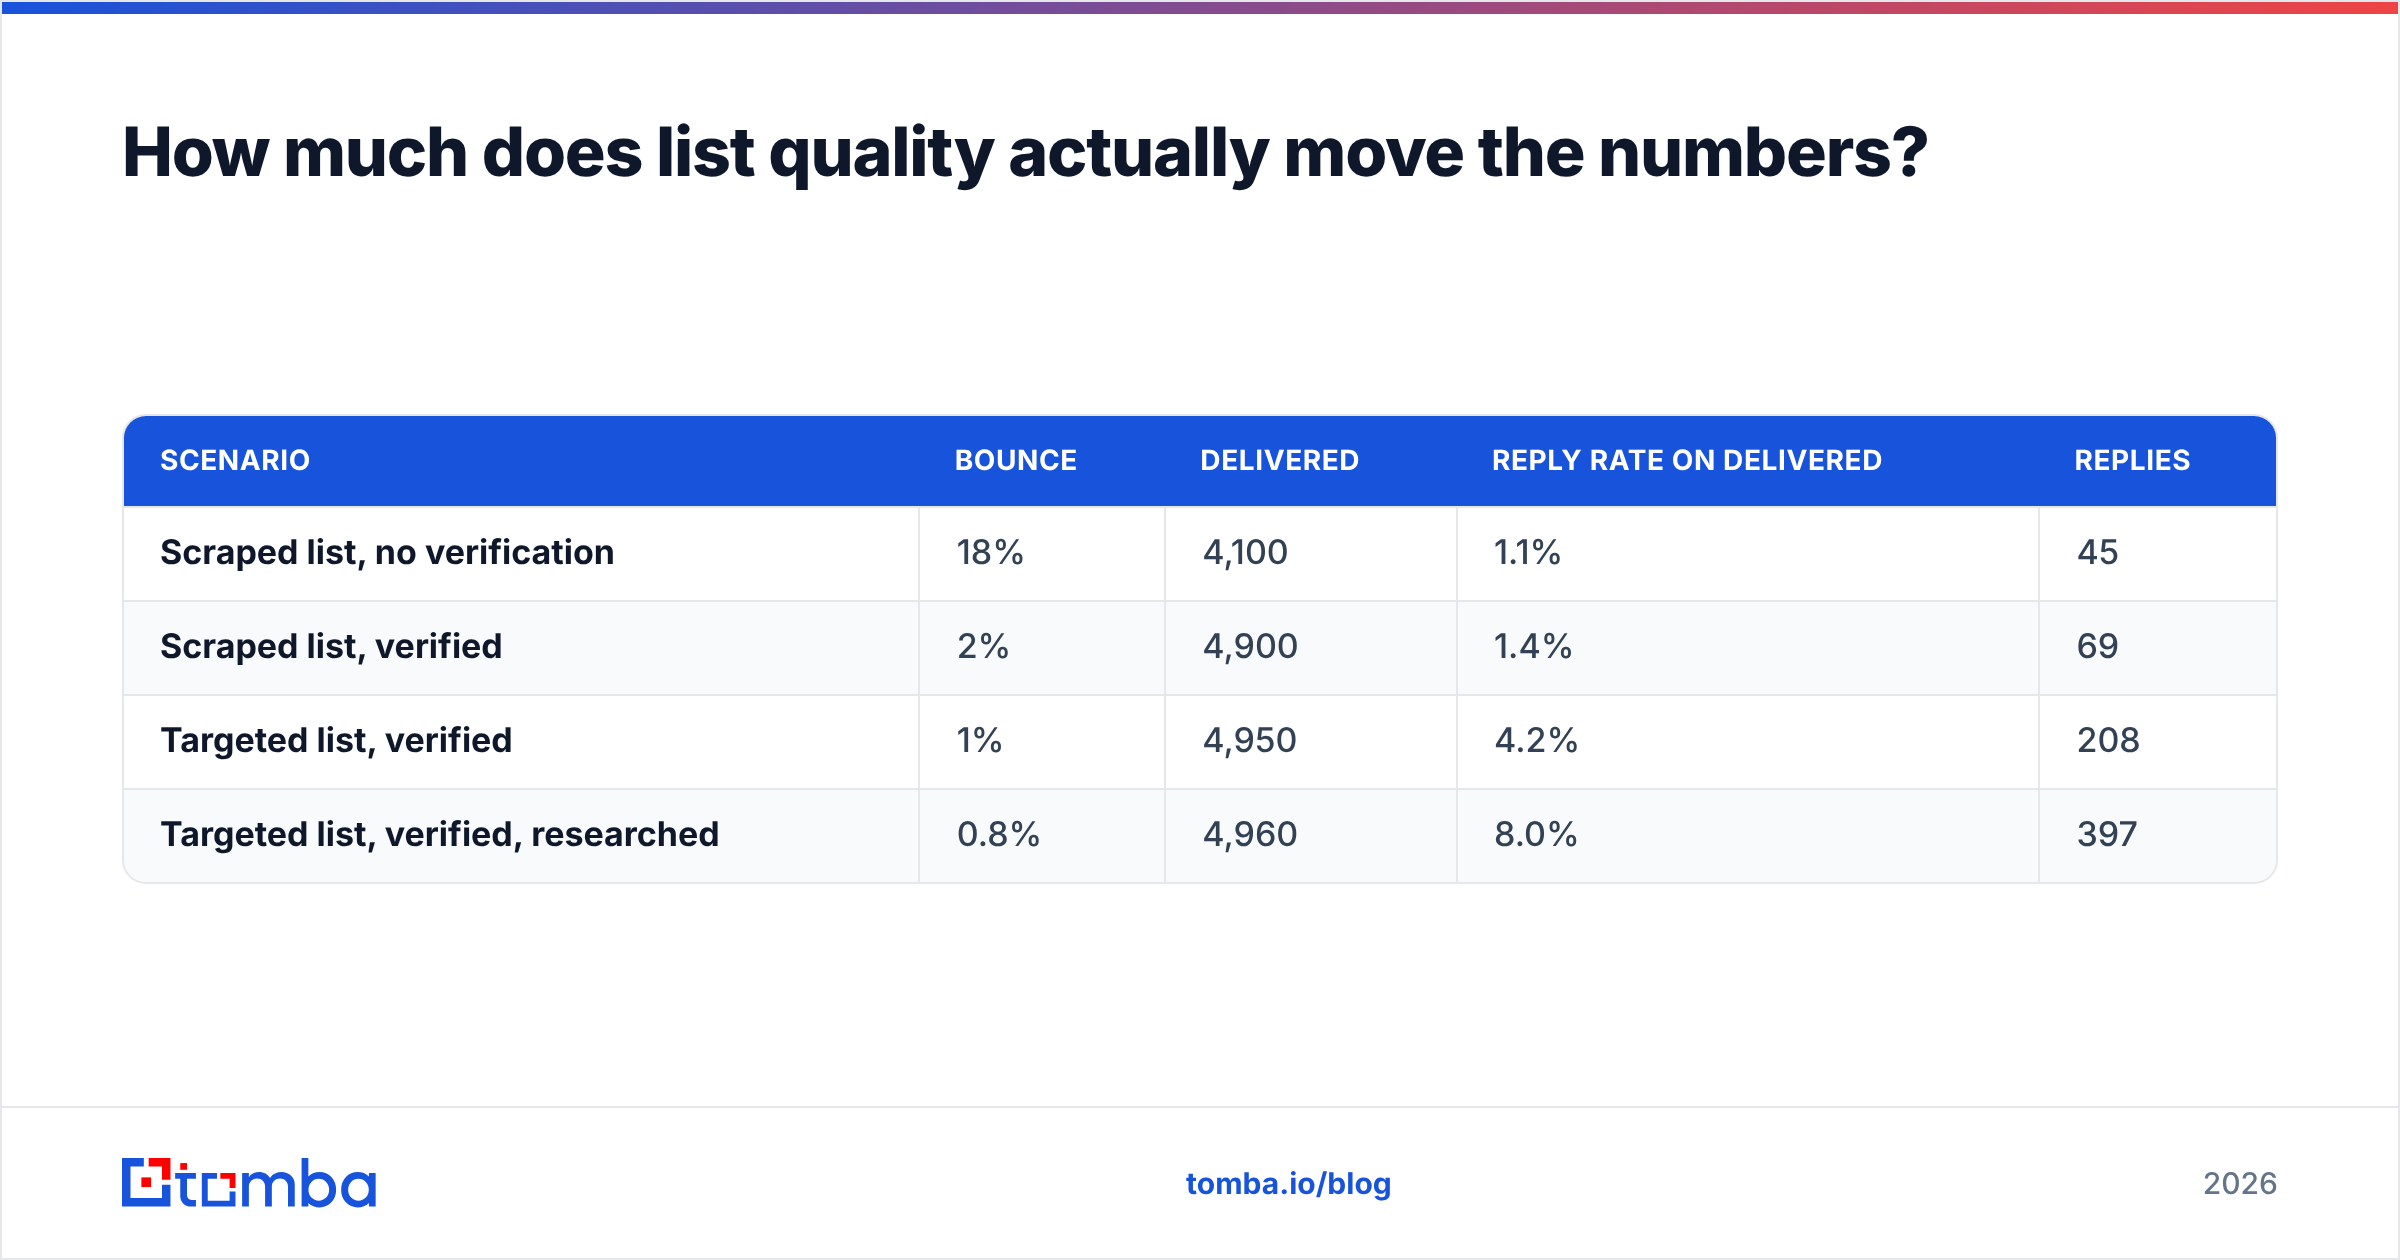
Here's the arithmetic that most teams never do. Say you send 5,000 emails.
| Scenario | Bounce | Delivered | Reply rate on delivered | Replies |
|---|---|---|---|---|
| Scraped list, no verification | 18% | 4,100 | 1.1% | 45 |
| Scraped list, verified | 2% | 4,900 | 1.4% | 69 |
| Targeted list, verified | 1% | 4,950 | 4.2% | 208 |
| Targeted list, verified, researched | 0.8% | 4,960 | 8.0% | 397 |
The jump from row 1 to row 2 is a tooling decision — run the list through an email verifier before you send. It costs pennies per contact and roughly doubles your reply count without changing a single word of copy.
The jump from row 2 to row 3 is a targeting decision, and it's worth 3x more than the tooling decision. The jump from row 3 to row 4 is labor.
That's the whole game. Most teams spend 90% of their optimization energy on copy, which lives in the second decimal place of the reply-rate column, and 10% on the list, which lives in the first.
The bounce column deserves special attention. High bounce rates don't just waste sends — they teach mailbox providers that you're a spammer. A 18% bounce campaign will damage your sender reputation for weeks, dragging down every subsequent campaign from the same domain. The cost of an unverified list isn't the 900 wasted sends. It's the next three campaigns.
Which cold email stats predict domain damage?#
These are the numbers that get your domain blocklisted, in rough order of how fast they'll do it.
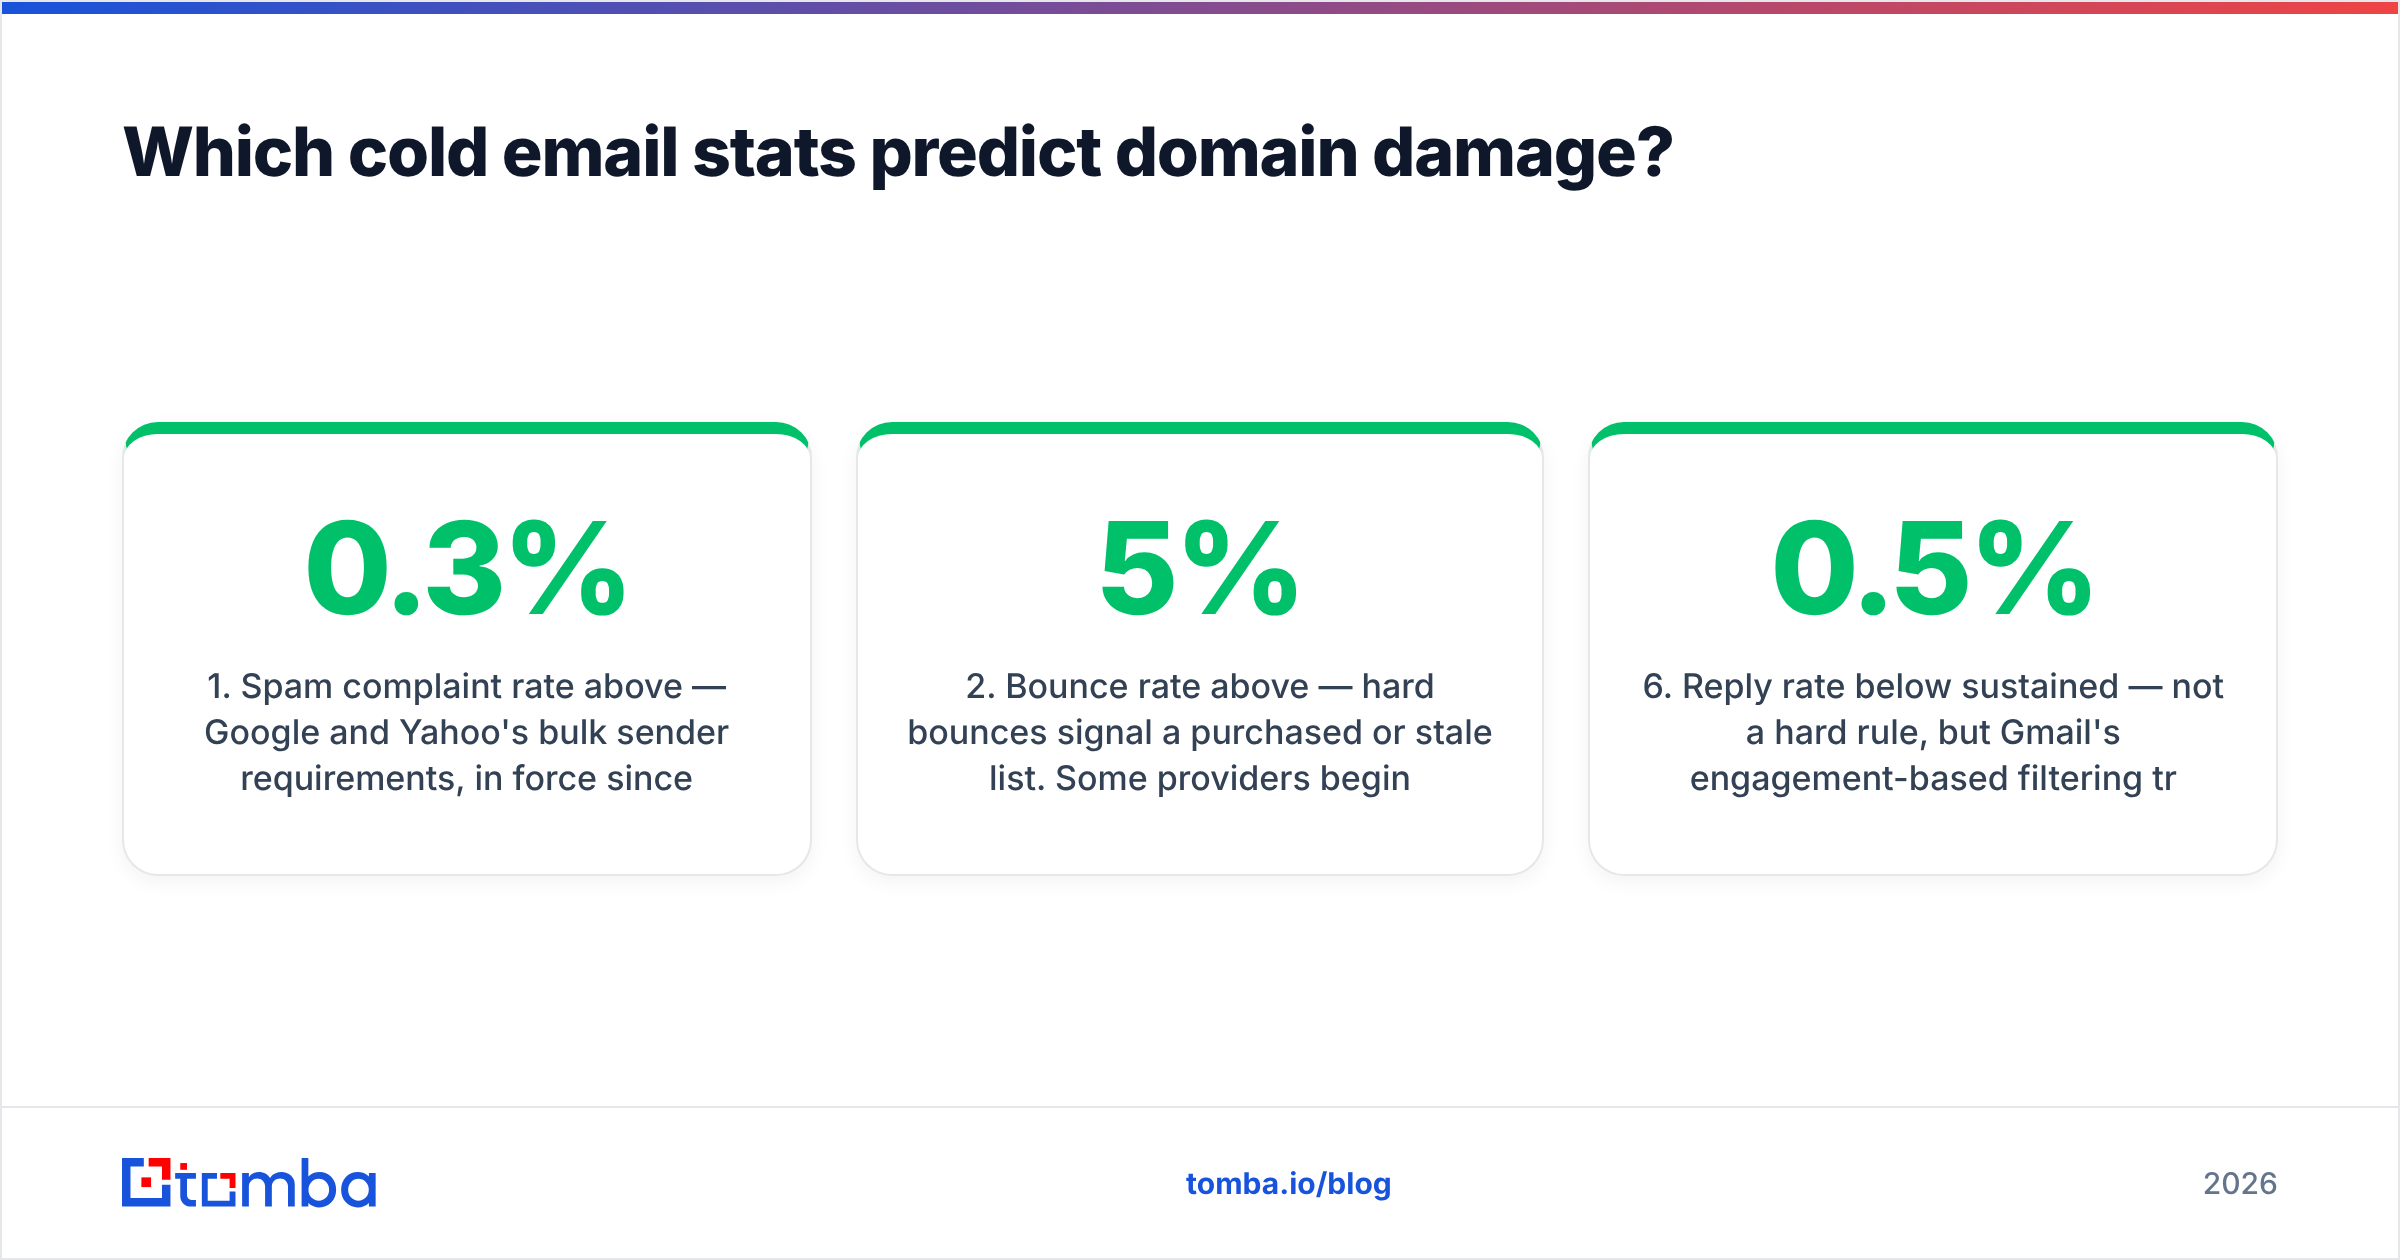
- Spam complaint rate above 0.3% — Google and Yahoo's bulk sender requirements, in force since February 2024, set this as a hard ceiling for senders above 5,000 messages/day to their users. Above 0.3%, filtering begins immediately. Above 0.1%, you're in the danger zone and should slow down.
- Bounce rate above 5% — hard bounces signal a purchased or stale list. Some providers begin throttling at 3%.
- Spam trap hits, any number above zero — recycled traps (abandoned addresses that once belonged to real people) are what unverified lists collect. A single pristine trap hit can blocklist a domain outright.
- Authentication failures — SPF, DKIM, and DMARC must all pass. Since 2024, bulk senders must publish a DMARC record. A
p=nonepolicy passes the requirement but tells you nothing; check your aggregate reports. - Volume ramp above ~30–50 sends/day on a new domain — a domain with no sending history that suddenly emits 500 messages looks exactly like a compromised account. Ramp over 4–8 weeks; a warmup calculator will give you a schedule.
- Reply rate below 0.5% sustained — not a hard rule, but Gmail's engagement-based filtering treats a domain nobody ever replies to as low-value. Low reply rate is both a symptom and, eventually, a cause.
Items 1 through 3 are all downstream of list quality. Item 4 is a one-time DNS configuration. Item 5 is patience. Only item 6 is about your writing.

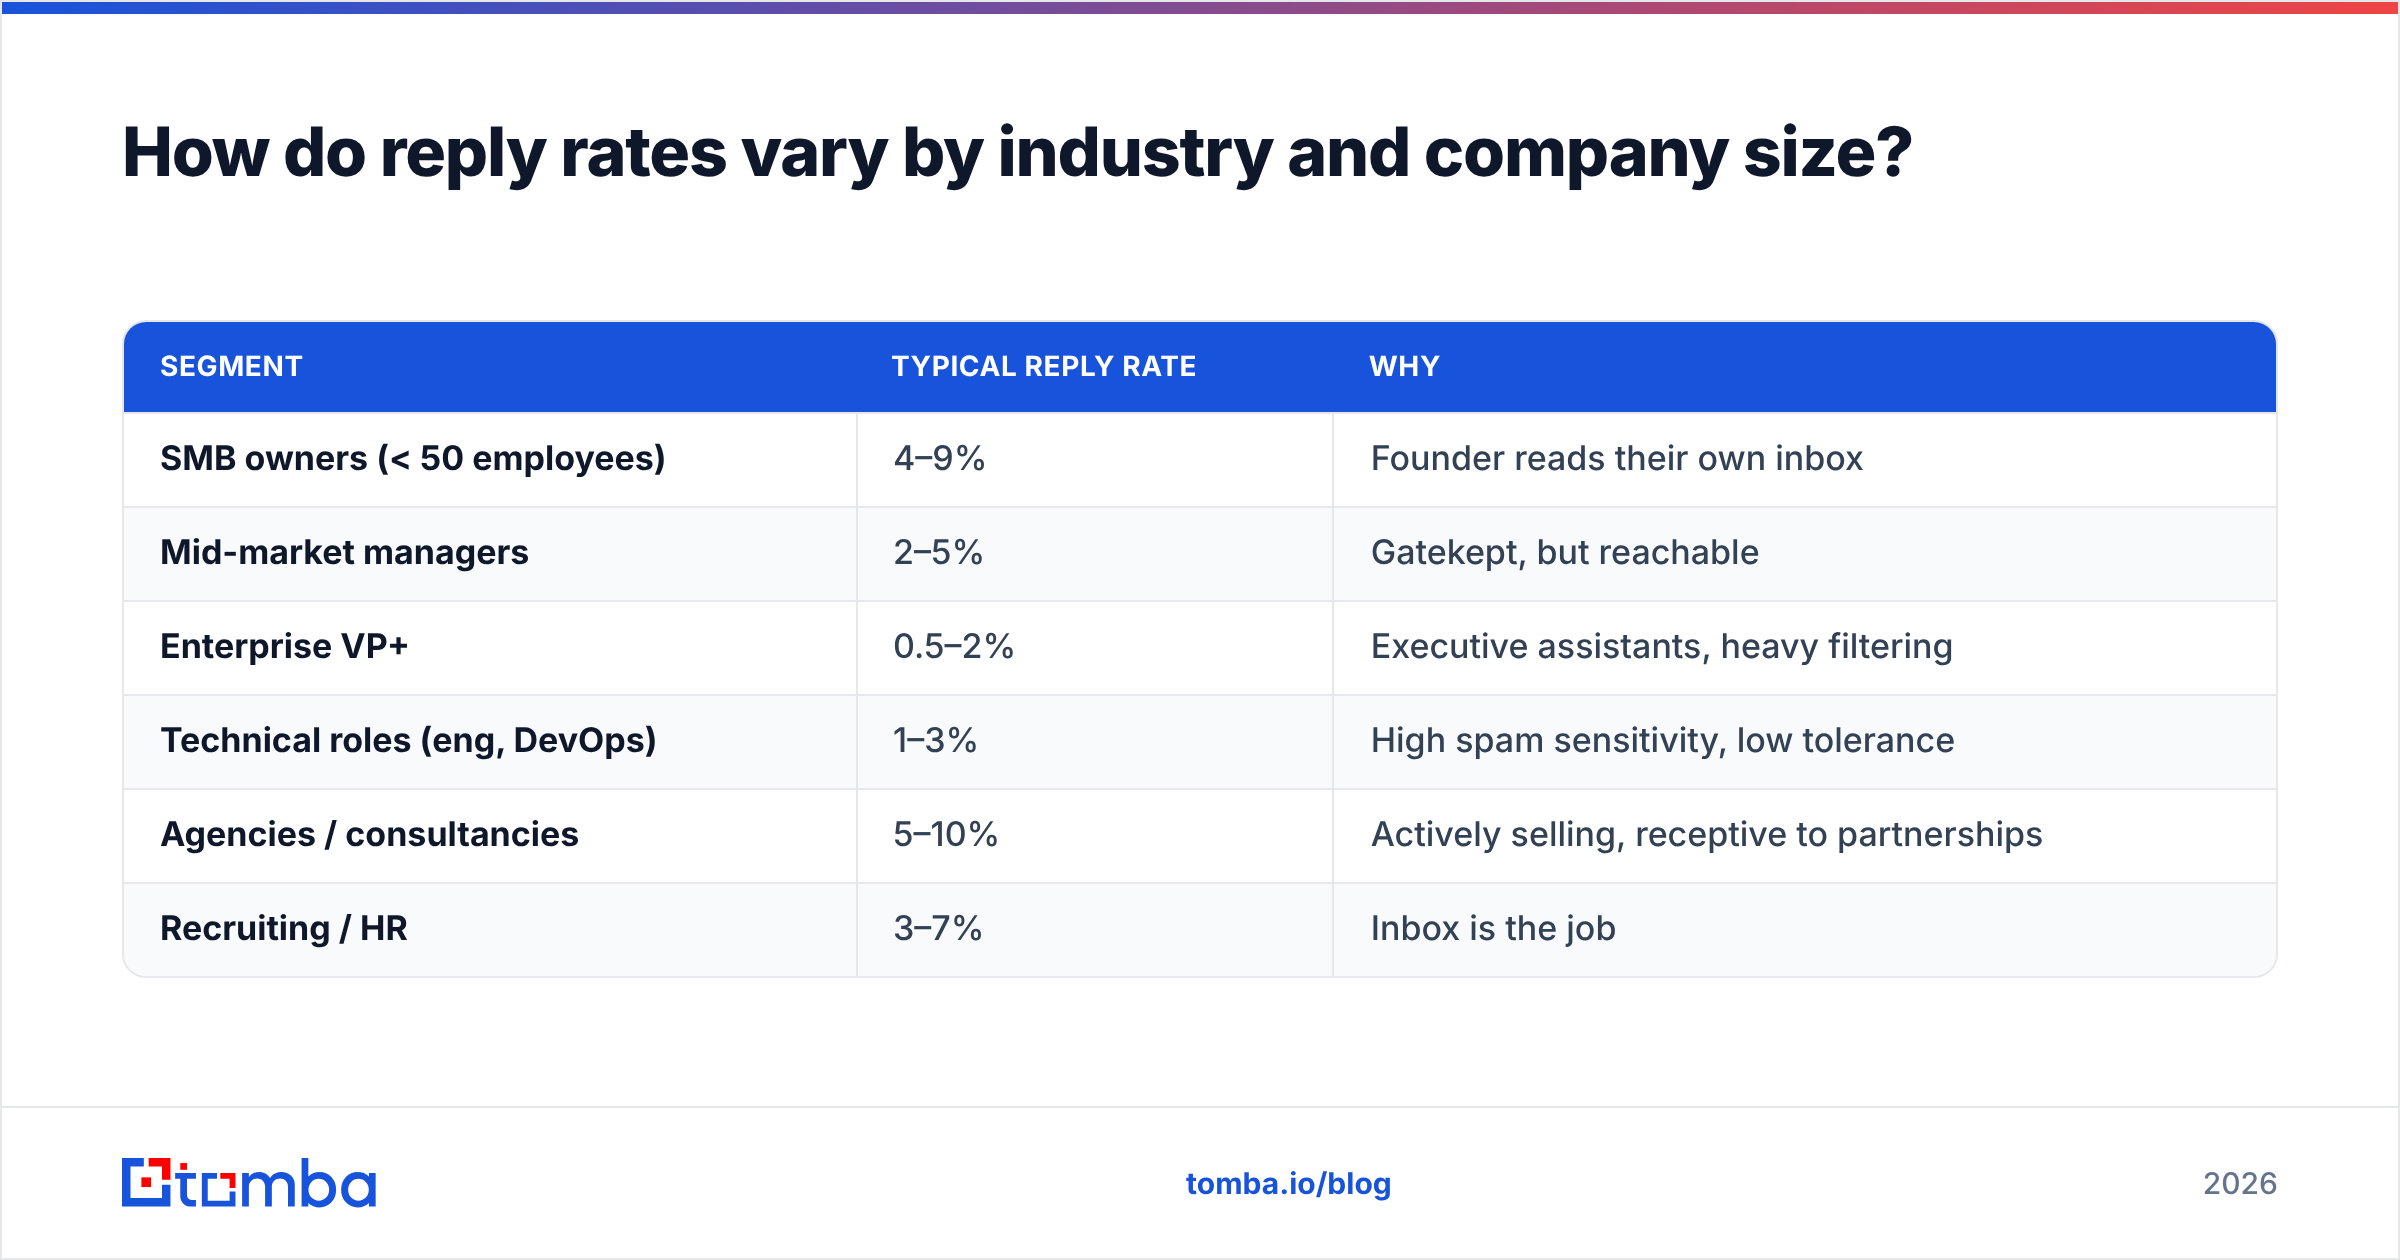
How do reply rates vary by industry and company size?#
Directionally — and I want to be clear these are ranges from self-reported vendor studies, not controlled experiments:
| Segment | Typical reply rate | Why |
|---|---|---|
| SMB owners (< 50 employees) | 4–9% | Founder reads their own inbox |
| Mid-market managers | 2–5% | Gatekept, but reachable |
| Enterprise VP+ | 0.5–2% | Executive assistants, heavy filtering |
| Technical roles (eng, DevOps) | 1–3% | High spam sensitivity, low tolerance |
| Agencies / consultancies | 5–10% | Actively selling, receptive to partnerships |
| Recruiting / HR | 3–7% | Inbox is the job |
The pattern: reply rate falls as you move up the org chart and as the recipient's inbox volume rises. A 1.5% reply rate on enterprise VPs may be a better-performing campaign than a 6% reply rate on SMB founders, because one meeting is worth 40x the other. Never benchmark your reply rate against a stat drawn from a different segment.
This is also why "average cold email reply rate" as a single number is nearly meaningless. Ask what segment. Ask what list size. Ask whether replies include auto-responders and "unsubscribe me" — many published figures do.
How do you instrument these stats without a RevOps team?#
Four things, in order.
Separate reply types at ingest. Your sequencer probably has one "replied" bucket. Split it into positive / neutral / negative / auto-reply before the data reaches your dashboard. Most tools let you tag this manually; do it for 200 replies and you'll have a stable positive-reply ratio you can apply going forward.
Track bounces by source. Tag every contact with where it came from — scraped, purchased, enriched via API, referred. Then compute bounce rate per source, monthly. You'll usually find one source is responsible for most of the damage. Providers vary widely here; BookYourData and similar verified-at-purchase databases tend to bounce far lower than generic scrapes, and it's worth knowing which of your sources is which.
Compute meetings per 1,000 sends, weekly. This is the only number worth putting on a wall. It absorbs every upstream metric — if the list is bad, if the copy is bad, if deliverability is bad, this number falls. It's slow-moving and honest.
Verify before you send, not after you bounce. Bounce rate is the only metric on this list you can know in advance. Running a list through bulk verification turns bounce rate from a post-mortem stat into a pre-flight check.
If you compare tooling here, the email verification category on G2 is a reasonable starting point — the accuracy claims are all self-reported, but the review volume tells you which vendors have real customers.
What benchmarks should you set for your first 90 days?#
Don't copy the "strong" column from the table above. Set floors, not targets.
- Days 1–30: bounce rate < 2%. Complaint rate < 0.1%. Reply rate: don't measure it yet, your sample is too small. Send volume: whatever your warmup schedule says.
- Days 31–60: reply rate ≥ 2% on any list you've segmented. If you're below 1%, the problem is targeting, not copy. Change the list before you change the email.
- Days 61–90: positive reply rate ≥ 0.8%. Meetings per 1,000 sends ≥ 4. Now, and only now, start A/B testing copy — you have enough volume for the test to mean anything.
A cold email test needs roughly 400–500 sends per variant before the difference between a 2.0% and a 2.8% response rate rises above noise. Most teams call a winner at 80 sends. That's not testing; that's reading tea leaves.
The one stat that fixes the other seven#
Every metric in this post traces back to whether the address you sent to belongs to a real person who actually works at the company you think they work at. Bounce rate, complaint rate, spam trap hits, reply rate, deliverability, sender reputation — all of them degrade from the same root cause, and all of them improve when you fix it.
You cannot copywrite your way out of a bad list. You can, however, buy your way out of one for less than the cost of a single wasted campaign.
Tomba's Email Finder resolves verified business addresses by name and domain, with SMTP-level checks before the address ever reaches your sequencer. The free tier covers 25 searches a month if you want to spot-check your existing list first; paid plans start at $49/mo. See Tomba pricing for the full breakdown. Run your next list through it, then compare your bounce rate to the one you got last quarter. That delta is the only cold email stat that will ever matter to you.
Related guides#
Ready to find emails that actually work?
Join 150,000+ professionals who stopped guessing and started sending. Free credits on signup — no credit card required.
Get the Tomba newsletter
Practical outbound tactics and product updates — once every two weeks.
About the author