Common Sales Metrics in 2026: The KPIs That Actually Matter
A no-fluff breakdown of the common sales metrics that actually predict revenue — the formulas, the benchmarks, and the KPIs most teams track wrong.
Most sales teams track dozens of numbers and steer by almost none of them. You open a dashboard, see twelve widgets, and still can't answer the only question that matters: are we going to hit the number this quarter? The problem isn't a lack of data. It's that the common sales metrics everyone reports on are rarely the ones that actually move a forecast.
This guide cuts the list down to the metrics that predict revenue, shows you how to calculate each one, and flags the vanity numbers that feel productive but tell you nothing.
TL;DR#
- Track outcomes and leading indicators together — win rate and quota attainment tell you what happened; pipeline coverage and activity metrics tell you what's coming.
- Win rate, sales cycle length, average deal size, and pipeline coverage are the four metrics every rep and manager should know cold.
- CAC, LTV, and LTV:CAC ratio are the RevOps metrics that decide whether growth is actually profitable.
- Vanity metrics (raw email volume, total activities, dials with no context) feel busy but don't forecast anything.
- Bad data poisons every metric downstream — a pipeline built on unverified contacts inflates coverage and wrecks conversion math.
What are sales metrics, and why do they matter?#
Sales metrics are the quantified measurements of your team's activity, efficiency, and results. Think of them like the gauges on a car dashboard: speed, fuel, and engine temperature each tell you something different, and you'd never drive a long trip watching only one. A revenue number alone is the speedometer — useful, but it tells you where you are, not whether you'll run out of gas before the next exit.
The reason this matters is simple: what you measure is what you manage. If you only report closed revenue, you find out you missed the number after it's too late to fix. Leading indicators — pipeline created, activity volume, conversion between stages — give you weeks or months of warning. Good metrics turn selling from a lagging report into a steerable process. That's the whole point of a healthy sales process and pipeline: every stage produces a number you can act on before the quarter closes.

Which common sales metrics should every team track?#
There's no shortage of things you can measure. The trick is knowing which handful actually earn a spot on the dashboard. Here are the core common sales metrics, grouped by what they tell you.
- Win rate — the percentage of qualified opportunities that close won. The single clearest measure of sales effectiveness. Formula:
deals won ÷ total qualified deals. - Sales cycle length — the average days from first qualified contact to closed deal. Shorter cycles mean faster cash and more shots on goal per rep.
- Average deal size (ACV/ASP) — total revenue divided by number of deals. Tells you whether you're moving upmarket or getting stuck in small logos.
- Pipeline coverage — open pipeline value divided by quota. The forward-looking gauge: 3x-4x coverage is the common rule of thumb for hitting target.
- Quota attainment — percentage of reps hitting quota, and by how much. The health check on whether targets are realistic and enablement is working.
- Conversion rate by stage — how many deals move from each stage to the next. Exposes exactly where deals die.
If you only had room for four gauges, use win rate, sales cycle length, pipeline coverage, and conversion by stage. Together they answer "how good are we, how fast are we, do we have enough, and where are we leaking?"
How do you calculate the most important sales metrics?#
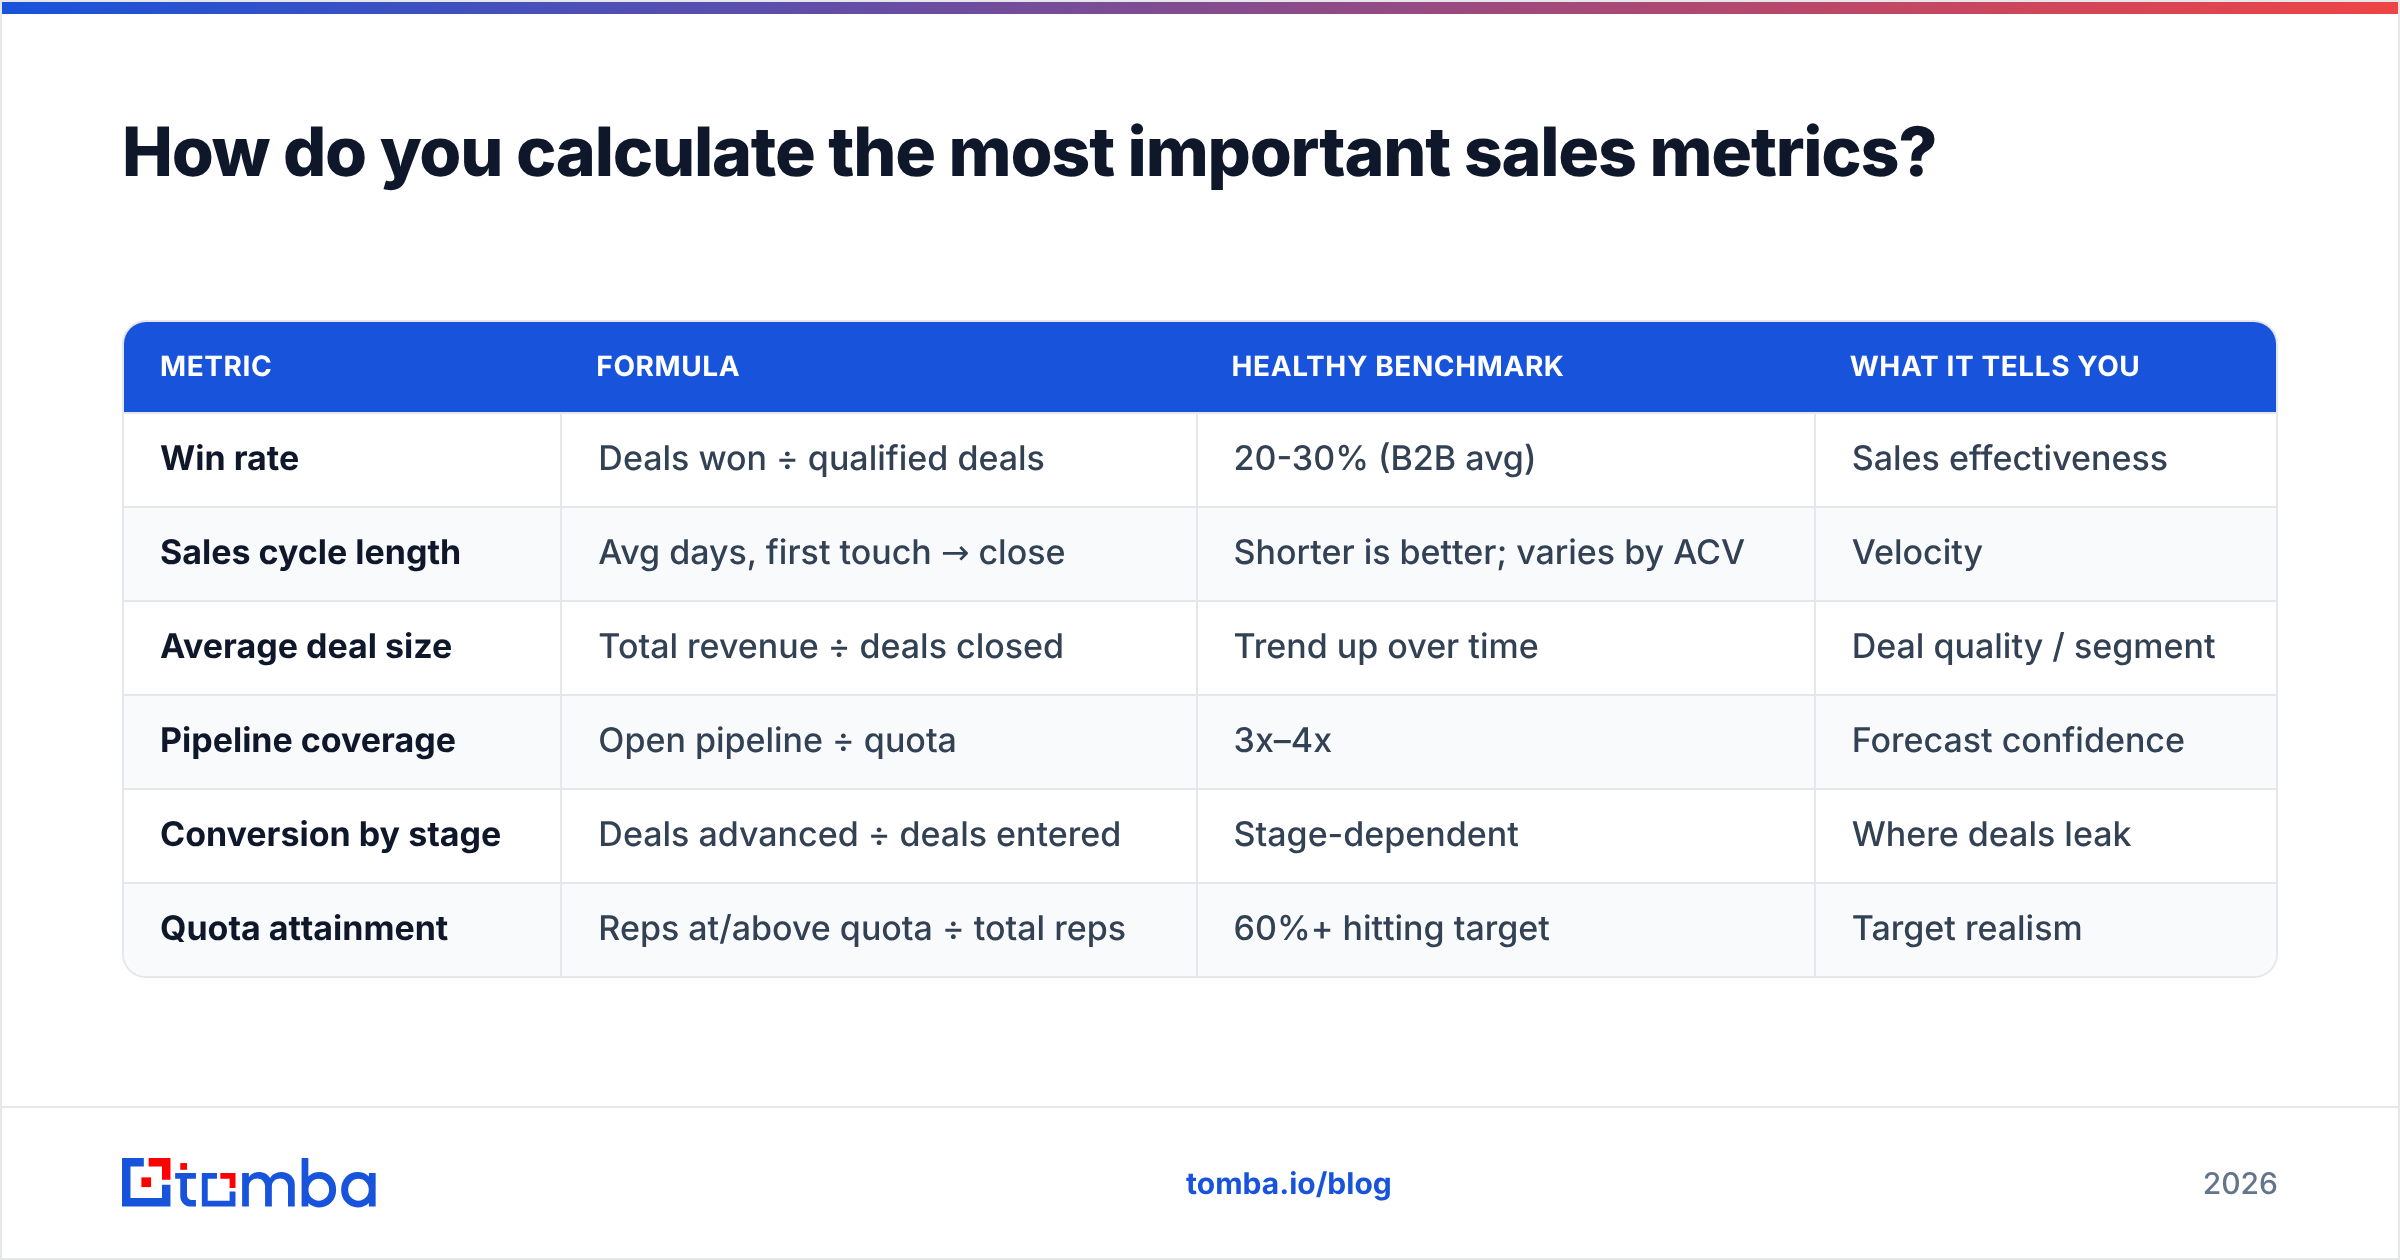
Formulas matter because a metric everyone defines differently is a metric no one can trust. Here's the reference table.
| Metric | Formula | Healthy benchmark | What it tells you |
|---|---|---|---|
| Win rate | Deals won ÷ qualified deals | 20-30% (B2B avg) | Sales effectiveness |
| Sales cycle length | Avg days, first touch → close | Shorter is better; varies by ACV | Velocity |
| Average deal size | Total revenue ÷ deals closed | Trend up over time | Deal quality / segment |
| Pipeline coverage | Open pipeline ÷ quota | 3x–4x | Forecast confidence |
| Conversion by stage | Deals advanced ÷ deals entered | Stage-dependent | Where deals leak |
| Quota attainment | Reps at/above quota ÷ total reps | 60%+ hitting target | Target realism |
A word on benchmarks: treat them as guardrails, not gospel. A 90-day enterprise cycle and a 7-day SMB cycle are both "healthy" in their own context. The number that matters is your trend line — is win rate climbing quarter over quarter, or quietly sliding? Industry research from firms like Gartner and peer benchmarks on G2 are useful reference points, but your own historical data is the truest comparison.
What's the difference between leading and lagging sales metrics?#
Lagging metrics report the past; leading metrics predict the future — and you need both.
Lagging indicators are outcomes: closed revenue, win rate, quota attainment. They're accurate and undebatable, but by the time they move, the quarter is already decided. You can't coach a number that's already in the books.
Leading indicators are inputs and mid-funnel signals: number of qualified meetings booked, pipeline created this week, emails sent to verified contacts, opportunities advanced past stage two. They're noisier, but they're the only metrics you can still influence. If pipeline creation drops in week three, you have time to fix it before it becomes a revenue miss in week twelve.
The mistake most teams make is over-indexing on lagging metrics because they're clean and easy to report. A good sales management rhythm weights leading indicators heavily in weekly reviews and saves lagging metrics for the quarterly retrospective.
Which sales metrics are just vanity numbers?#
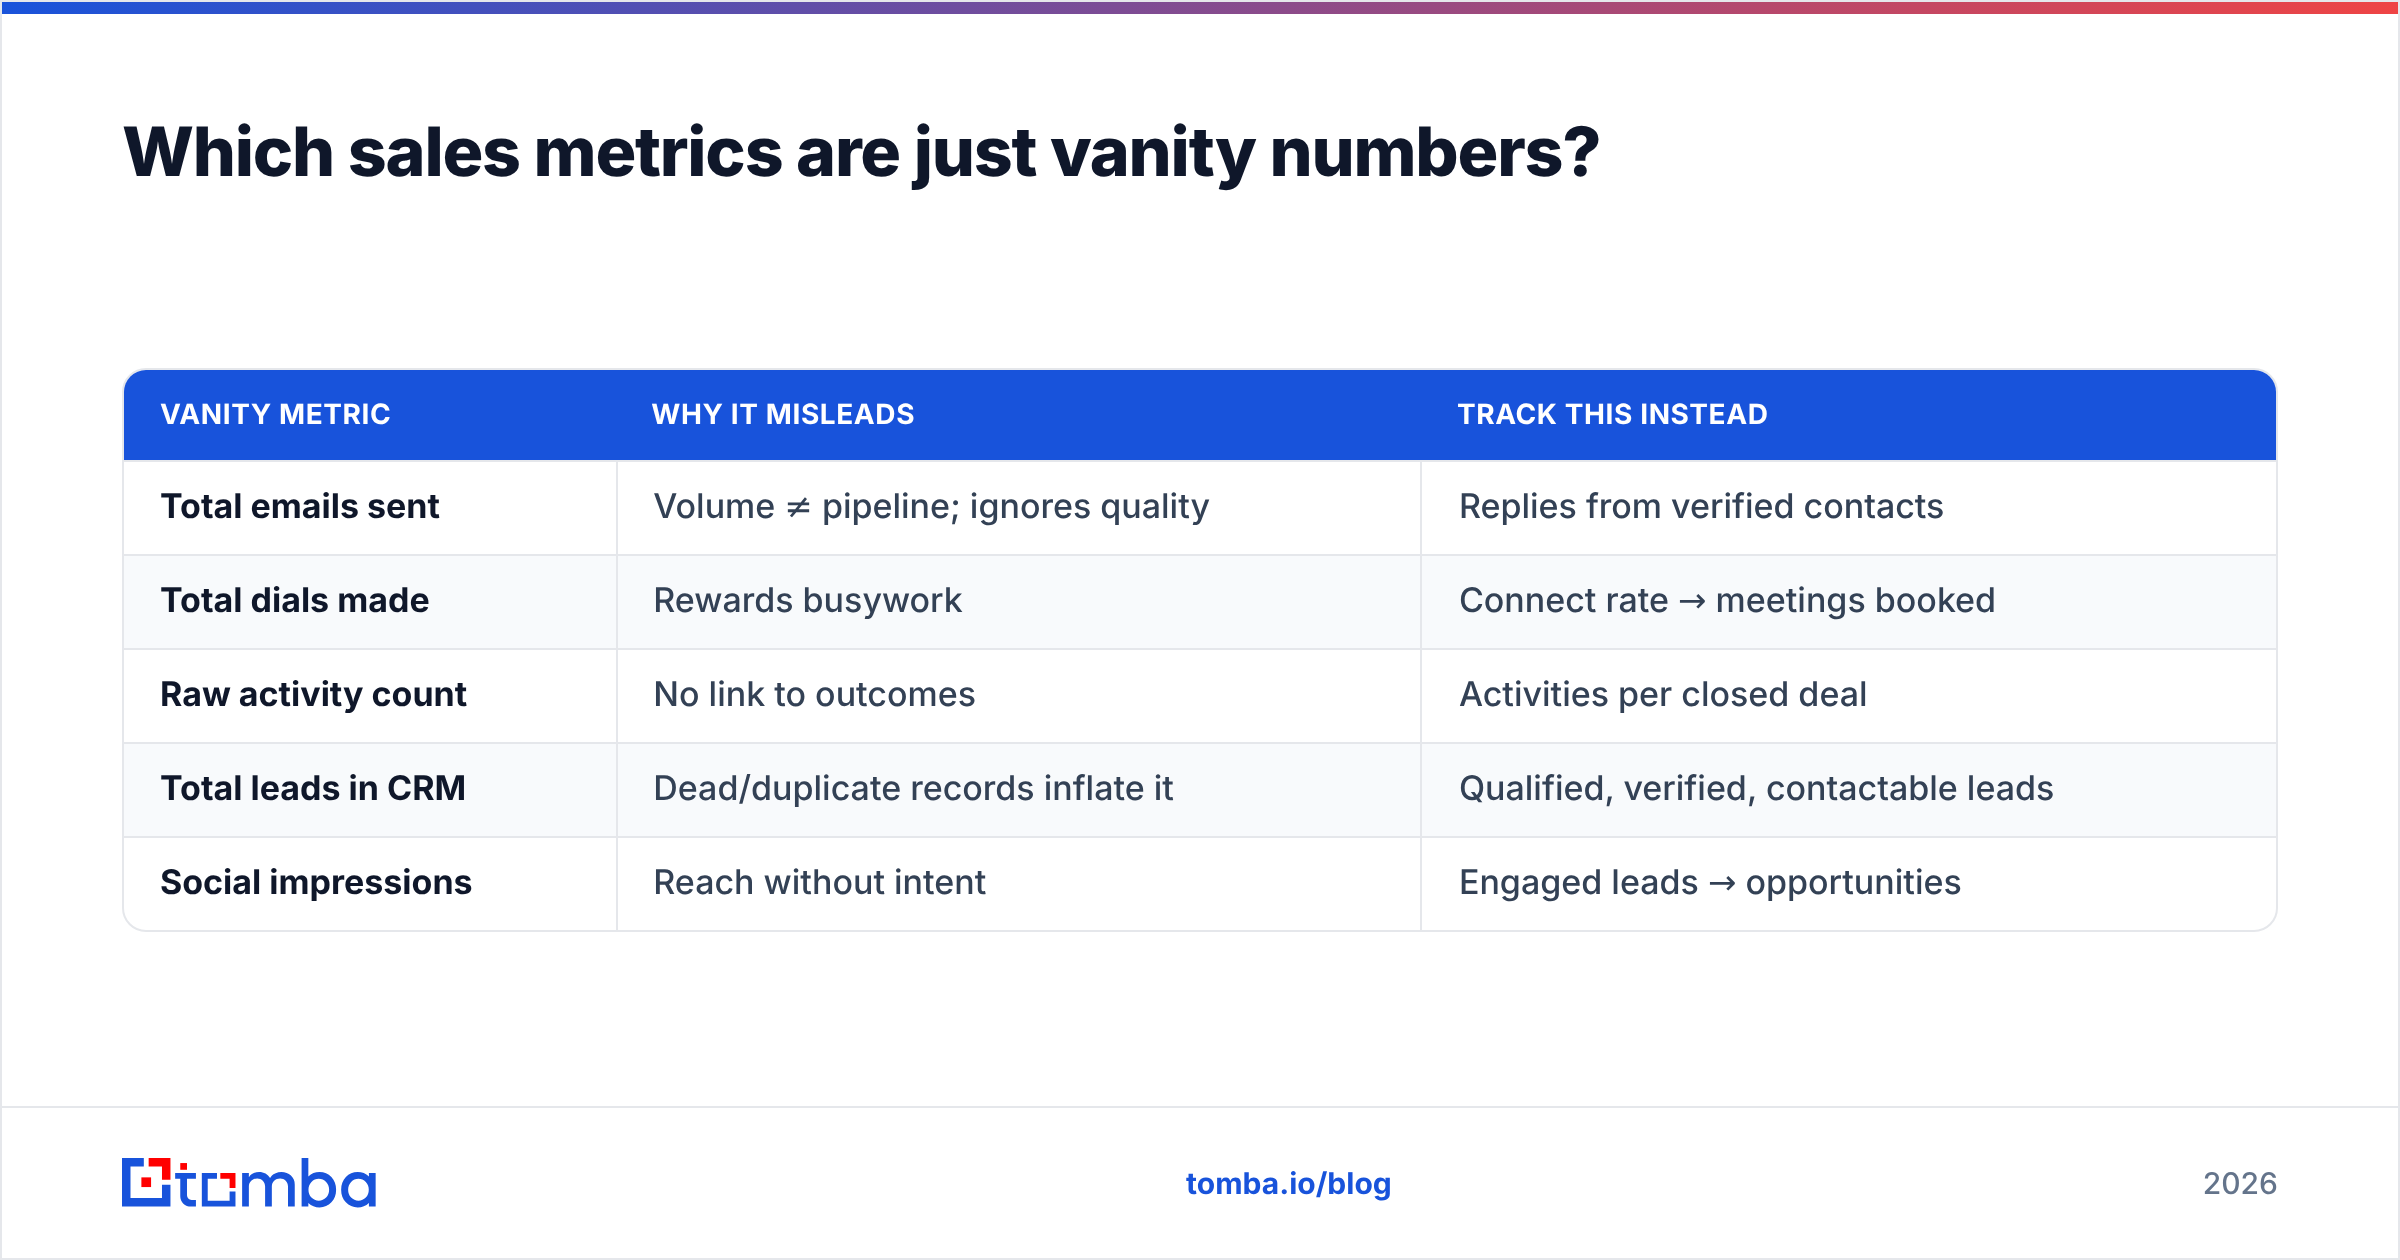
Some metrics feel like progress but don't forecast anything. Watch for these.
| Vanity metric | Why it misleads | Track this instead |
|---|---|---|
| Total emails sent | Volume ≠ pipeline; ignores quality | Replies from verified contacts |
| Total dials made | Rewards busywork | Connect rate → meetings booked |
| Raw activity count | No link to outcomes | Activities per closed deal |
| Total leads in CRM | Dead/duplicate records inflate it | Qualified, verified, contactable leads |
| Social impressions | Reach without intent | Engaged leads → opportunities |
The common thread: vanity metrics measure effort, not effect. "We sent 10,000 emails" sounds impressive until you learn 30% bounced because the list was never verified. That's not activity — it's noise that also torches your sender reputation. The fix is to anchor every activity metric to a downstream outcome: dials to connects, connects to meetings, meetings to pipeline.

What RevOps metrics decide whether growth is profitable?#
Frontline metrics tell you if reps are selling well. RevOps metrics tell you if the business is working. These are the numbers a founder or VP of Sales cares about most.
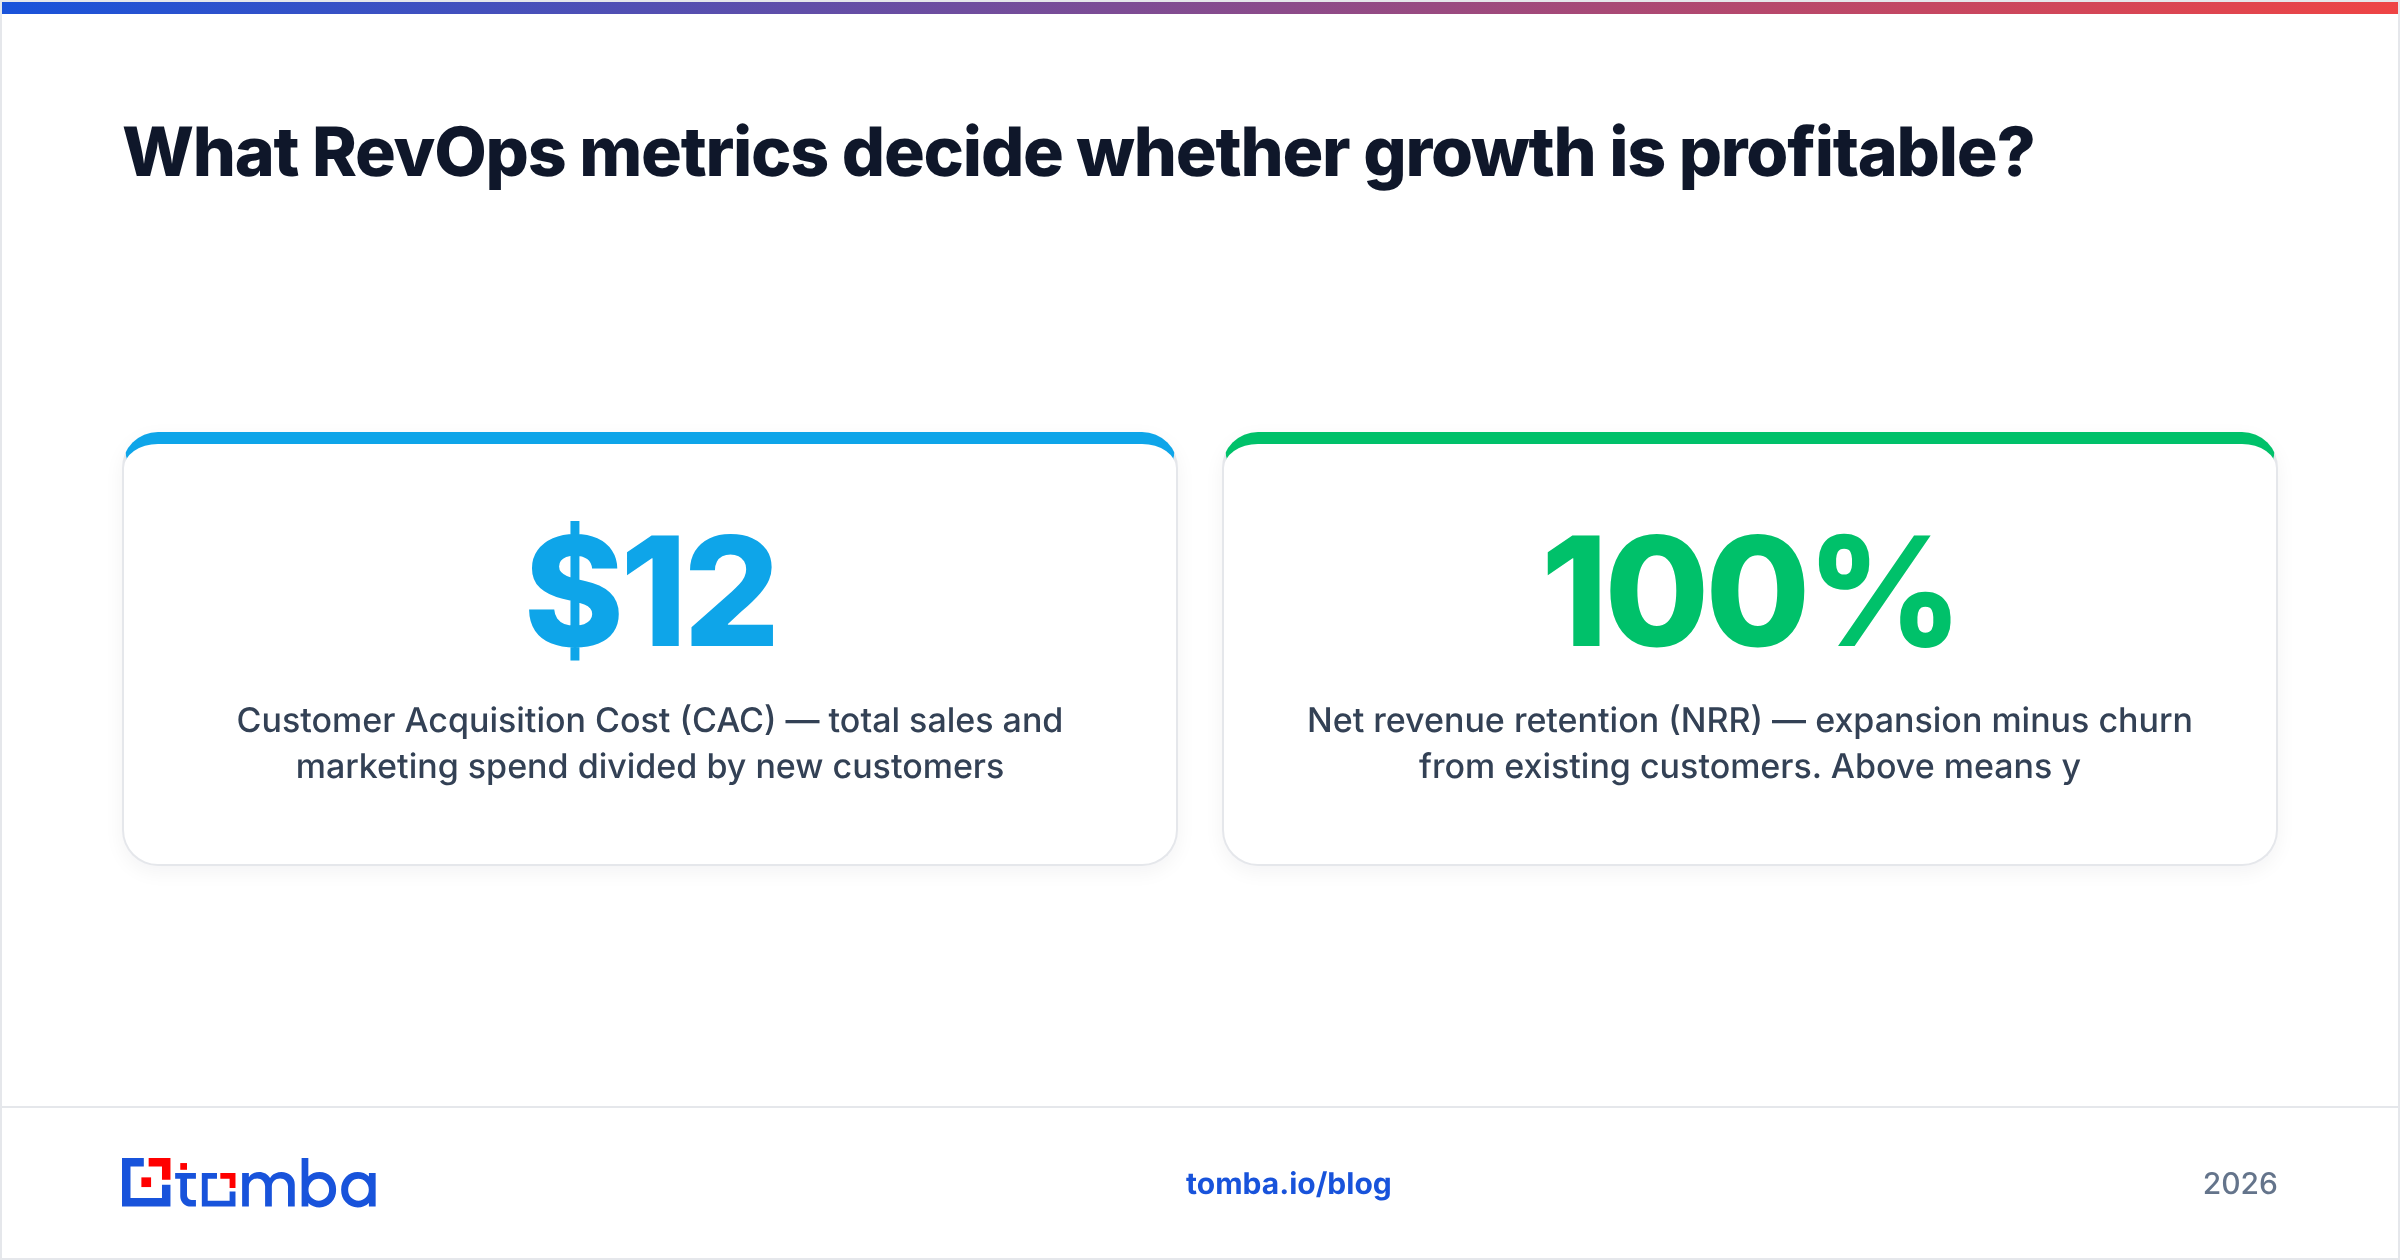
- Customer Acquisition Cost (CAC) — total sales and marketing spend divided by new customers acquired. If it costs $12,000 to land a $10,000/year customer, you have a math problem no amount of hustle fixes.
- Lifetime Value (LTV) — total revenue you expect from a customer across the relationship. Formula:
average revenue per account × average customer lifespan. - LTV:CAC ratio — the master efficiency metric. A ratio of 3:1 is the widely cited healthy target; below 1:1 means you lose money on every deal.
- CAC payback period — months of revenue needed to recoup acquisition cost. Under 12 months is strong for most B2B SaaS.
- Net revenue retention (NRR) — expansion minus churn from existing customers. Above 100% means you'd grow even with zero new logos.
These connect directly to data quality. CAC balloons when reps burn hours chasing bad-fit or unreachable prospects. Tightening the top of the funnel with accurate targeting — using enrichment and data enrichment to prioritize contactable, in-market accounts — is one of the few levers that moves CAC and win rate at the same time. For a full picture of how these tie into go-to-market planning, HubSpot's sales metrics resources and Salesforce's guidance are solid outside references.
How does data quality affect your sales metrics?#
Every metric you track is only as trustworthy as the data feeding it — and this is where most dashboards quietly lie.
Consider pipeline coverage. You report 4x coverage and feel safe. But if a third of those opportunities are attached to contacts with dead email addresses or wrong decision-makers, your real coverage is closer to 2.7x, and your forecast is fiction. The metric didn't lie; the data underneath it did.
The same rot spreads everywhere:
- Win rate looks worse than reality when unqualified junk leads inflate the denominator.
- Conversion by stage is meaningless if deals stall because reps can't reach the buyer, not because the pitch failed.
- CAC climbs when reps waste cycles on prospects who were never contactable.
The upstream fix is boring but decisive: verify contacts before they enter the pipeline, and enrich them so reps target the right people. A verified email verifier pass on new leads keeps bounce rates low and conversion math honest. Clean inputs don't just improve one metric — they make every downstream number trustworthy. As the old data axiom goes (and Wikipedia's garbage in, garbage out entry documents), no amount of dashboard polish rescues bad source data.
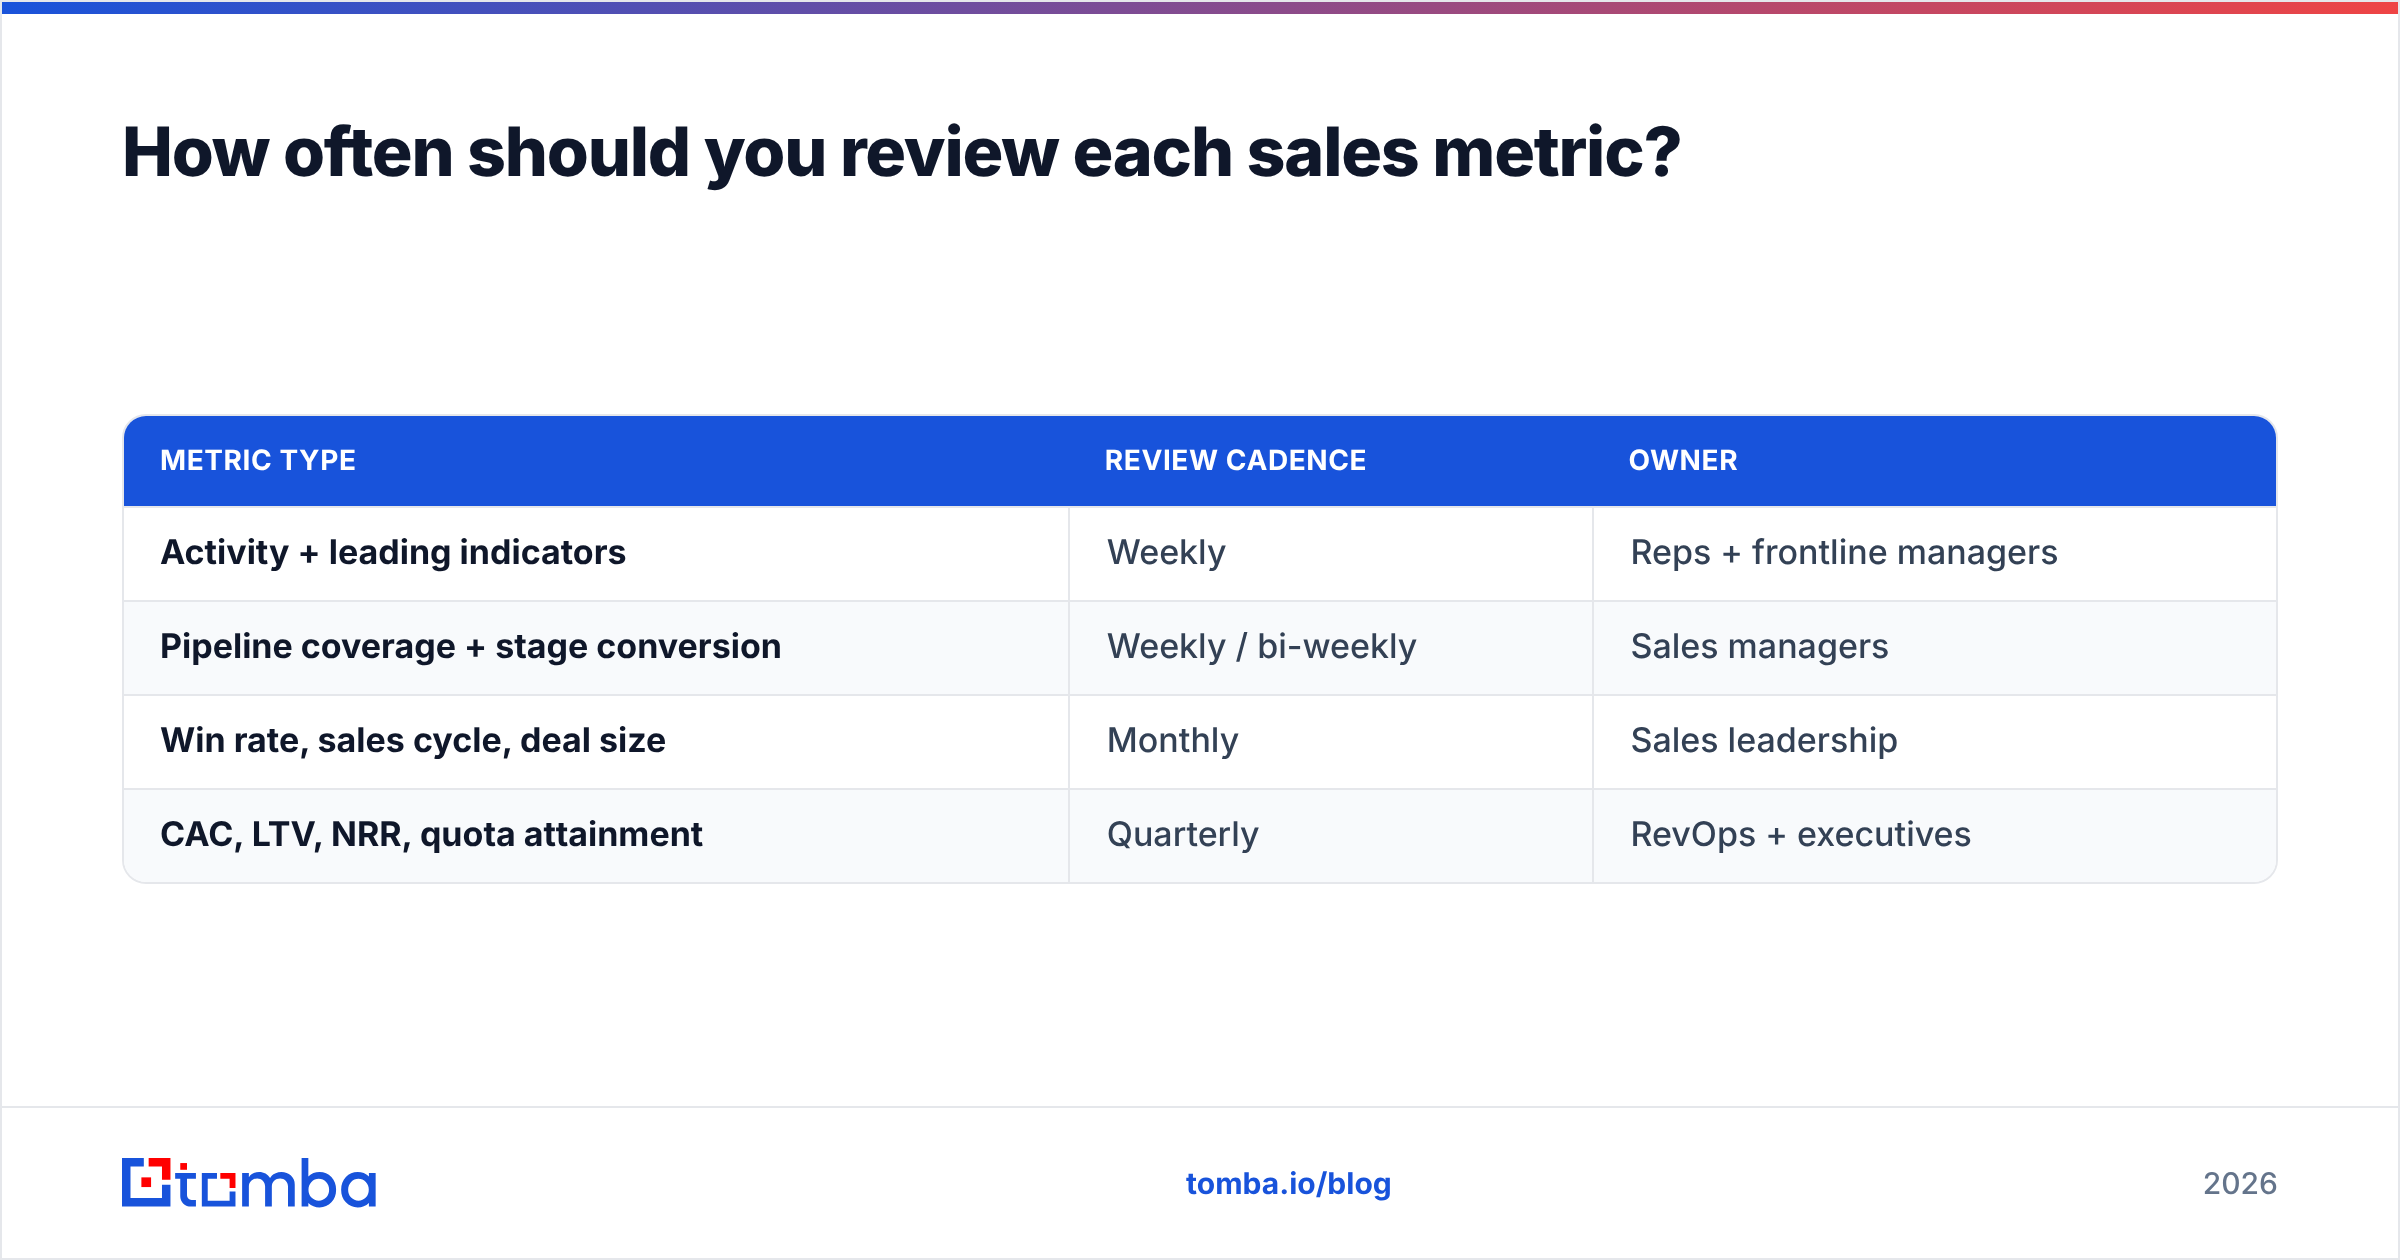
How often should you review each sales metric?#
Cadence matters as much as the metric itself. Reviewing win rate daily creates panic over noise; reviewing pipeline coverage quarterly means you learn about a gap too late.
| Metric type | Review cadence | Owner |
|---|---|---|
| Activity + leading indicators | Weekly | Reps + frontline managers |
| Pipeline coverage + stage conversion | Weekly / bi-weekly | Sales managers |
| Win rate, sales cycle, deal size | Monthly | Sales leadership |
| CAC, LTV, NRR, quota attainment | Quarterly | RevOps + executives |
The rule of thumb: the faster a metric can change and the more you can influence it, the more often you should look at it. Leading indicators earn a weekly slot because you can still act on them. Lagging efficiency metrics like LTV:CAC move slowly and belong in a quarterly business review, not a Monday standup.
Putting it together: the metrics that actually matter#
If you strip everything back, healthy sales measurement rests on four questions:
- Are we effective? → Win rate, conversion by stage
- Are we fast? → Sales cycle length, velocity
- Do we have enough? → Pipeline coverage, qualified leads created
- Are we profitable? → CAC, LTV:CAC, NRR
Answer those four honestly and you're ahead of most teams drowning in twelve-widget dashboards. Everything else is supporting detail or, worse, vanity.
The uncomfortable truth is that none of these metrics are reliable if the contact data underneath them is stale. Inflated pipeline, phantom leads, and bounced outreach corrupt the exact numbers you're trying to steer by. Fix the inputs first.
Start with clean, contactable data#
You can't improve metrics built on bad contacts. Before you obsess over win rate or pipeline coverage, make sure the prospects in your funnel are real, reachable, and correctly targeted. The Tomba Email Finder finds verified professional email addresses by name, domain, or company — so every lead entering your pipeline is contactable from day one, and every downstream metric reflects reality instead of guesswork. Pair it with bulk verification and enrichment, and your dashboard finally starts telling the truth. See Tomba pricing — including a free tier of 25 searches a month — to test it against your own list before you commit.
Related guides#
Ready to find emails that actually work?
Join 150,000+ professionals who stopped guessing and started sending. Free credits on signup — no credit card required.
Get the Tomba newsletter
Practical outbound tactics and product updates — once every two weeks.
About the author