Competitive Landscape Example: How to Map Your Market in 2026
A real, filled-in competitive landscape example you can copy today — the exact table, axes, and data sources GTM teams use to map rivals and find open lanes in 2026.
Most "competitive landscape" articles show you a definition and a blank template, then leave. This one hands you a finished, filled-in example — a real map with real axes, real segments, and the exact data you need in each cell — so you can copy the structure and drop your own market into it by the end of the afternoon.
TL;DR#
- A competitive landscape example is a filled-in map of every player in your market, scored on the two axes that actually decide deals — not a feature checklist.
- The fastest usable version is a 2x2 positioning matrix plus a feature-and-price comparison table. You'll see both, fully populated, below.
- Good maps are built on fresh contact and firmographic data, not last year's G2 screenshots — stale inputs produce confident, wrong conclusions.
- The point isn't to rank rivals. It's to find the open lane — the segment or price band nobody serves well.
- Refresh the map every quarter. Markets move; a landscape frozen in 2024 is a liability by 2026.
What is a competitive landscape (in one sentence)?#
A competitive landscape is a structured view of who competes for your buyer, how they're positioned, and where the gaps are. Think of it like a seating chart at a crowded wedding: you're not just listing who showed up, you're figuring out who's sitting where, who's next to whom, and — critically — which table still has an empty seat you can take.
Technically, it combines three artifacts: a positioning matrix (visual, two axes), a feature/price comparison table (granular, tabular), and a segment map (which competitor owns which buyer). Most teams stop at the first and wonder why it doesn't drive decisions. You need all three.
According to Gartner's market research guidance, the highest-value competitive work isn't cataloguing features — it's identifying where demand is underserved. Keep that lens on every cell you fill in below.
What does a real competitive landscape example look like?#
Let's build one. The market: B2B email-finding and lead-enrichment tools — a crowded, well-documented space that makes a clean teaching example.
Step 1: The positioning matrix#
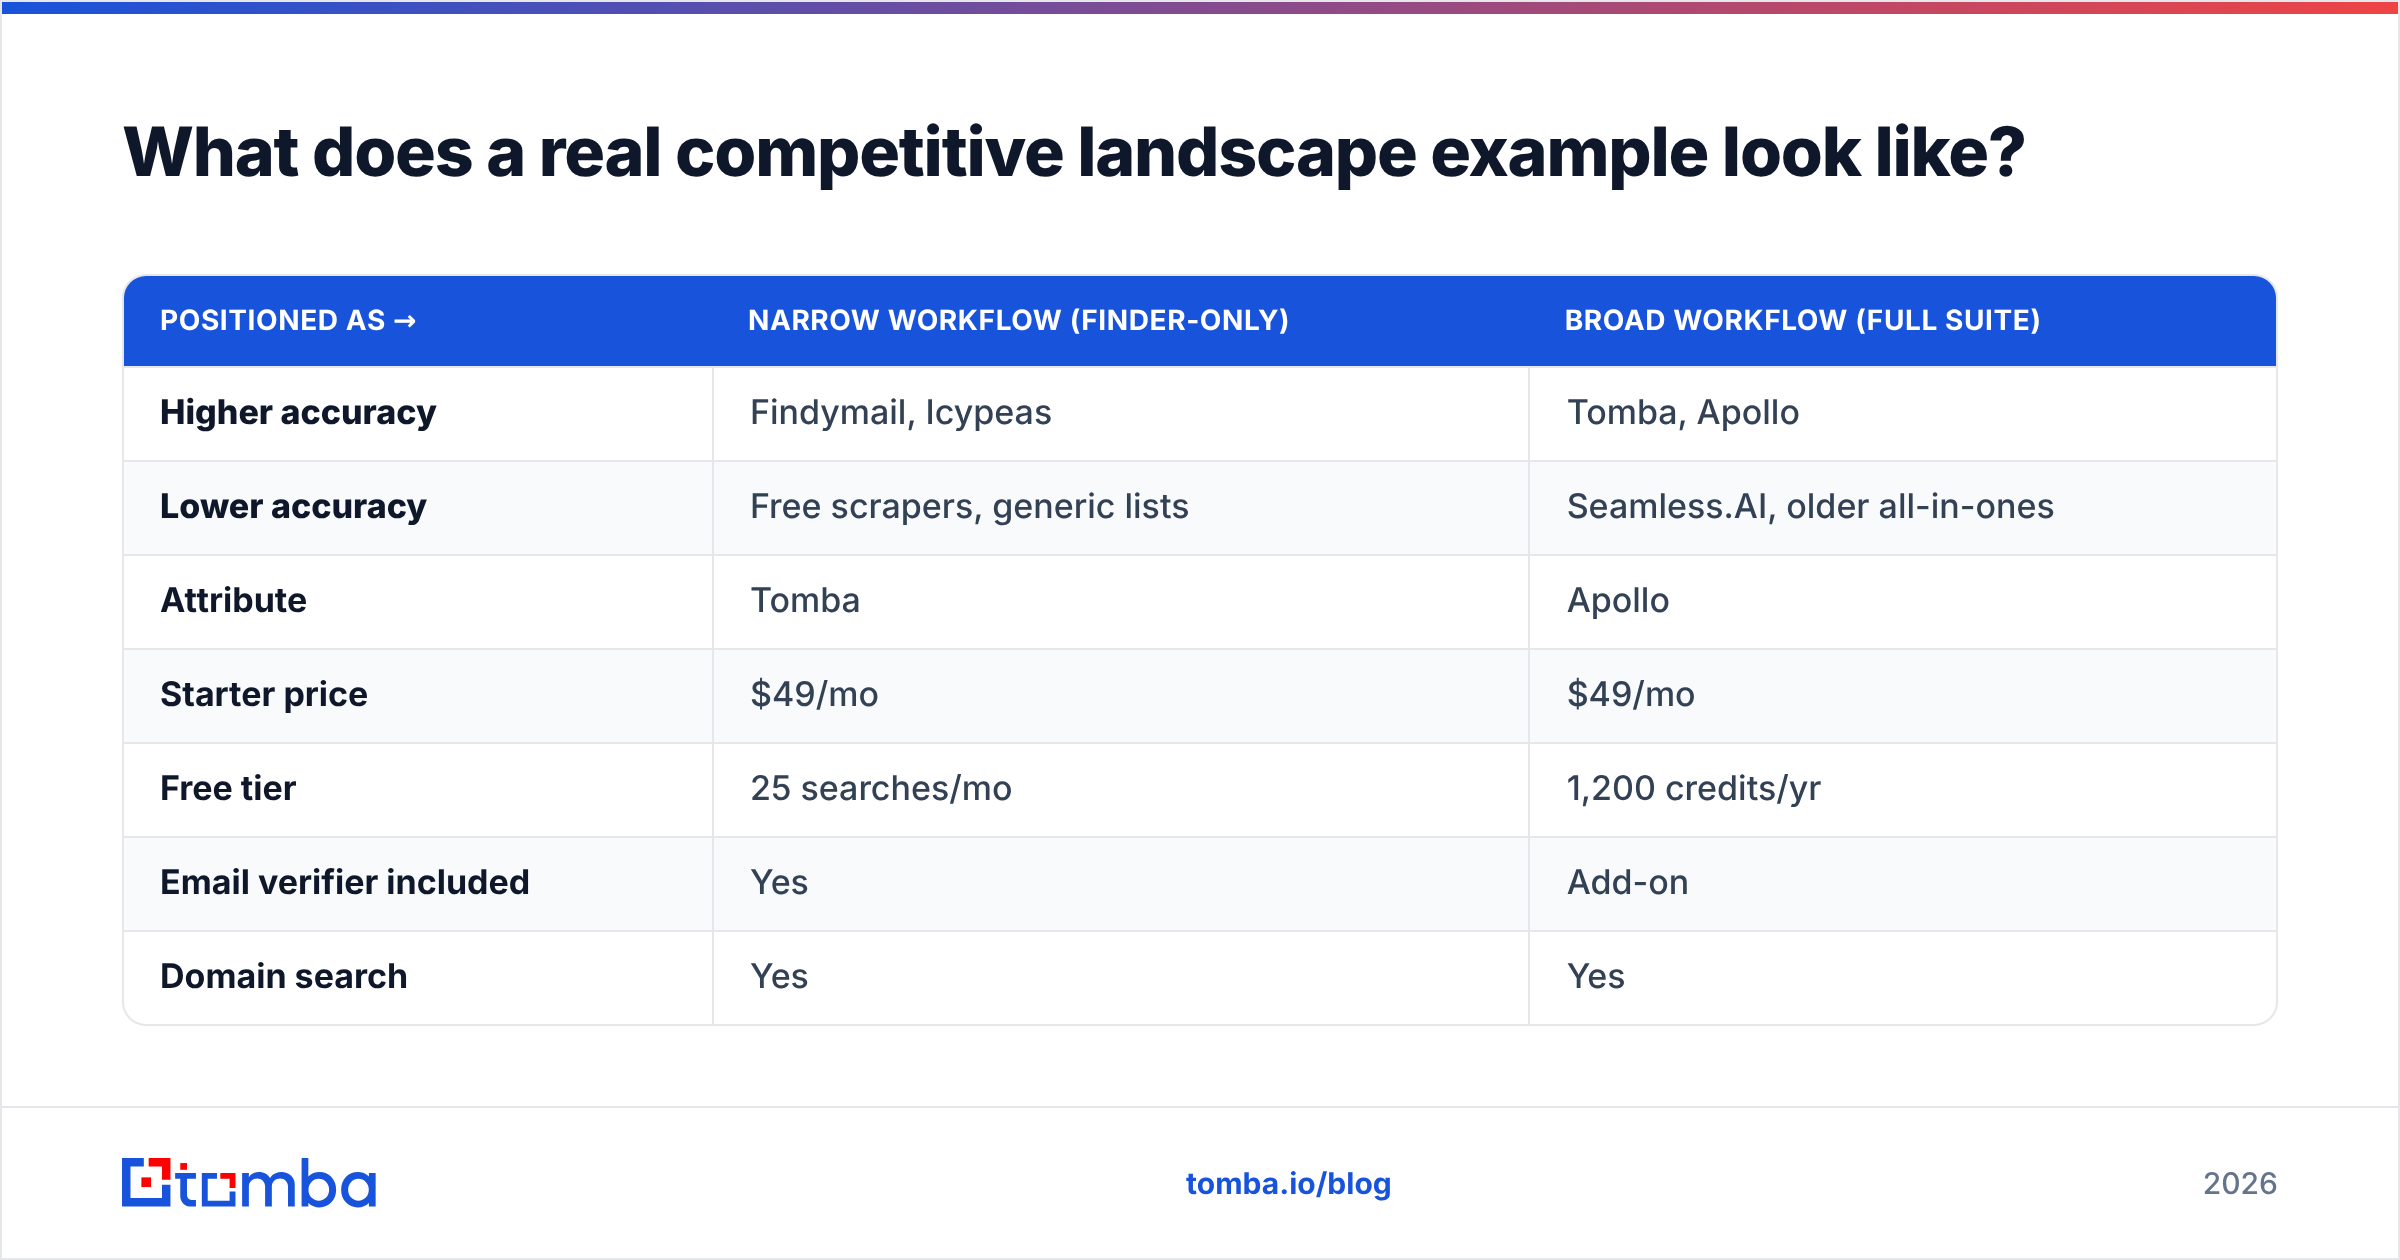
Pick the two axes that decide real purchases. For this market, buyers choose on data accuracy (does the email actually deliver?) and breadth of workflow (finder-only, or a full enrichment suite?). Here's the filled-in map:
| Positioned as → | Narrow workflow (finder-only) | Broad workflow (full suite) |
|---|---|---|
| Higher accuracy | Findymail, Icypeas | Tomba, Apollo |
| Lower accuracy | Free scrapers, generic lists | Seamless.AI, older all-in-ones |
Read it the way a buyer would. The top-right quadrant — accurate and broad — is where enterprise budget concentrates, and it's where Tomba sits alongside larger platforms. The top-left is a real, defensible niche for teams that only want a finder. The bottom row is where price competition is brutal and churn is high.
The empty seat? Mid-market teams that want top-right accuracy without top-right pricing. That's the lane.
Step 2: The feature and price comparison table#
The matrix tells you where players sit. The table tells you why. This is the artifact your sales team actually uses on calls:
| Attribute | Tomba | Apollo | Findymail | Seamless.AI |
|---|---|---|---|---|
| Starter price | $49/mo | $49/mo | $49/mo | Custom quote |
| Free tier | 25 searches/mo | 1,200 credits/yr | No | Limited trial |
| Email verifier included | Yes | Add-on | Basic | Yes |
| Domain search | Yes | Yes | Limited | Yes |
| Catch-all handling | Dedicated verifier | Partial | Partial | Weak |
| Phone / mobile data | Yes | Yes | No | Yes |
| Native API + CLI | Yes | Yes | API only | API only |
| Best-fit buyer | SMB → mid-market | Mid-market → ent. | Solo / agencies | High-volume outbound |
A few things jump out that the matrix alone hid. Free-tier generosity varies wildly. Catch-all handling — which quietly wrecks bounce rates — is a genuine differentiator, and Tomba's dedicated catch-all verifier is a concrete edge for teams emailing corporate domains. And "best-fit buyer" is the real output: no tool wins everywhere, and pretending otherwise is how you lose deals you should have won.

Step 3: The segment map#
Finally, tie each competitor to the buyer they actually own:
- Solo founders / agencies — price-sensitive, want a finder that just works. Findymail and Tomba's free tier compete here.
- SMB sales teams — need finder plus verification plus a CRM path. Tomba and Apollo's lower tiers.
- Mid-market RevOps — want data enrichment and bulk workflows. Tomba, Apollo, Clay-style stacks.
- Enterprise outbound — volume and coverage over everything. Apollo, Seamless.AI, ZoomInfo.
Now the strategy writes itself: if you're selling into mid-market RevOps, your competitive story is "top-quadrant accuracy, mid-market price, real bulk workflows" — and you can prove every clause from the table above.
Why do most competitive landscape examples fail?#
Three predictable reasons, and all of them are fixable.
They use stale data. A landscape built on a competitor's 2024 pricing page is fiction. Prices change, tiers get renamed, free plans vanish. If your map says a rival charges "$39/mo" and they've moved to $49, every downstream conclusion inherits that error. Rebuild the data layer, don't recycle it.
They confuse a feature list with a strategy. Forty rows of checkmarks is not analysis — it's a spreadsheet with opinions. The strategic move is collapsing forty features into the two or three that actually flip deals, then mapping only those.
They flatter the author. Internal landscapes tend to put "us" in the top-right and everyone else in the bottom-left. That feels great and teaches you nothing. A landscape that doesn't make you slightly uncomfortable isn't finished. As HubSpot's competitive analysis framework puts it, the goal is an honest read of where you're genuinely weaker, so you can decide whether to fix it or route around it.
How do you build the data layer for a competitive landscape?#
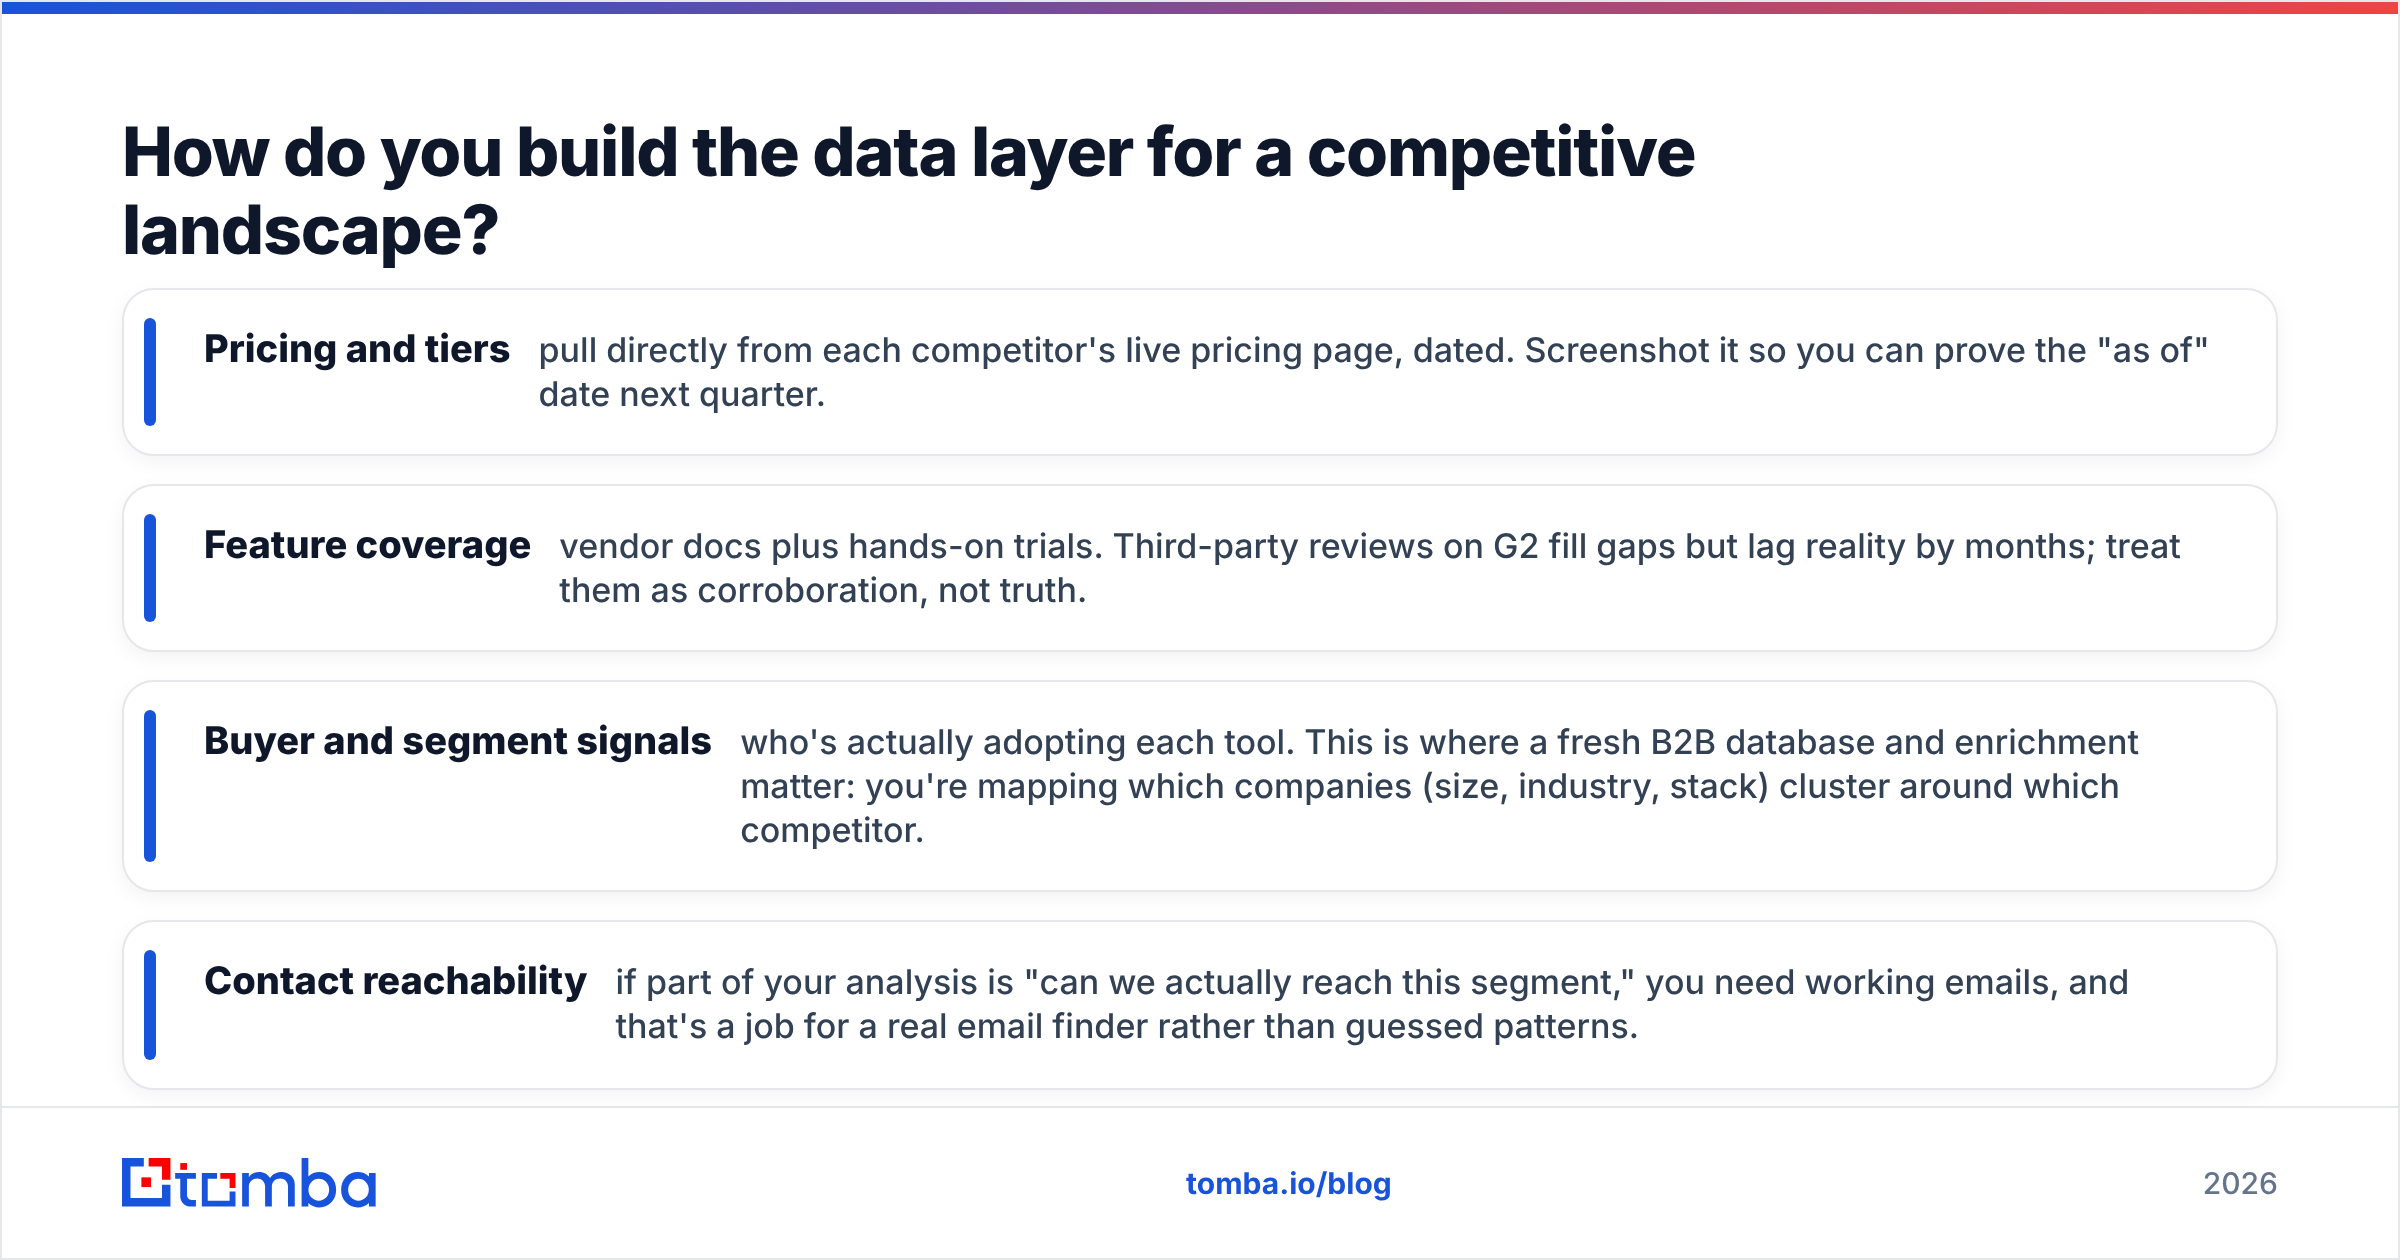
Every cell in those tables is a claim, and every claim needs a source. Here's where the inputs come from:
- Pricing and tiers — pull directly from each competitor's live pricing page, dated. Screenshot it so you can prove the "as of" date next quarter.
- Feature coverage — vendor docs plus hands-on trials. Third-party reviews on G2 fill gaps but lag reality by months; treat them as corroboration, not truth.
- Buyer and segment signals — who's actually adopting each tool. This is where a fresh B2B database and enrichment matter: you're mapping which companies (size, industry, stack) cluster around which competitor.
- Contact reachability — if part of your analysis is "can we actually reach this segment," you need working emails, and that's a job for a real email finder rather than guessed patterns.
The theme: your map is exactly as good as its freshest input. Garbage in, confident-garbage out.

Which competitive landscape format should you use?#
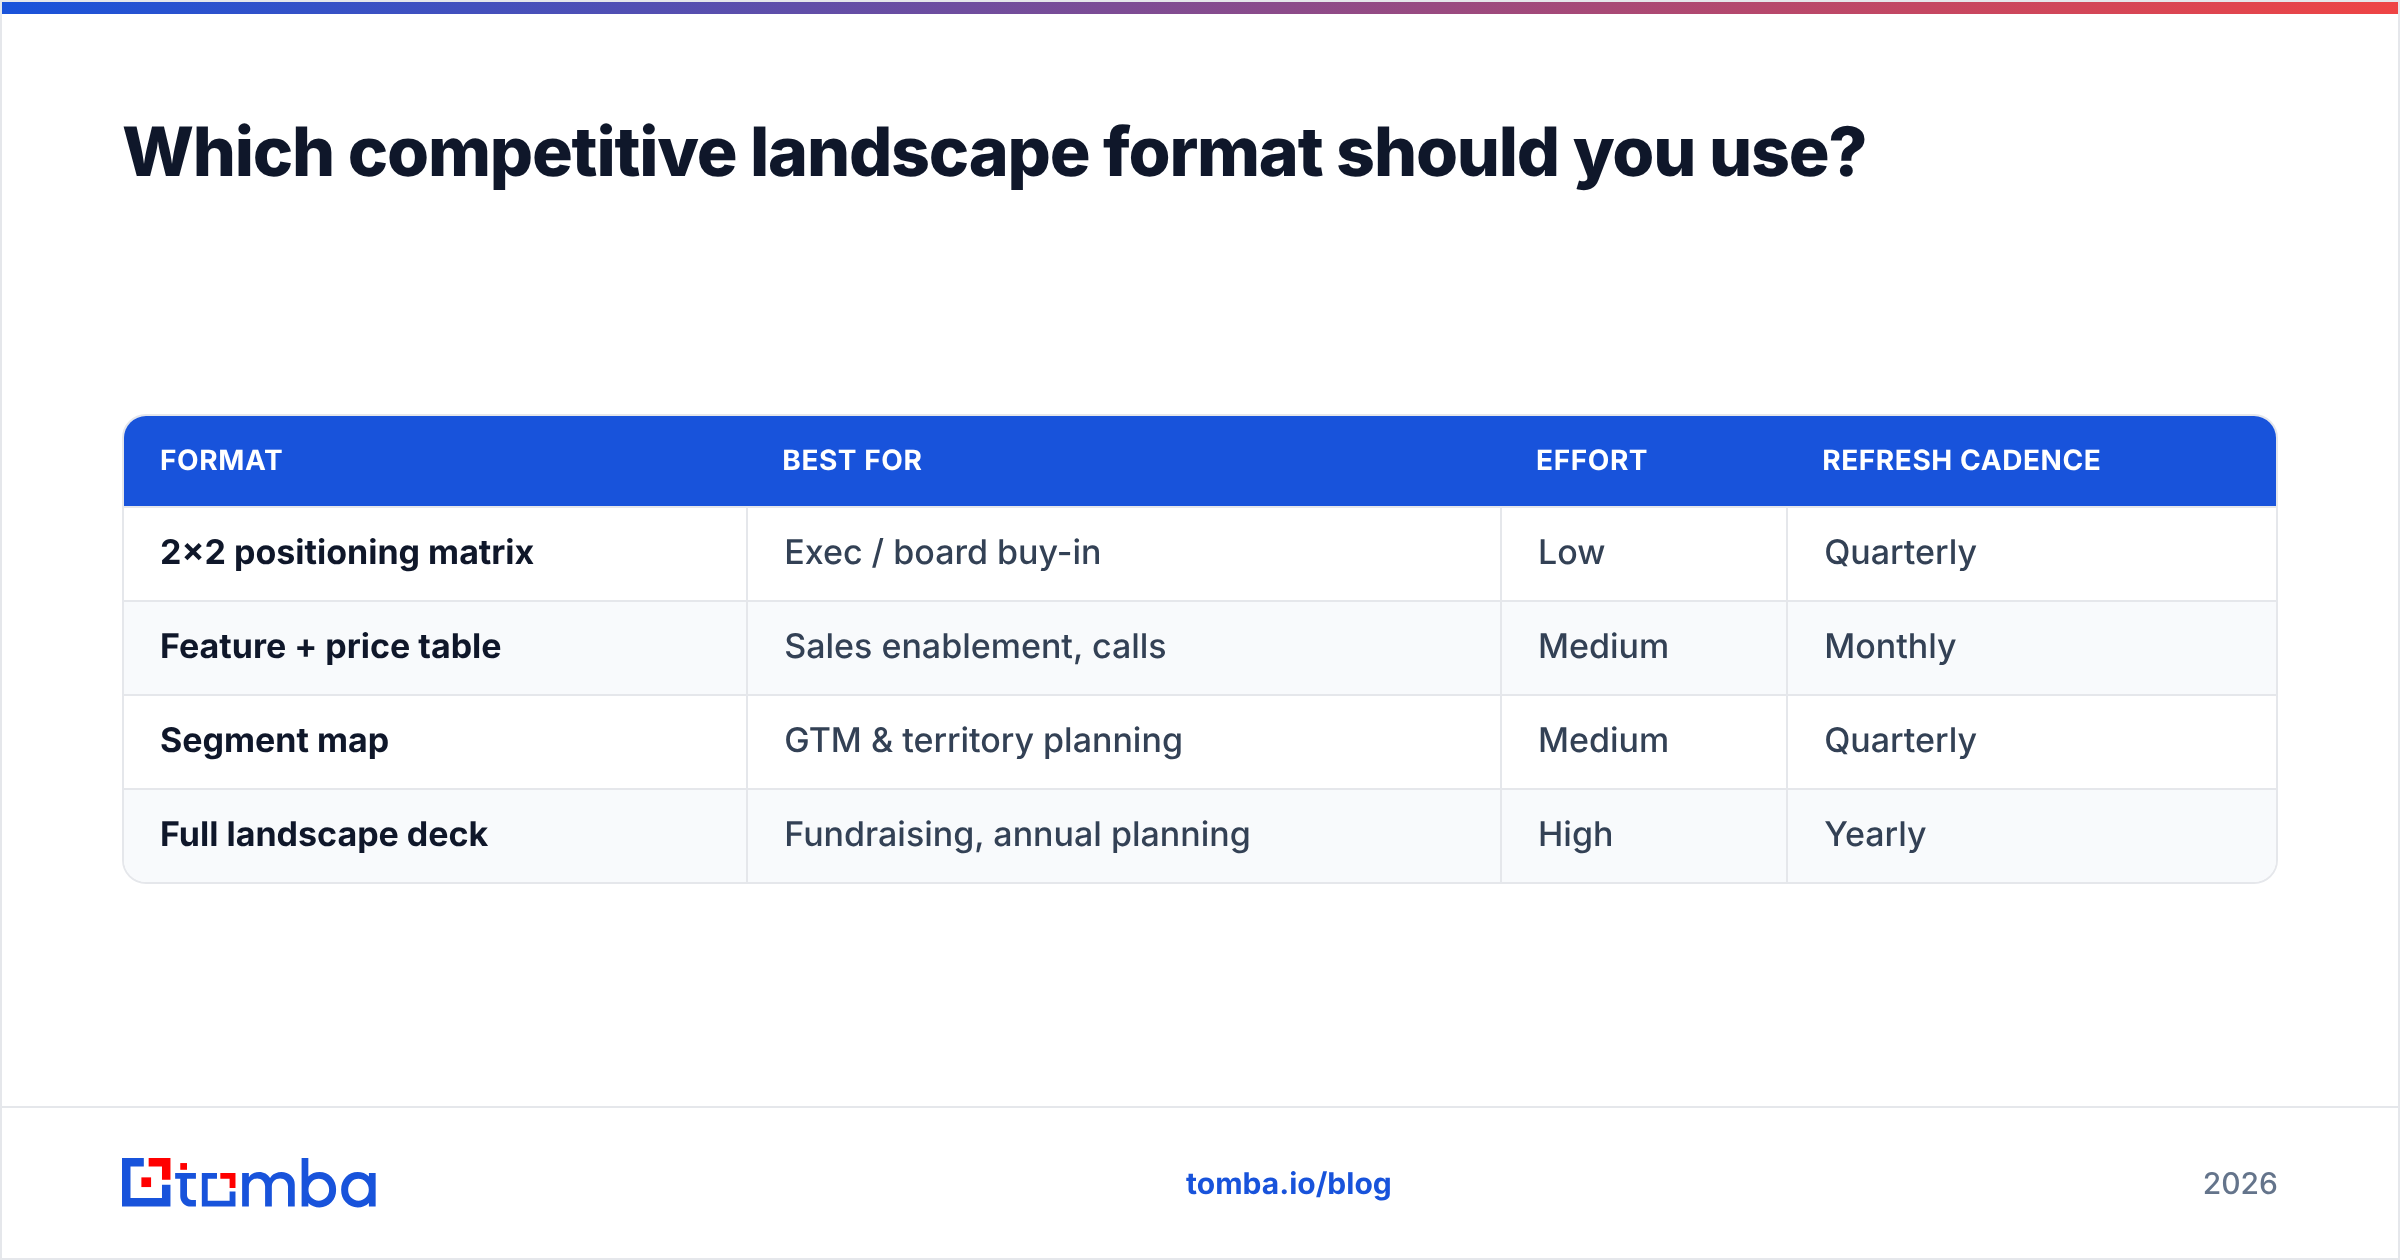
Match the artifact to the audience. Here's the quick decision guide:
| Format | Best for | Effort | Refresh cadence |
|---|---|---|---|
| 2x2 positioning matrix | Exec / board buy-in | Low | Quarterly |
| Feature + price table | Sales enablement, calls | Medium | Monthly |
| Segment map | GTM & territory planning | Medium | Quarterly |
| Full landscape deck | Fundraising, annual planning | High | Yearly |
A common mistake is building the high-effort deck when a one-page matrix would have moved the meeting. Start with the matrix, add the table when sales asks for ammunition, and only build the full deck when the stakes (a raise, an annual plan) justify the hours.
How often should you refresh a competitive landscape?#
Quarterly for the matrix and segment map; monthly for the price table. Pricing and packaging change fastest, and a sales rep quoting a competitor's old price on a live call is a credibility grenade.
Set a recurring calendar block, re-pull the pricing pages, re-run your enrichment on the segments, and note what moved. Most quarters, two or three cells change — but occasionally a competitor makes a big move (kills a free tier, adds phone data, drops a price), and catching it early is worth the entire exercise. A landscape you built once and never touched is a museum piece, not a tool.
What's the one thing to take from this competitive landscape example?#
The map is a means, not an end. Its only job is to reveal the open lane — the segment, price band, or capability nobody serves well — and then give your team the language and the proof to own it. Everything in the two tables above exists to answer one question: where do we win, and how do we say it?
If you strip away the diagrams and the quadrants, a competitive landscape is really an argument about where demand is underserved and why you're the right answer. Build it on honest, current data, keep it to the two axes that matter, and refresh it before it rots.
Build your landscape on data that's actually true#
A competitive landscape is only as trustworthy as the contact and company data underneath it. Before you map a single quadrant, make sure your segment and reachability inputs are fresh: use the Tomba Email Finder to reach the buyers and accounts you're analyzing, layer in enrichment for firmographics, and start free with 25 searches a month — no card required. Check the full Tomba pricing when you're ready to run it at scale. Map the market on real data, find the empty seat, and take it.
Related guides#
Ready to find emails that actually work?
Join 150,000+ professionals who stopped guessing and started sending. Free credits on signup — no credit card required.
Get the Tomba newsletter
Practical outbound tactics and product updates — once every two weeks.
About the author