Contact Rate Formula: How to Calculate and Fix It in 2026
Most teams calculate contact rate wrong, then optimize the wrong lever. Here is the exact formula, the denominators that matter, honest 2026 benchmarks, and the data fixes that move the number.
TL;DR
- The contact rate formula is
(Unique prospects reached ÷ Unique prospects attempted) × 100. Note the word unique — using total dials or total sends as the denominator is the single most common way teams inflate this number. - Contact rate is not connect rate, answer rate, or response rate. Mixing them up makes your funnel math silently wrong at the top, which corrupts every downstream forecast.
- Realistic 2026 benchmarks: cold phone contact rates land around 3–8% per dial and 15–30% per prospect across a full cadence; cold email "contact" (delivered + opened + human reply possible) collapses fast when bounce rates climb above 3%.
- The fastest lever is almost never more activity. It's data: bad numbers, dead mailboxes, and stale titles cap your ceiling before a rep says a word.
- Fix the denominator, verify the data, then optimize timing and cadence. In that order.
What Is the Contact Rate Formula?#
Contact rate measures how often you actually reach a human being out of everyone you tried to reach.
Contact Rate = (Unique Prospects Contacted ÷ Unique Prospects Attempted) × 100That's it. Two numbers, one percentage. The difficulty is not the arithmetic — it's agreeing on what counts as "contacted" and what counts as "attempted."
Think of it like knocking on doors in an apartment building. Your contact rate is the percentage of doors where someone opened and spoke to you — not the percentage of knocks that produced a face. If you knock five times on the same door and someone finally answers, that's one contact out of one attempted door, not one out of five knocks. Both numbers are useful, but they answer different questions, and quietly swapping one for the other is how a 6% dial-level rate gets reported to leadership as a 25% "contact rate."
Define your terms once, write them down, and never move them:
- Contacted — A two-way human interaction occurred. Prospect picked up and spoke, replied to an email, or responded on LinkedIn. Voicemails, opens, and clicks are not contacts.
- Attempted — A unique prospect who received at least one touch inside a defined cadence window. Not touches. Not dials. People.
- Reachable — A prospect whose contact data passed verification. This is your denominator's honest ceiling; anything below it is data failure, not rep failure.
- Window — The cadence period the measurement covers, usually 14 or 21 days. Without a window, contact rate drifts upward forever as old prospects eventually pick up.
- Channel — Phone, email, and social contact rates should never be blended into one vanity number. They behave nothing alike.
Get those five right and the formula becomes trustworthy. Get them wrong and you'll spend a quarter coaching reps on a problem that lives in your database.
Why Do Teams Get the Denominator Wrong?#
Because the wrong denominator flatters everyone.
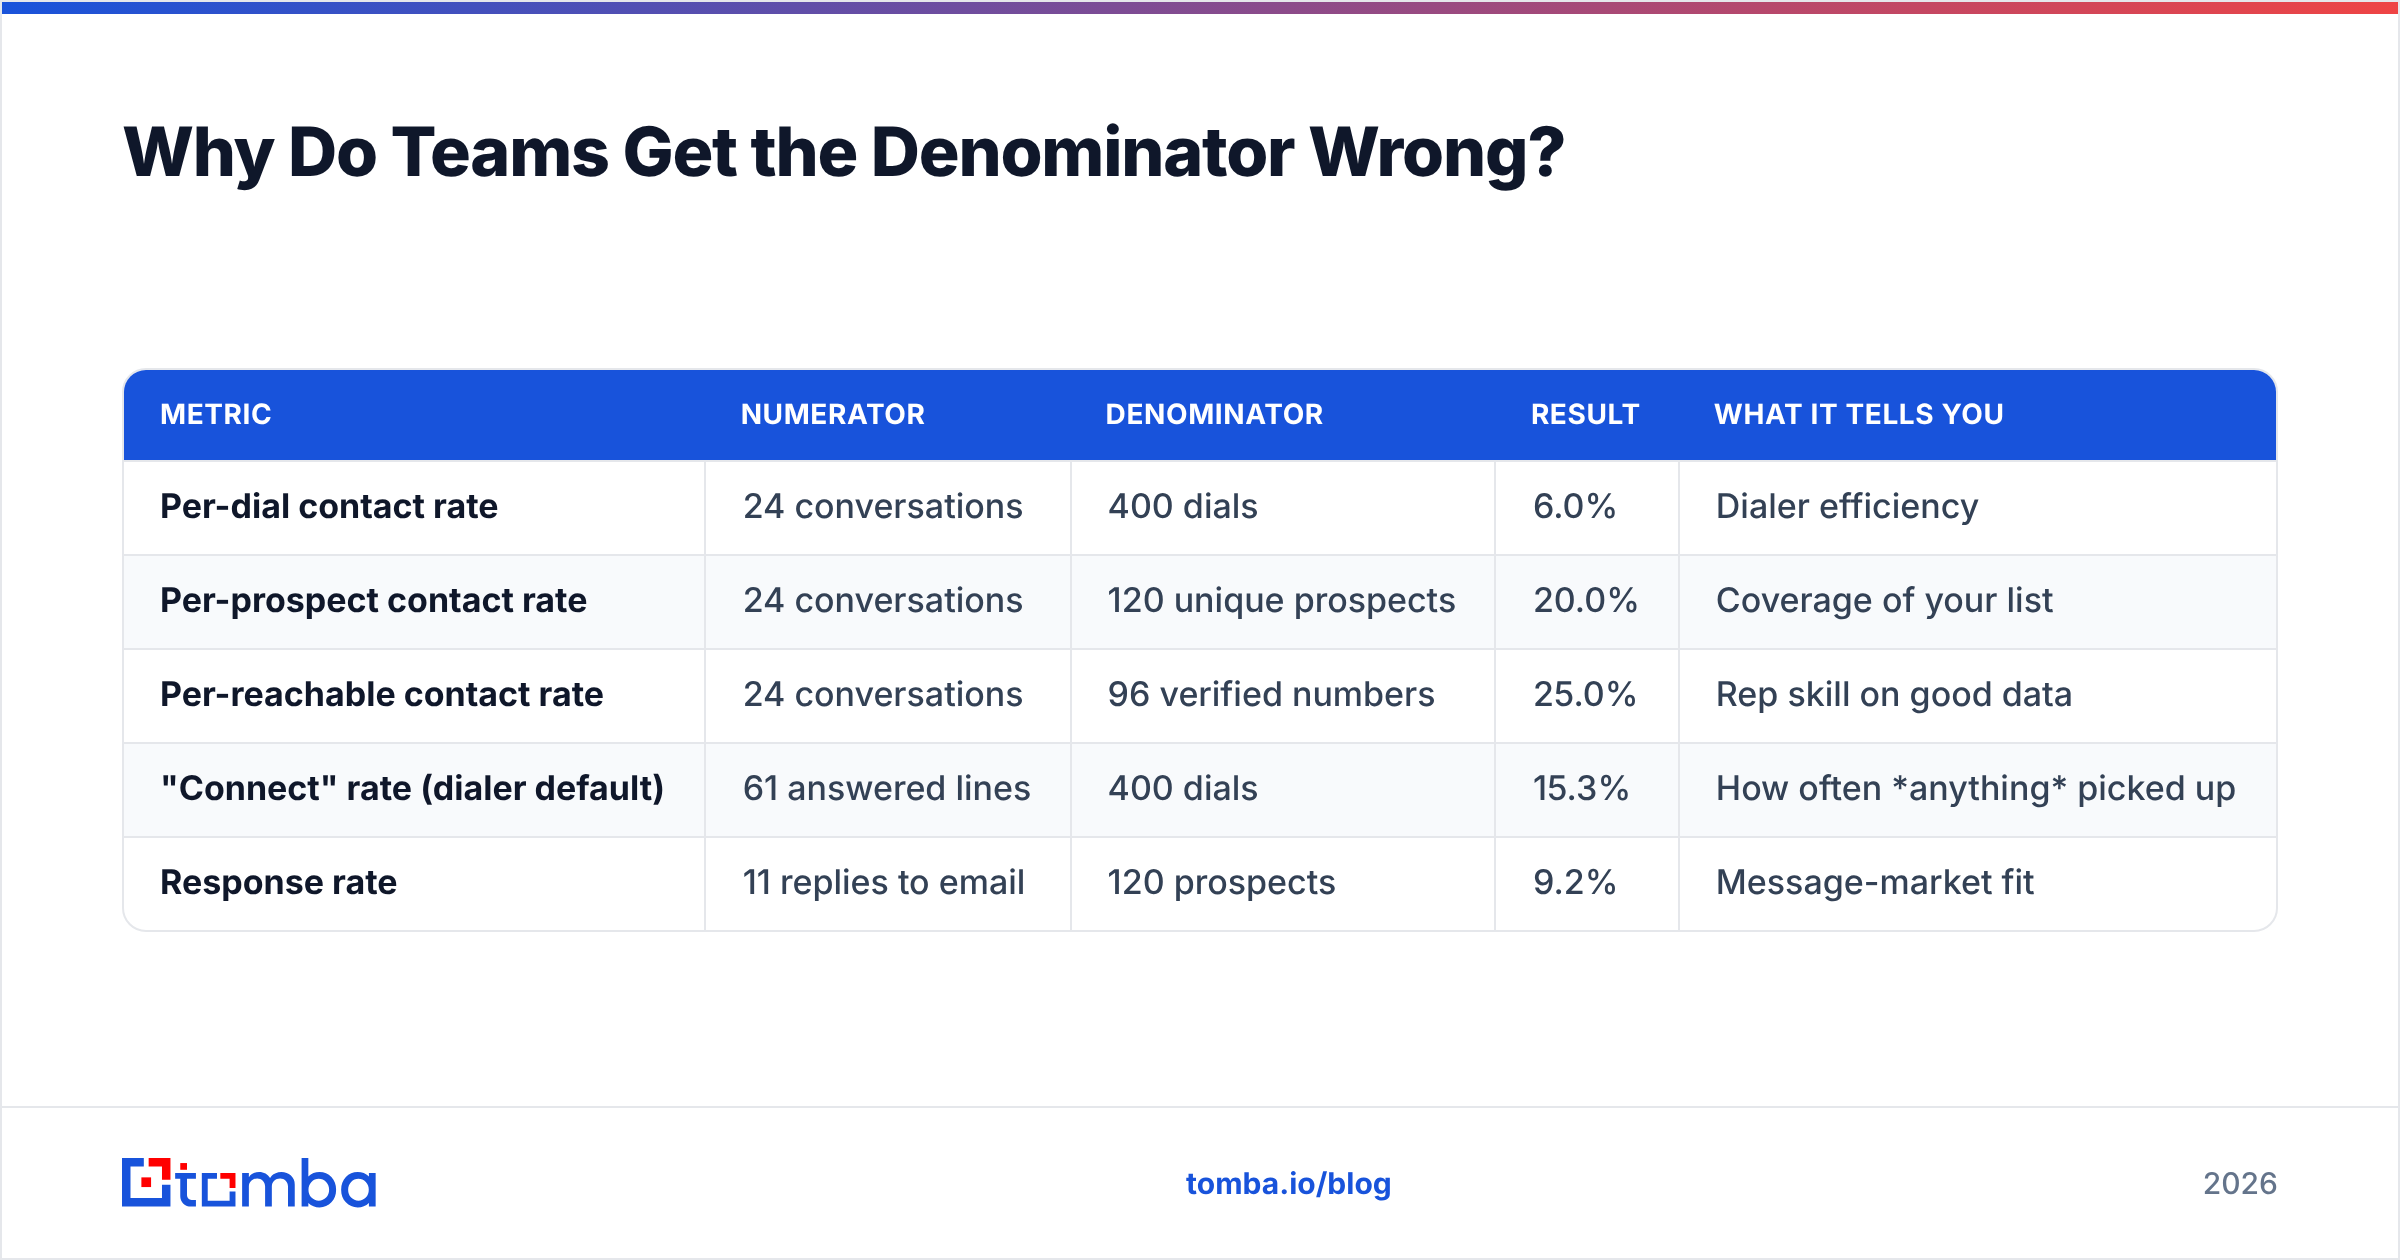
Sales ops usually pulls "attempts" straight from the dialer or sequencer, which logs activities, not people. A rep who dials 400 times to touch 120 accounts produces two very different pictures depending on which number you divide by:
| Metric | Numerator | Denominator | Result | What it tells you |
|---|---|---|---|---|
| Per-dial contact rate | 24 conversations | 400 dials | 6.0% | Dialer efficiency |
| Per-prospect contact rate | 24 conversations | 120 unique prospects | 20.0% | Coverage of your list |
| Per-reachable contact rate | 24 conversations | 96 verified numbers | 25.0% | Rep skill on good data |
| "Connect" rate (dialer default) | 61 answered lines | 400 dials | 15.3% | How often anything picked up |
| Response rate | 11 replies to email | 120 prospects | 9.2% | Message-market fit |
All five are real. All five get called "contact rate" in some CRM somewhere. The per-dial and per-prospect numbers differ by more than 3x on identical activity — which means a team can "improve contact rate from 6% to 20%" without changing a single behavior, just by changing a report definition.
The defensible default is per-prospect contact rate, with per-reachable tracked alongside it as the diagnostic. Per-prospect tells you whether your outbound motion works. Per-reachable tells you whether your reps or your data are to blame when it doesn't.
What Is a Good Contact Rate in 2026?#
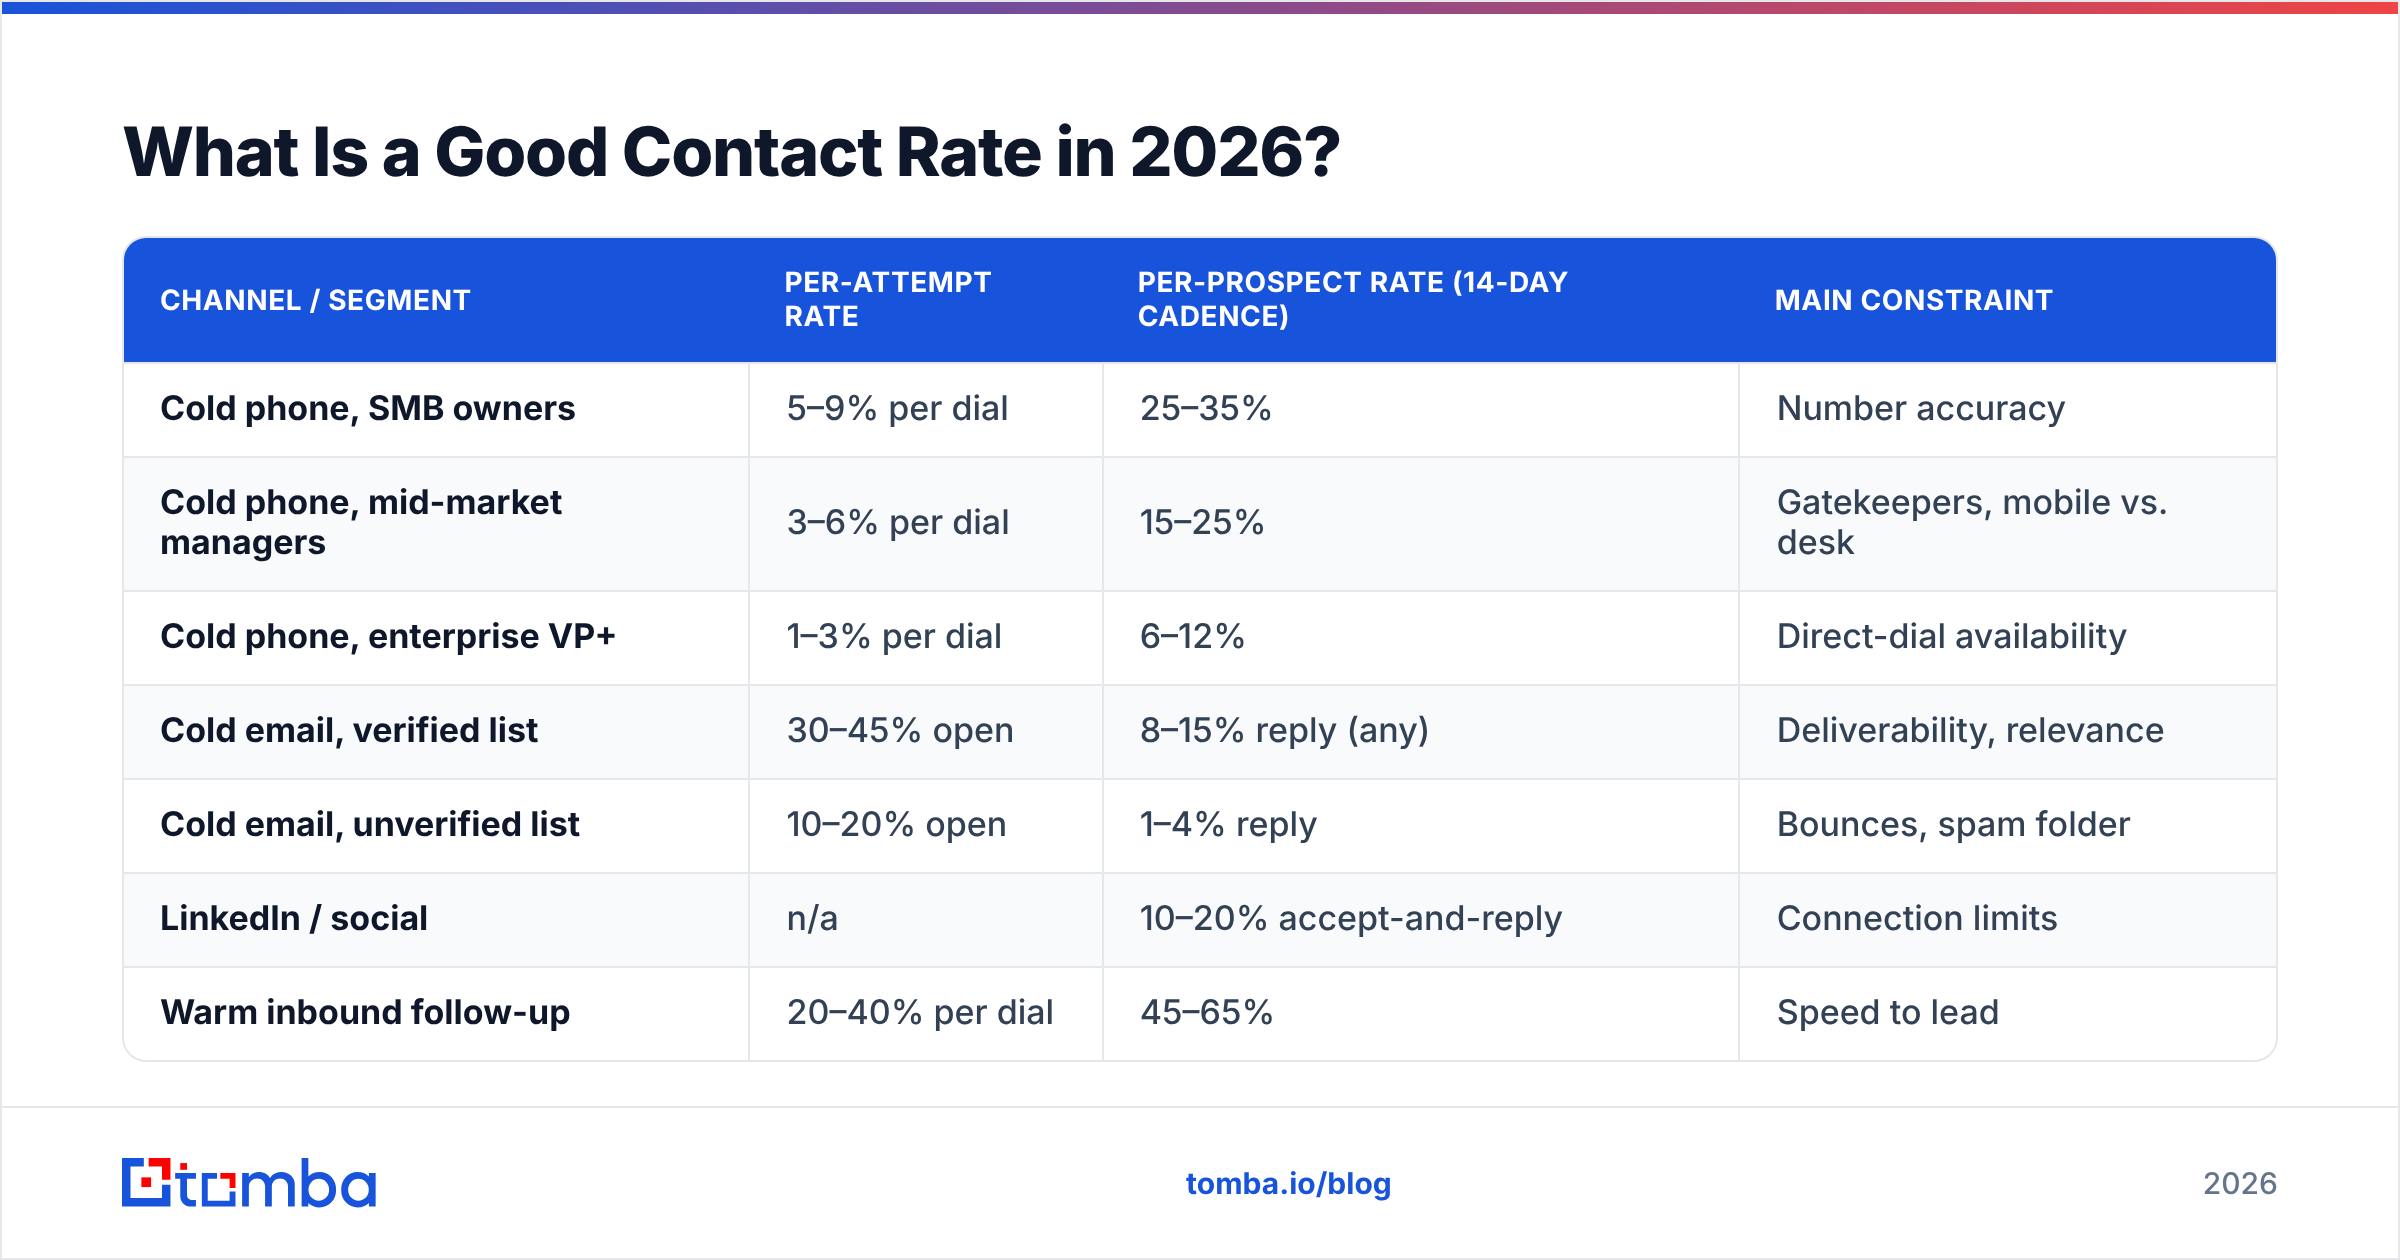
Honest answer: it depends more on your data quality and target persona than on your reps. But you need reference points, so here they are, drawn from what teams actually report rather than what vendors put on landing pages.
| Channel / segment | Per-attempt rate | Per-prospect rate (14-day cadence) | Main constraint |
|---|---|---|---|
| Cold phone, SMB owners | 5–9% per dial | 25–35% | Number accuracy |
| Cold phone, mid-market managers | 3–6% per dial | 15–25% | Gatekeepers, mobile vs. desk |
| Cold phone, enterprise VP+ | 1–3% per dial | 6–12% | Direct-dial availability |
| Cold email, verified list | 30–45% open | 8–15% reply (any) | Deliverability, relevance |
| Cold email, unverified list | 10–20% open | 1–4% reply | Bounces, spam folder |
| LinkedIn / social | n/a | 10–20% accept-and-reply | Connection limits |
| Warm inbound follow-up | 20–40% per dial | 45–65% | Speed to lead |
Two patterns jump out.
First, the persona sets the ceiling. An enterprise VP will never contact-rate like an SMB owner, no matter how good your reps are. Comparing an enterprise AE's 9% to an SMB SDR's 30% and calling it a performance gap is a management error.
Second, verified data roughly doubles cold email reply rates and roughly triples enterprise phone contact rates, because most of the gap between a good and bad list is simply whether the number rings a real person's pocket. HubSpot's ongoing sales statistics roundup has tracked the same theme for years: activity volume plateaus quickly, while data quality keeps paying.
Also worth checking: Salesforce's State of Sales research consistently finds reps spend under a third of their time actually selling. A meaningful slice of the rest is chasing contact records that were never going to connect.
How Do You Calculate Contact Rate Step by Step?#
Work through a real month. Say your team ran a 21-day cadence against 500 accounts, 2 personas each, so 1,000 prospects.
Step 1 — Establish the true attempted population. Deduplicate. If two reps sequenced the same person, that's one prospect. Say 1,000 records collapse to 940 unique humans.
Step 2 — Subtract the unreachable. Run the list through verification before the cadence, not after. Suppose 118 emails come back invalid or risky and 96 phone numbers are disconnected or wrong-person. Your reachable population might be 780. Track this — the gap between 940 and 780 is your data tax, and it's a number your ops lead should be accountable for.
Step 3 — Count real contacts. Only two-way human interactions. Say 87 prospects had a live conversation or sent a genuine reply. Out-of-office autoresponders are not replies. "Please remove me" is a contact — an unpleasant one, but a human answered.
Step 4 — Run both versions of the formula.
- Per-prospect:
(87 ÷ 940) × 100 = 9.3% - Per-reachable:
(87 ÷ 780) × 100 = 11.2%
Step 5 — Read the spread. The 1.9-point gap is entirely data. If you eliminated the bad records — replaced them with verified ones rather than just deleting them — you'd add roughly 15–18 conversations for zero extra rep effort. That's usually the cheapest incremental pipeline available to a B2B team, and it's why an email verifier pass belongs in the pre-cadence workflow rather than the post-mortem.
Step 6 — Segment before you conclude anything. A blended 9.3% hides everything. Split by persona, by channel, by data source, and by rep. You will almost always find one segment dragging the average — a scraped list, a persona with no direct dials, a rep who only calls at 4pm on Fridays.
Is Contact Rate the Same as Connect Rate or Response Rate?#
No, and conflating them is the second most expensive mistake after the denominator problem.
- Contact rate — Did a human engage with us? (Two-way.)
- Connect rate — Did the line pick up? (Includes gatekeepers, wrong parties, and IVRs. Dialers report this by default.)
- Answer rate — Did the call not go to voicemail? (Purely mechanical.)
- Reach rate — Did the message get delivered at all? (Deliverability, not engagement.)
- Response rate — Of those contacted, how many replied with intent? (Downstream of contact rate.)
Contact rate sits between reach and response. It's the hinge in the funnel: everything before it is a data-and-infrastructure problem, everything after it is a messaging-and-qualification problem. When contact rate is low, buying a better sequence template is the wrong purchase. When response rate is low while contact rate is healthy, your copy is the problem and no amount of extra data spend will save you.
This distinction also determines who owns the fix. Low contact rate → RevOps and data. Low response rate → enablement and copy. Low meeting rate on strong responses → qualification and calendar friction. Teams that skip this triage tend to throw every remedy at every problem and learn nothing.
What Actually Moves the Contact Rate Formula?#
Ranked by impact per dollar, based on what consistently shows up in G2 reviews and vendor benchmarks across sales intelligence tools:
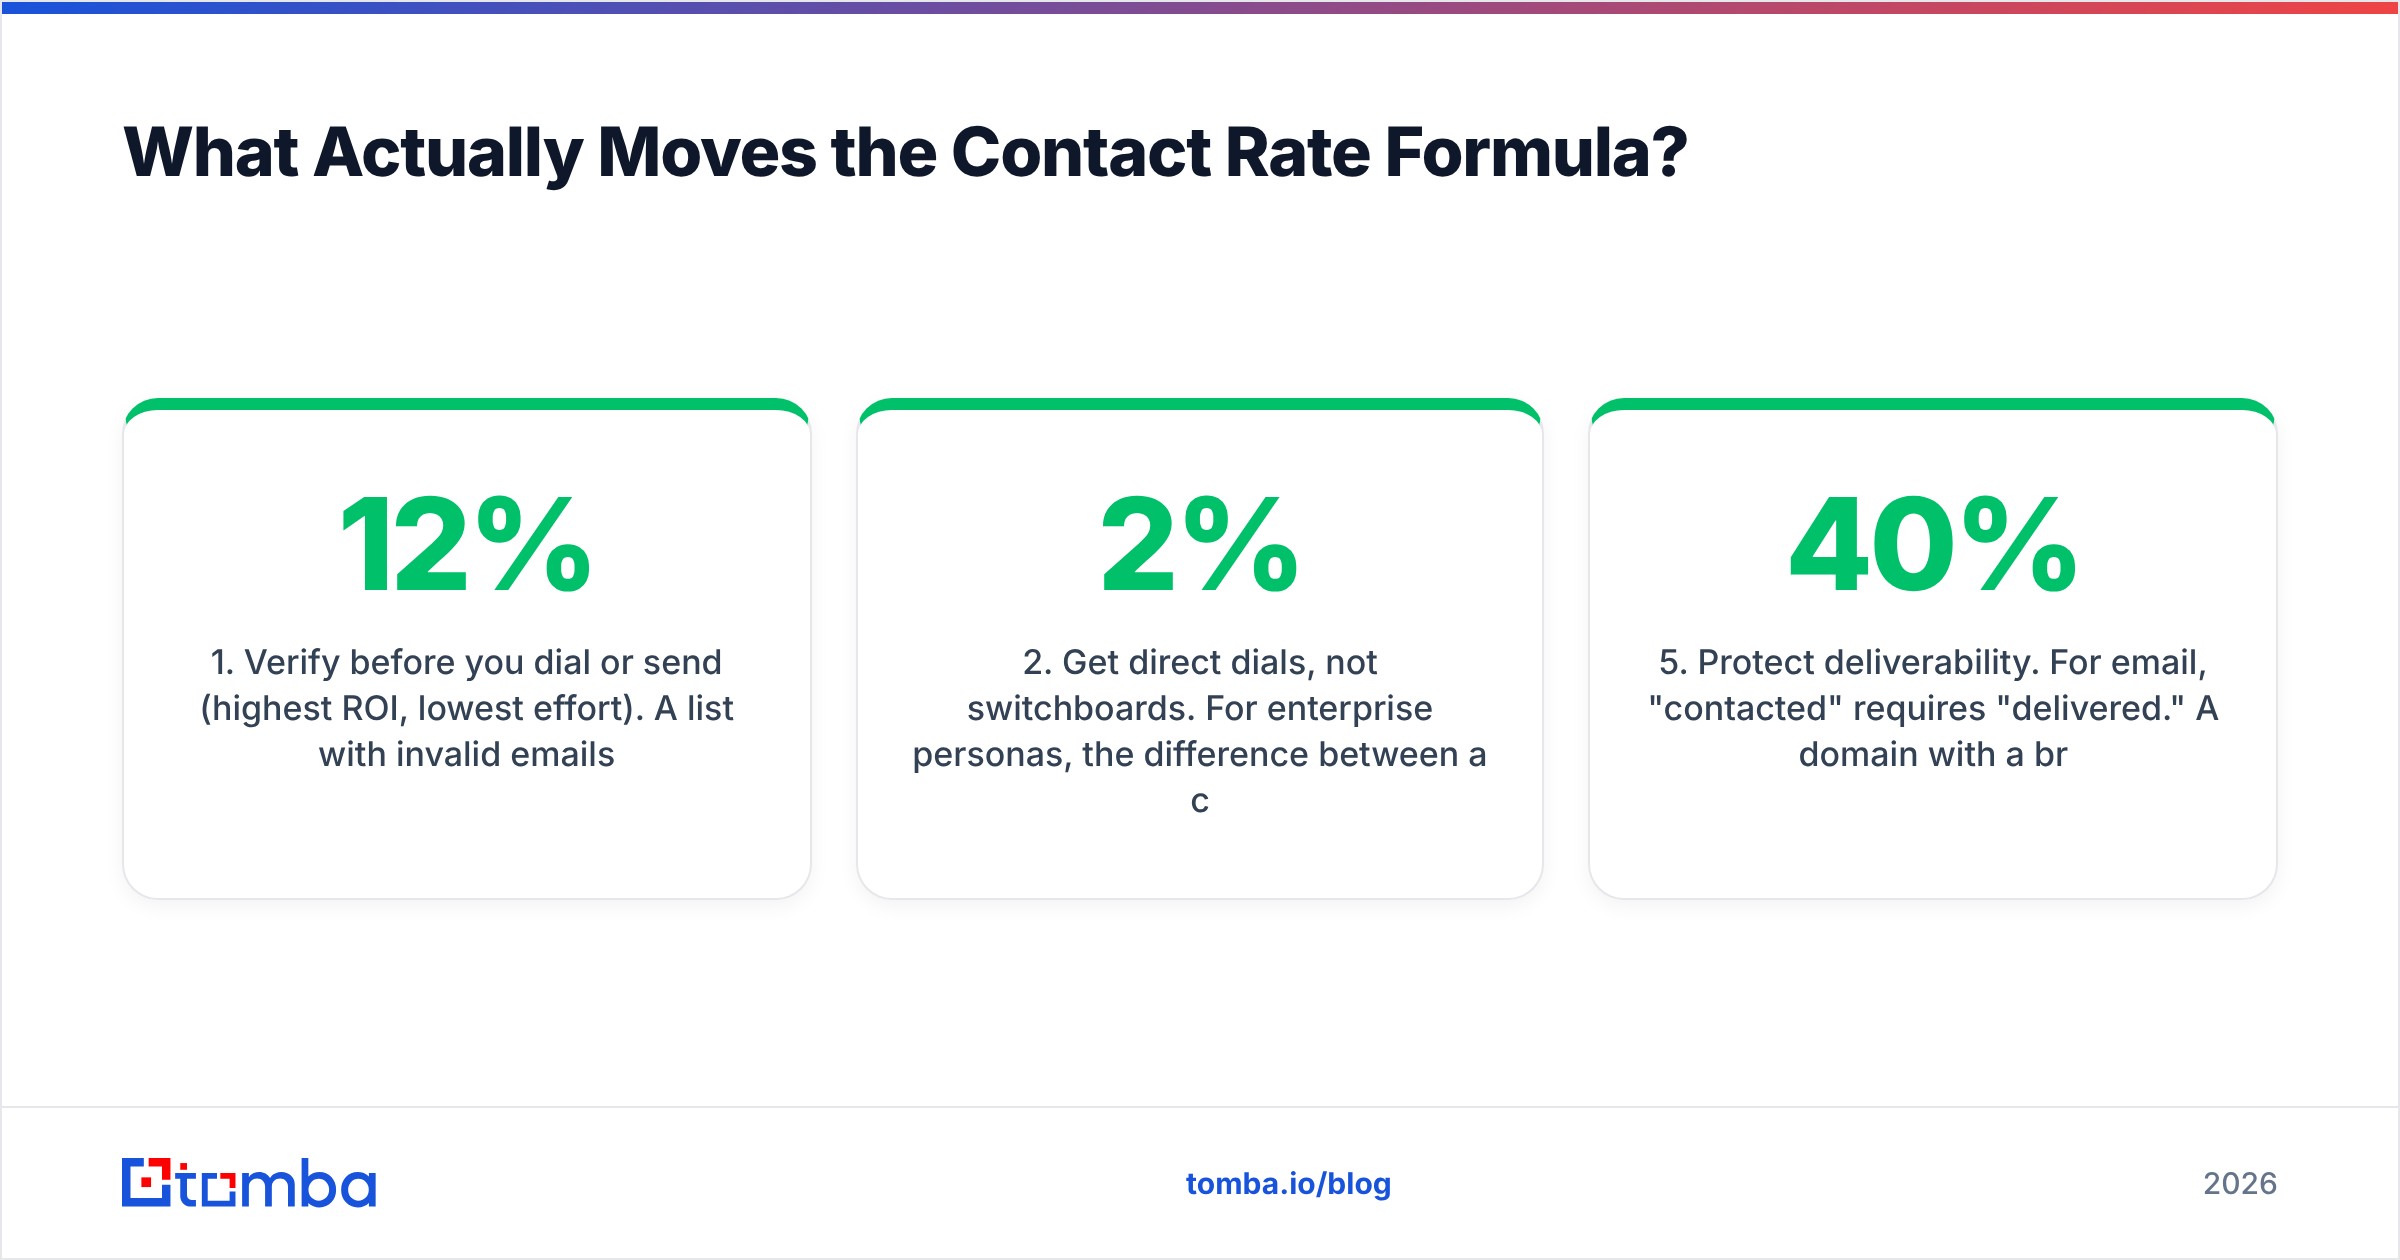
1. Verify before you dial or send (highest ROI, lowest effort). A list with 12% invalid emails and 10% dead numbers caps your contact rate at ~78% of its potential no matter what. Verification is a pre-flight check, not a cleanup. Running a bulk verification pass on a 5,000-row list costs a fraction of the rep hours it saves.
2. Get direct dials, not switchboards. For enterprise personas, the difference between a company main line and a mobile is the difference between a 2% and an 11% contact rate. If your data provider gives you HQ numbers and calls them "phone numbers," your contact rate is structurally capped. This is where a dedicated phone finder earns its keep.
3. Fix the cadence shape, not the cadence length. Six touches spread across 21 days at varied times of day beats twelve touches crammed into a week. Same-time-every-day dialing means you only ever catch the prospects whose calendars are free at that hour.
4. Enrich for role changes. Roughly a fifth of B2B contact records go stale per year as people change jobs. A prospect who left the company two months ago is a guaranteed zero, and they're sitting in your denominator dragging the number down. Periodic data enrichment against your existing CRM is cheaper than sourcing net-new.
5. Protect deliverability. For email, "contacted" requires "delivered." A domain with a broken SPF record or a burned sending reputation can post a 40% apparent send rate and a 4% real inbox rate. Check the plumbing before blaming the pitch.
6. Then coach the reps. Openers, tone, objection handling, voicemail strategy. This matters — but it's the sixth lever, not the first, and treating it as the first is how teams burn a quarter.
How Should You Report Contact Rate to Leadership?#
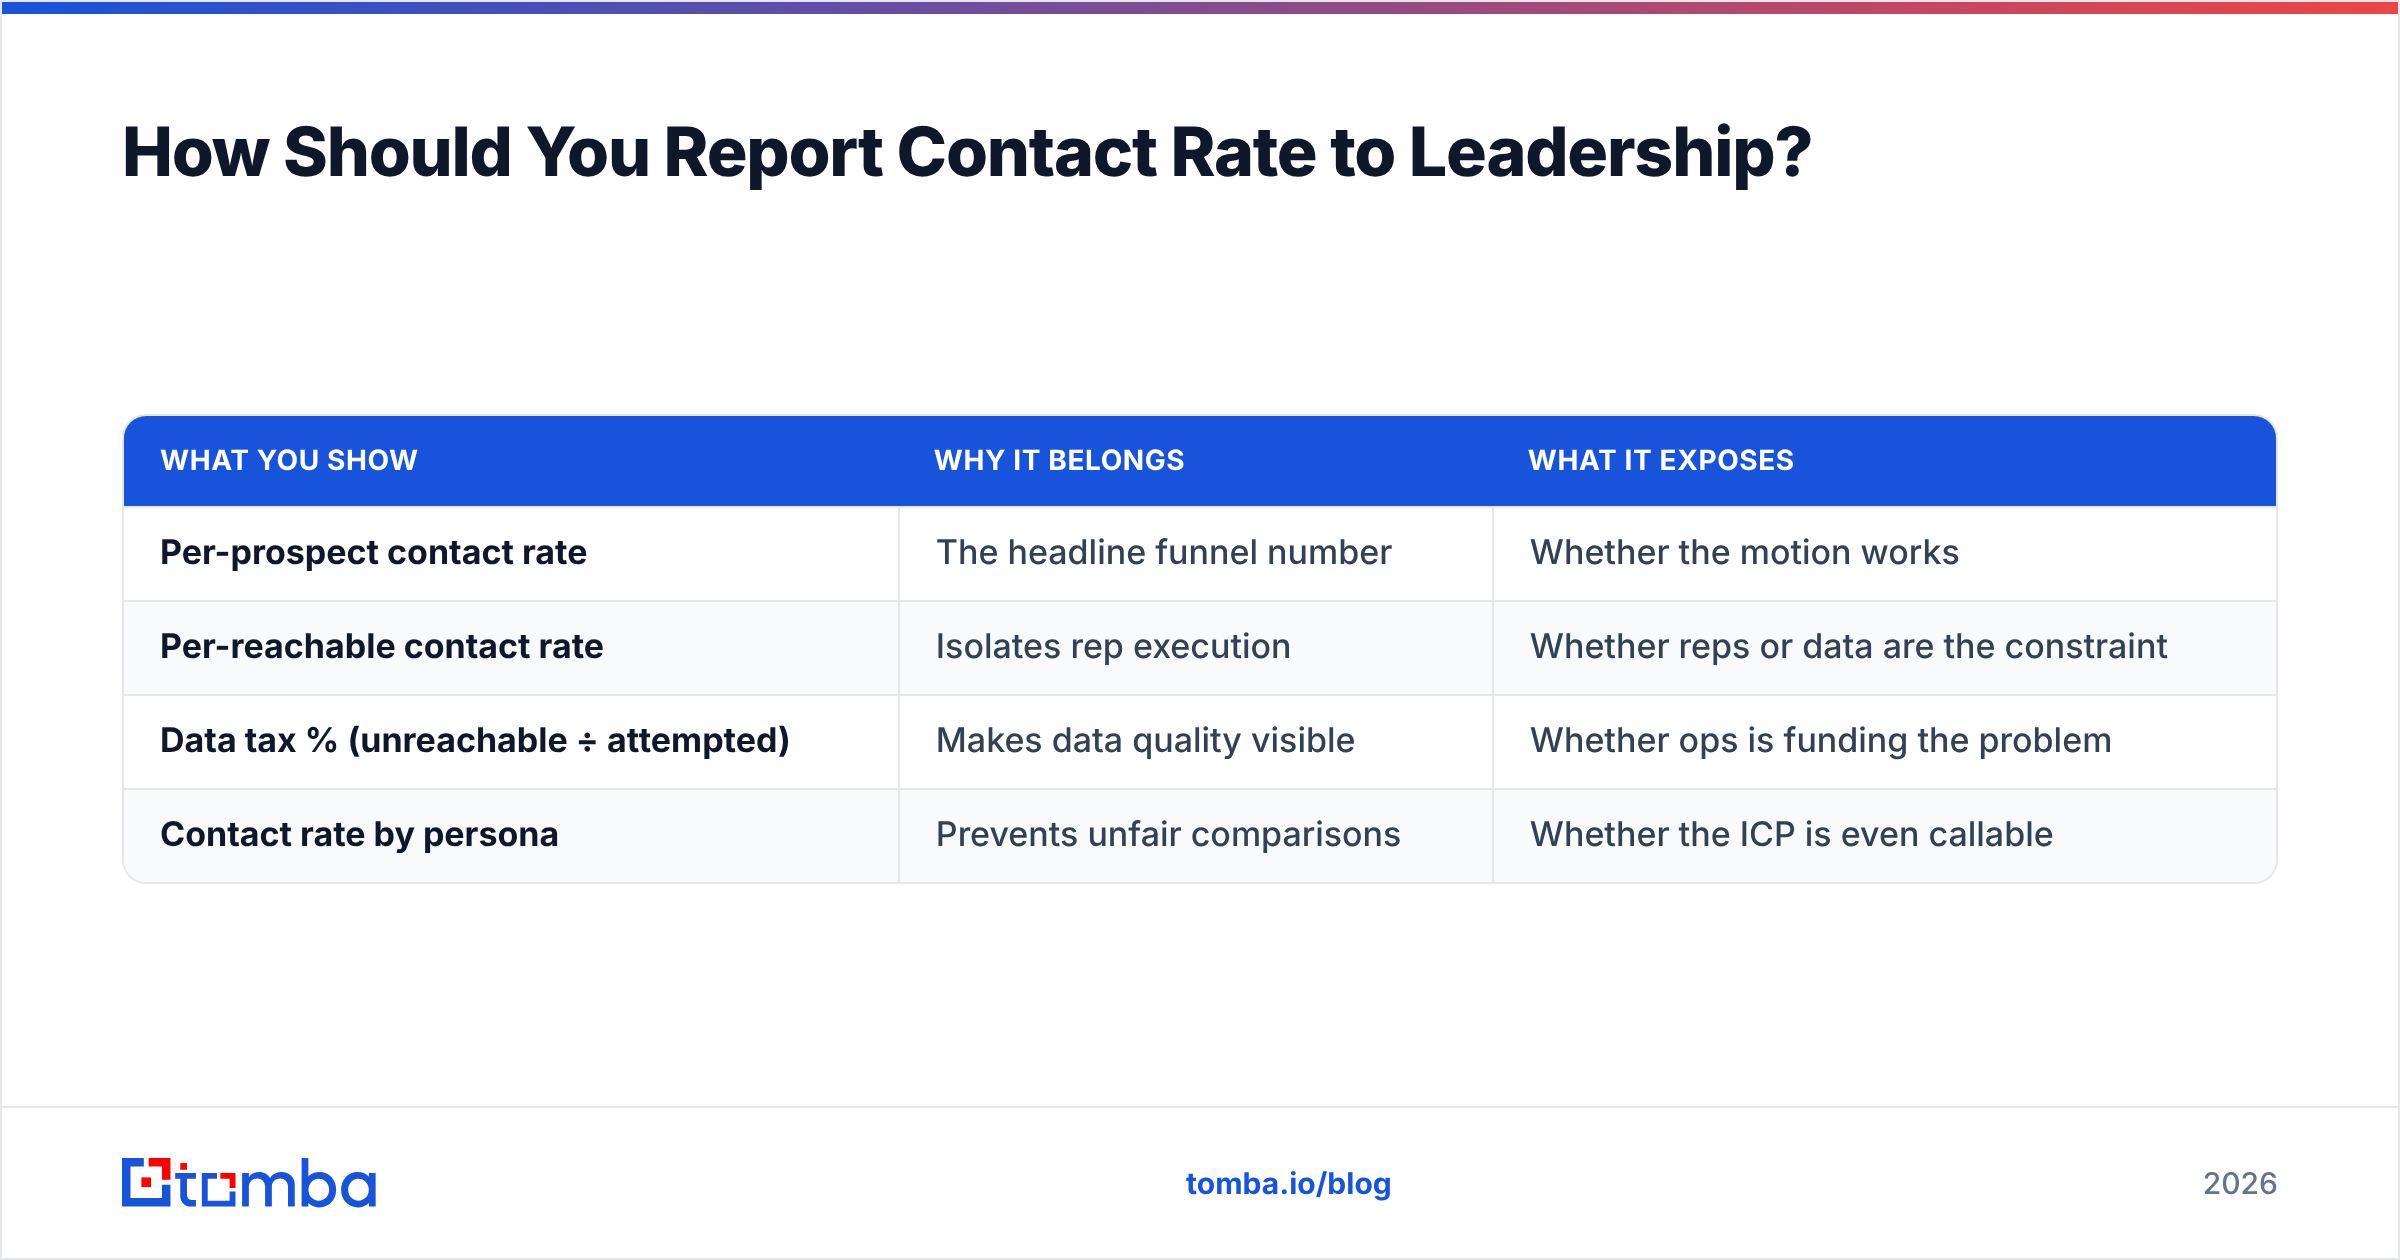
Report three numbers together, never one:
| What you show | Why it belongs | What it exposes |
|---|---|---|
| Per-prospect contact rate | The headline funnel number | Whether the motion works |
| Per-reachable contact rate | Isolates rep execution | Whether reps or data are the constraint |
| Data tax % (unreachable ÷ attempted) | Makes data quality visible | Whether ops is funding the problem |
| Contact rate by persona | Prevents unfair comparisons | Whether the ICP is even callable |
The data tax line is the one most teams have never seen, and it's the one that changes budget conversations. When a VP sees that 17% of the list was never going to connect, the "hire two more SDRs" conversation turns into a "buy better data" conversation — which is usually an order of magnitude cheaper per incremental meeting.
Set a review cadence of every two weeks, not monthly. Contact rate degrades slowly and continuously as records age; monthly reporting lets a decaying list hide behind one strong week.
One caution: do not set contact rate as a rep quota in isolation. Reps optimize what you measure, and the easiest way to raise a contact rate is to stop attempting hard prospects. Pair it with absolute conversation counts so nobody wins by shrinking their denominator.
What's the Fastest Way to Raise Contact Rate This Quarter?#
Do this in order, and don't skip ahead:
- Week 1 — Rewrite the definition. Unique prospects, defined window, two-way human contact only. Republish the dashboard.
- Week 1 — Verify the entire active list. Quantify the data tax. This one number will justify everything that follows.
- Week 2 — Replace, don't just delete. Every invalid record you remove should be re-sourced with a verified email and, where the persona warrants it, a direct dial.
- Weeks 3–4 — Vary the cadence timing. Same touches, different hours and days. Measure per-persona.
- Weeks 5–8 — Now coach. With clean data and a shaped cadence, rep-level differences are finally signal rather than noise.
Teams that run this sequence typically see per-prospect contact rate move several points — not because anyone worked harder, but because a meaningful share of their attempts were previously landing in a void.
The Bottom Line#
The contact rate formula is trivial. The discipline around it is not. Fix the denominator so the number is honest, split reachable from unreachable so you know who to hold accountable, and treat data quality as the first lever rather than the last resort. A team that reports per-dial contact rate and coaches on tone is optimizing the loudest variable instead of the largest one.
Start with the data tax. If you don't know what percentage of your list was never contactable, you don't know what your contact rate means.
Ready to shrink the unreachable slice of your denominator? The Tomba Email Finder surfaces verified professional emails by domain, name, or company so your cadence starts against real inboxes instead of guesses — with a free tier covering 25 searches a month and paid plans from $49/mo. Check Tomba pricing to size it against the number of prospects you're currently attempting and failing to reach.
Related guides#
Ready to find emails that actually work?
Join 150,000+ professionals who stopped guessing and started sending. Free credits on signup — no credit card required.
Get the Tomba newsletter
Practical outbound tactics and product updates — once every two weeks.
About the author