Conversion Rate Lead Generation: A 2026 Playbook for B2B Teams
Most lead gen benchmarks flatter broken funnels. Here are the real conversion rates by channel in 2026, where the leaks actually happen, and the fixes that move revenue instead of vanity metrics.
TL;DR
- "Conversion rate" in lead generation is at least five different numbers. If your team argues about one figure, you are probably measuring five things and averaging them into nonsense.
- Median B2B visitor-to-lead conversion sits around 2-3%; lead-to-MQL around 25-35%; MQL-to-SQL around 13-20%. Anything wildly above that usually means loose definitions, not genius marketing.
- The biggest single lever is not copy, colour, or CTA placement. It is list quality upstream — bad contact data silently taxes every downstream stage.
- Bounce rates above 3% start dragging deliverability, which suppresses replies, which looks like a "conversion problem" but is actually a data problem.
- Fix the funnel in this order: data accuracy → targeting → offer → message → mechanics. Most teams do it in reverse and wonder why the A/B tests never compound.
What does "conversion rate" actually mean in lead generation?#
It means whatever the person saying it decided it means, which is exactly the problem.
Think of your funnel like a set of nested sieves. Each sieve has its own mesh, and each one throws away a different fraction of what you pour in. Calling the whole stack "the conversion rate" is like describing a five-course meal by its total calorie count — technically true, operationally useless.
Here are the five rates that actually matter, and what each one tells you:
- Visitor-to-lead — the percentage of site or landing-page traffic that submits an identifiable contact. This measures your offer and your targeting, not your sales team.
- Lead-to-MQL — the share of raw leads that clear your scoring bar. A marketing qualified lead that no one has defined precisely is just a lead with better PR.
- MQL-to-SQL — the share sales actually accepts. This is your single best early-warning signal for targeting drift. When it slides, your ICP definition has quietly rotted.
- Contact-to-reply (outbound) — for cold outreach, the percentage of deliverable contacts that respond. This one is hostage to data accuracy in a way inbound rates are not.
- SQL-to-closed-won — the win rate. Everything upstream exists to feed this, and everything upstream can be gamed to make this look worse or better than it is.
If you only track the first and the last, you have no idea where the leak is. You just know water is missing.
What are realistic conversion rate benchmarks in 2026?#
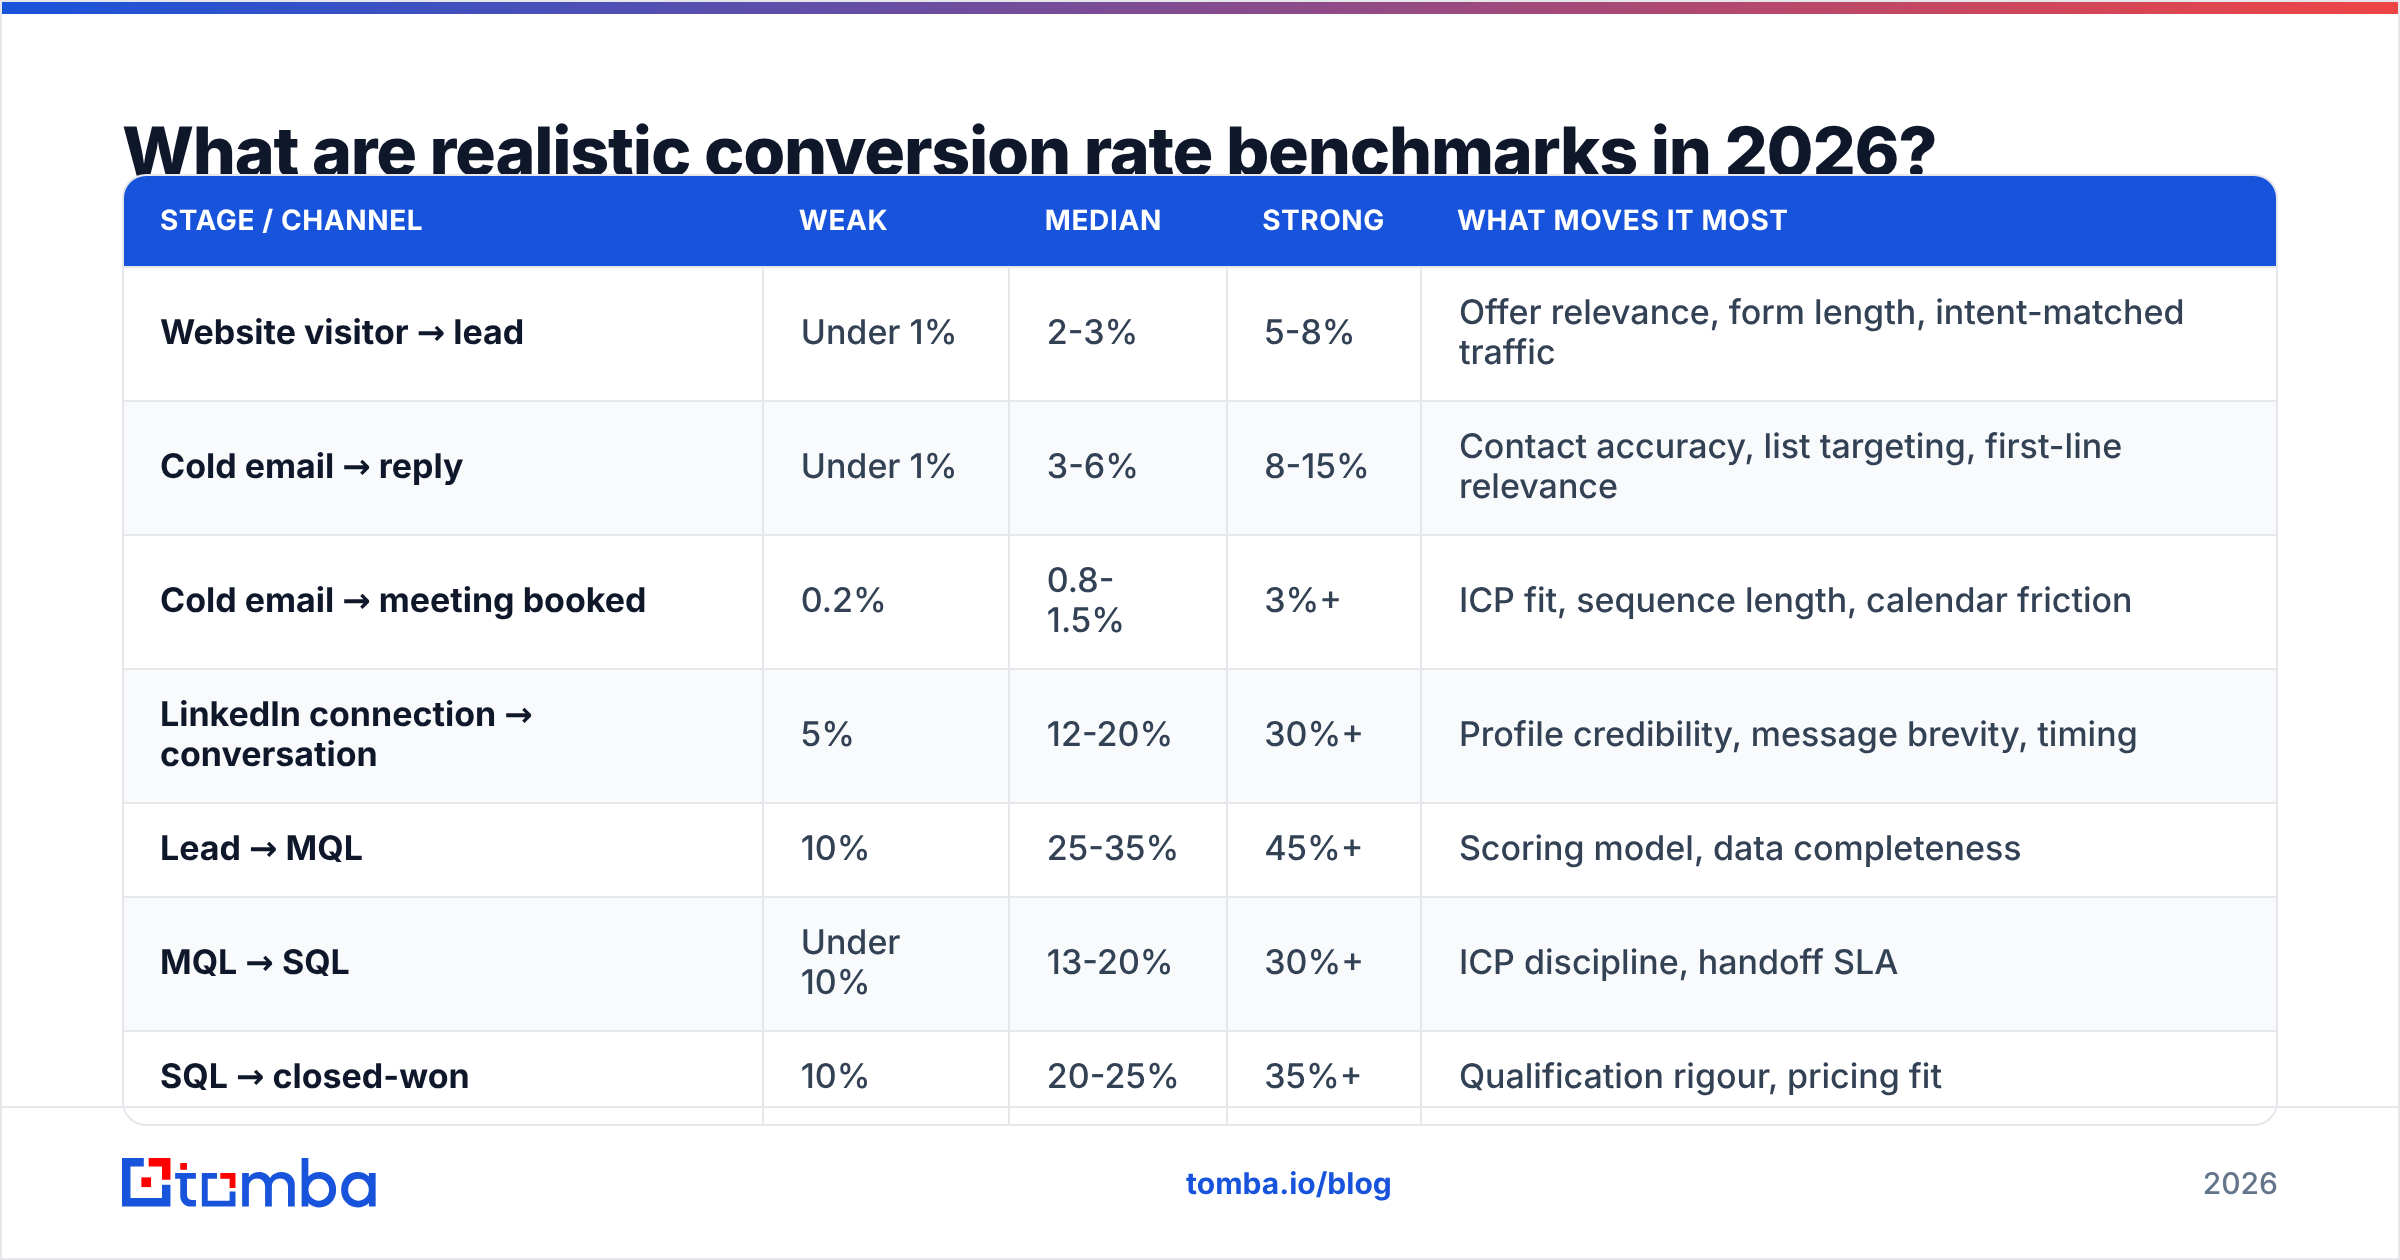
Below are the ranges most B2B teams land in once you strip out the self-reported case-study inflation. Use them as guardrails, not targets — your ceiling is set by your ACV, your category maturity, and how narrow your ICP is.
| Stage / channel | Weak | Median | Strong | What moves it most |
|---|---|---|---|---|
| Website visitor → lead | Under 1% | 2-3% | 5-8% | Offer relevance, form length, intent-matched traffic |
| Cold email → reply | Under 1% | 3-6% | 8-15% | Contact accuracy, list targeting, first-line relevance |
| Cold email → meeting booked | 0.2% | 0.8-1.5% | 3%+ | ICP fit, sequence length, calendar friction |
| LinkedIn connection → conversation | 5% | 12-20% | 30%+ | Profile credibility, message brevity, timing |
| Lead → MQL | 10% | 25-35% | 45%+ | Scoring model, data completeness |
| MQL → SQL | Under 10% | 13-20% | 30%+ | ICP discipline, handoff SLA |
| SQL → closed-won | 10% | 20-25% | 35%+ | Qualification rigour, pricing fit |
| Paid search → demo request | 0.5% | 1.5-3% | 6%+ | Keyword intent, landing-page match |
Two things jump out of that table.
First, the spread between "weak" and "strong" is rarely one clever tweak. A team hitting 8% visitor-to-lead is almost never running the same traffic as a team hitting 1%. They fixed the input, not the button.
Second, the outbound rows are the ones with the widest multiple between weak and strong — often 10x or more. That is where the leverage is, and it is also where data quality lives. HubSpot's marketing statistics and analyst coverage from Gartner's sales research both keep landing on the same uncomfortable conclusion: buyers are harder to reach, so the cost of reaching the wrong one has gone up.
Why is bad contact data the hidden conversion killer?#
Because it taxes every stage at once, and it never shows up on the dashboard as "bad data." It shows up as "our messaging isn't landing."
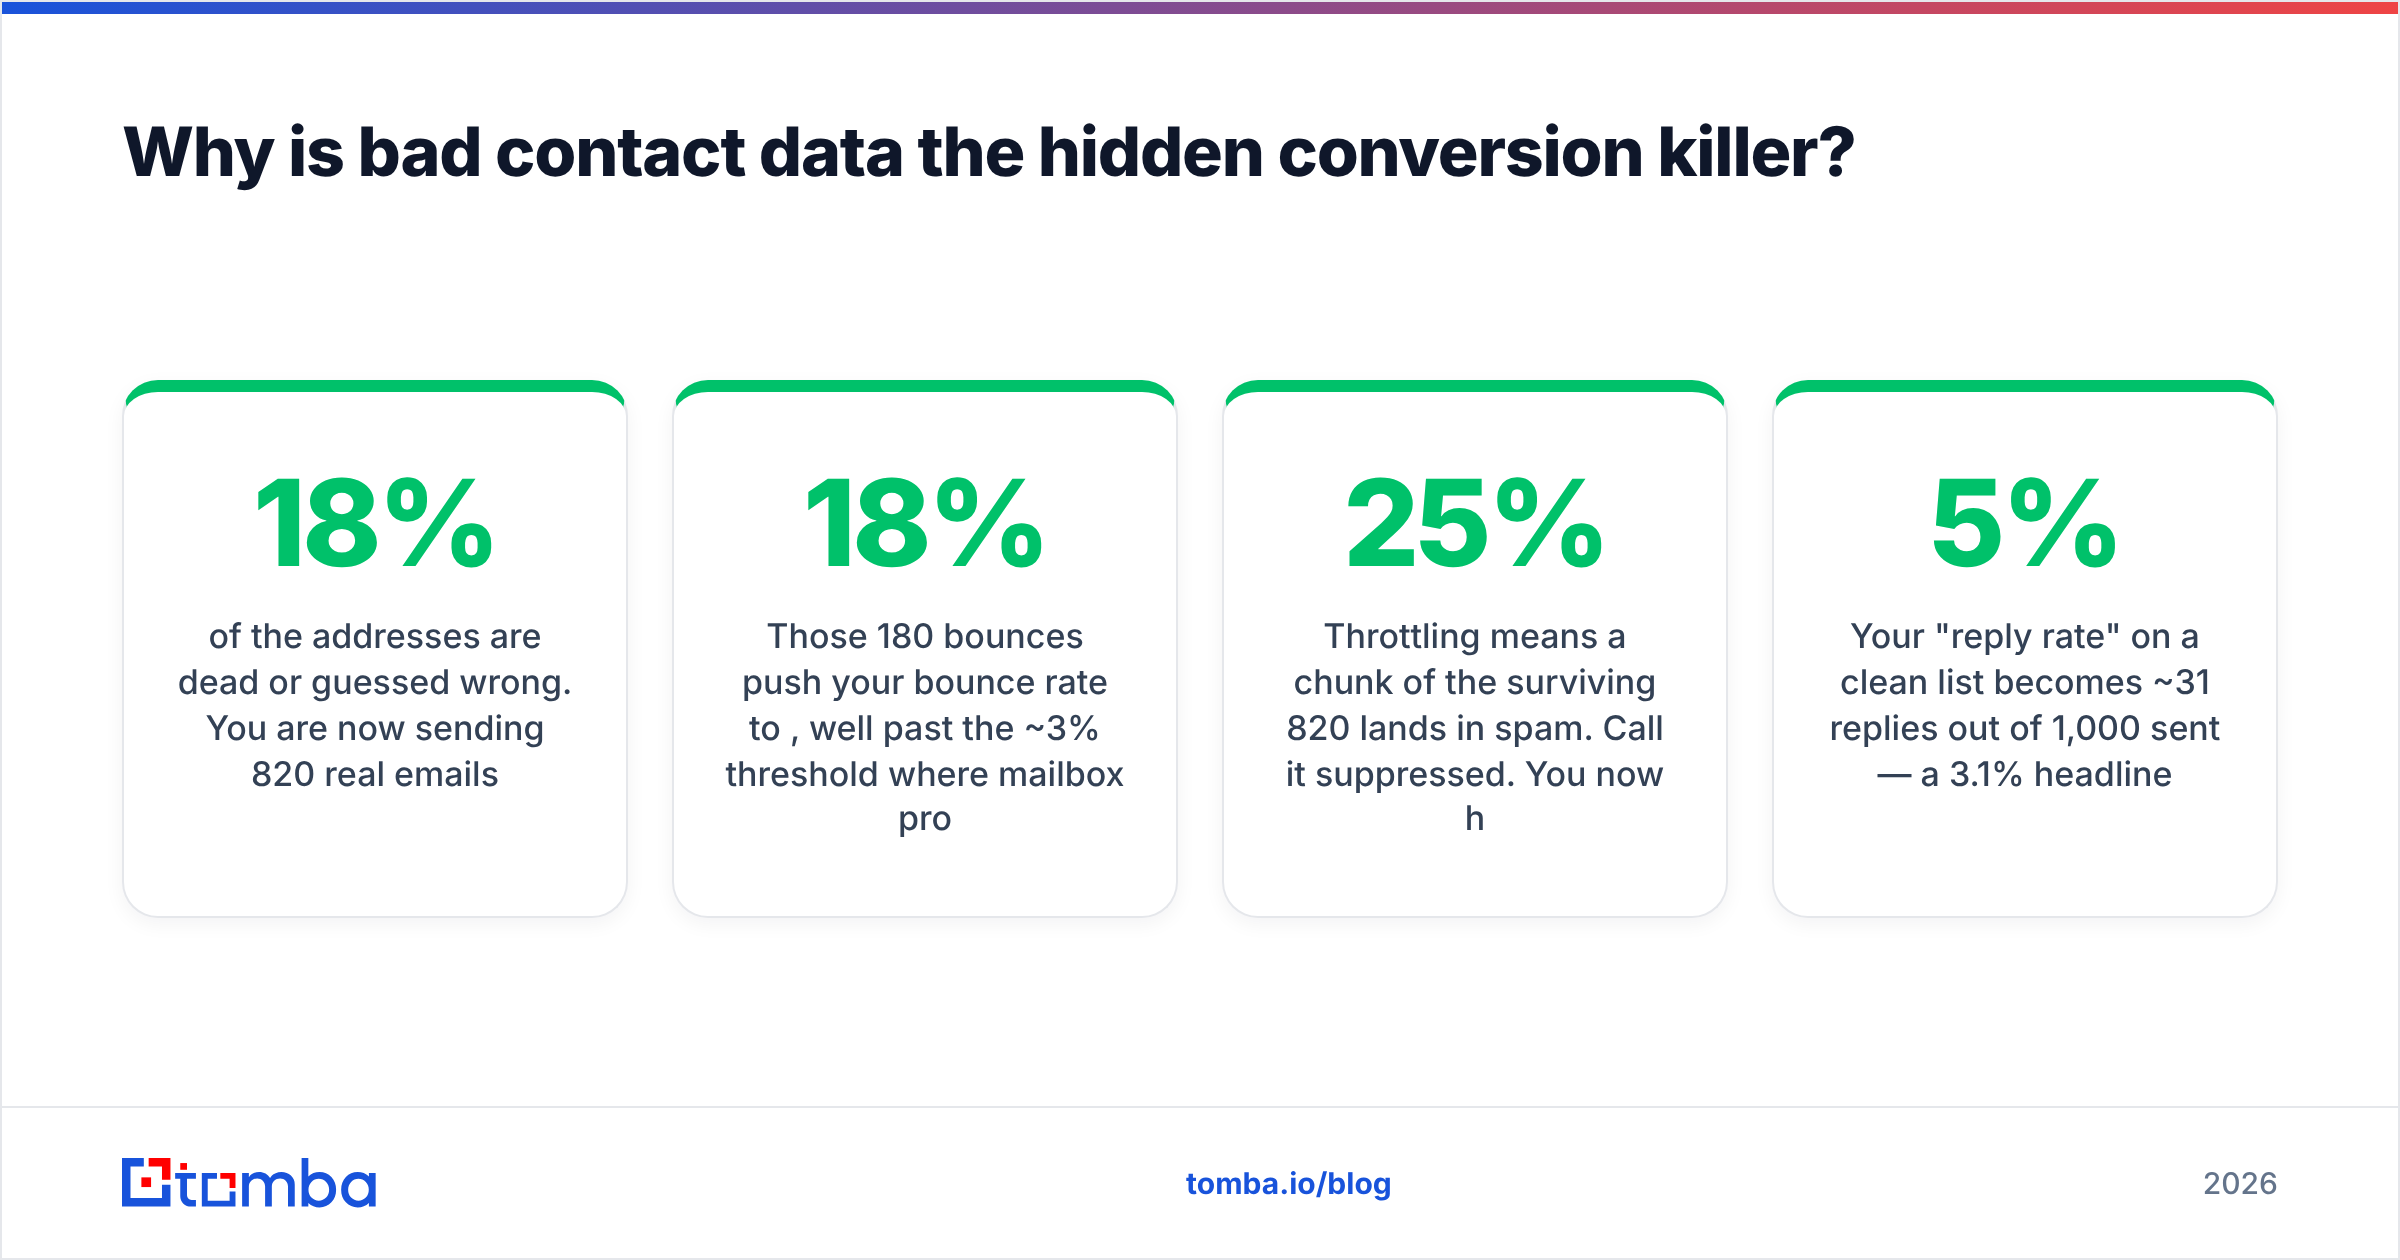
Run the arithmetic. Say you send 1,000 cold emails from a list you scraped and never verified.
- 18% of the addresses are dead or guessed wrong. You are now sending 820 real emails.
- Those 180 bounces push your bounce rate to 18%, well past the ~3% threshold where mailbox providers start throttling you.
- Throttling means a chunk of the surviving 820 lands in spam. Call it 25% suppressed. You now have ~615 emails actually seen.
- Your 5% "reply rate" on a clean list becomes ~31 replies out of 1,000 sent — a 3.1% headline rate.
Same copy. Same offer. Same sender. A 38% reduction in output, and every dashboard in the company blames the email.
Now flip it. Verify the list first, drop the invalids, and you send 850 confirmed-deliverable emails with a bounce rate under 2%. Reputation holds. Inbox placement holds. You get roughly 42 replies from a smaller send — and your cost per reply drops by a third while your domain stays healthy.
This is why an email verifier is not a nice-to-have hygiene step at the end of the process. It is a conversion lever at the front of it. The same goes for the catch-all problem: domains that accept everything and confirm nothing will quietly inflate your "valid" count until a catch-all verifier tells you which ones are actually safe to send to.
Which lead generation channels convert best — and at what cost?#
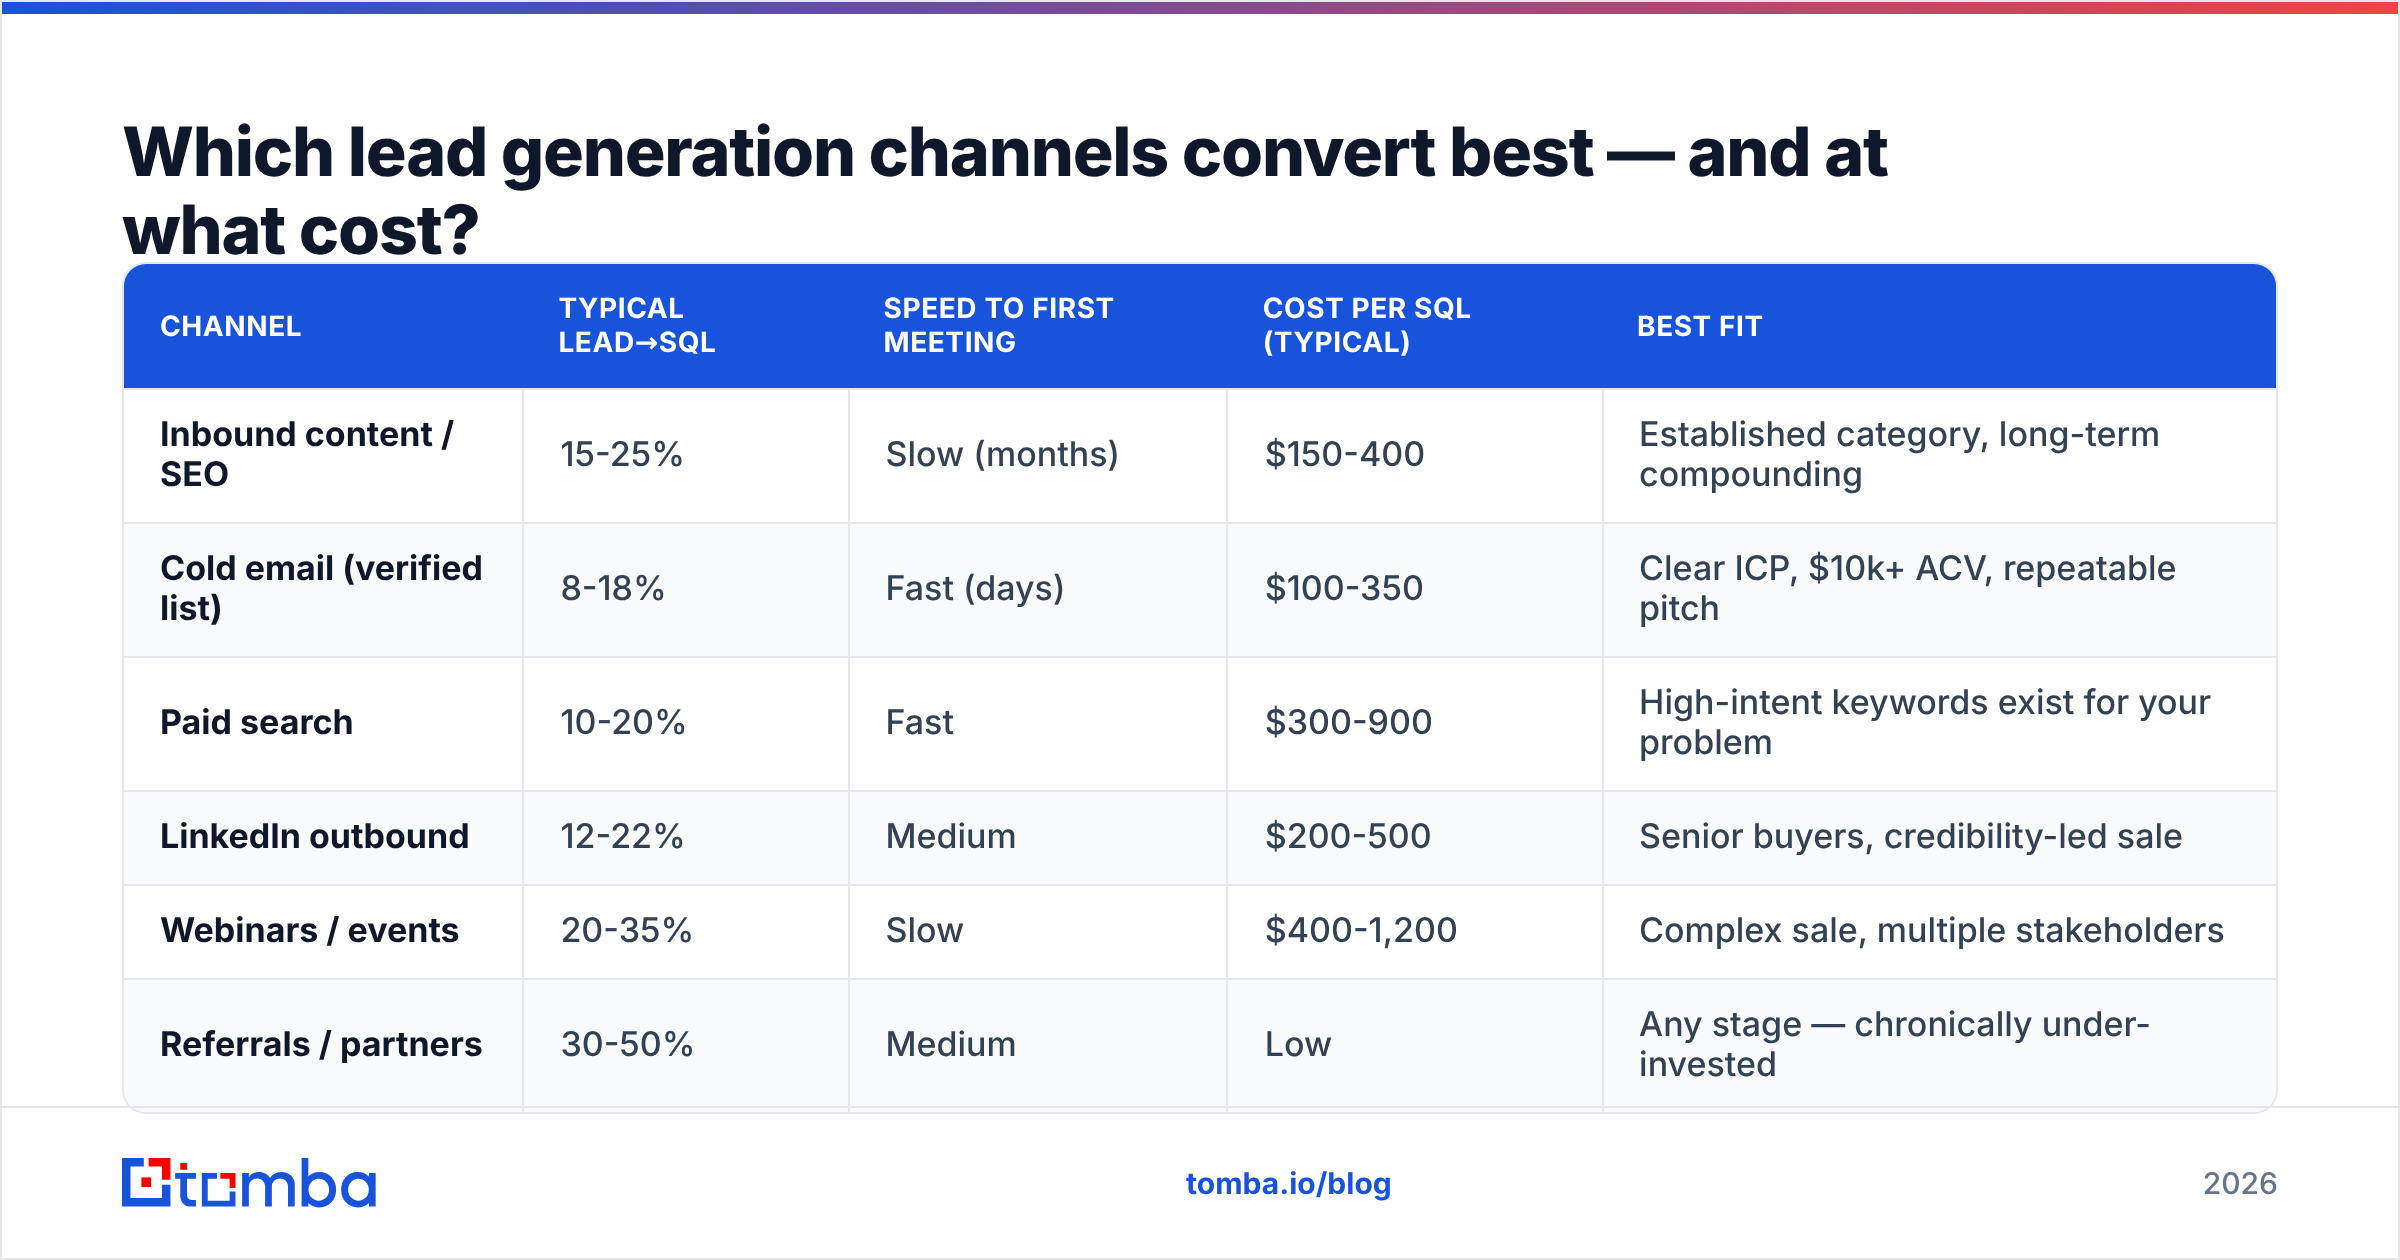
There is no universal winner. There is only the channel that best matches your ACV and your sales cycle. A $500/year product cannot afford a channel with a $400 cost per SQL; a $80k ACV product cannot afford to ignore one.
| Channel | Typical lead→SQL | Speed to first meeting | Cost per SQL (typical) | Best fit |
|---|---|---|---|---|
| Inbound content / SEO | 15-25% | Slow (months) | $150-400 | Established category, long-term compounding |
| Cold email (verified list) | 8-18% | Fast (days) | $100-350 | Clear ICP, $10k+ ACV, repeatable pitch |
| Paid search | 10-20% | Fast | $300-900 | High-intent keywords exist for your problem |
| LinkedIn outbound | 12-22% | Medium | $200-500 | Senior buyers, credibility-led sale |
| Webinars / events | 20-35% | Slow | $400-1,200 | Complex sale, multiple stakeholders |
| Referrals / partners | 30-50% | Medium | Low | Any stage — chronically under-invested |
Two honest observations here.
Referrals win on every metric and almost nobody systematises them. If you want a fast conversion-rate win this quarter, build a referral motion before you build another sequence.
And cold email keeps performing well only on the condition in brackets: verified list. Unverified, it is the worst-converting channel on the table, and it damages the domain you need for everything else.
How do you actually diagnose where your funnel is leaking?#
Work backwards from the money, not forwards from the traffic. Here is the sequence that finds the leak fastest:
- Compare each stage to the benchmark table above. The stage furthest below median is your leak. Not the stage with the lowest absolute number — the stage with the biggest gap. Every funnel has a low absolute number at the bottom; that is what a funnel is.
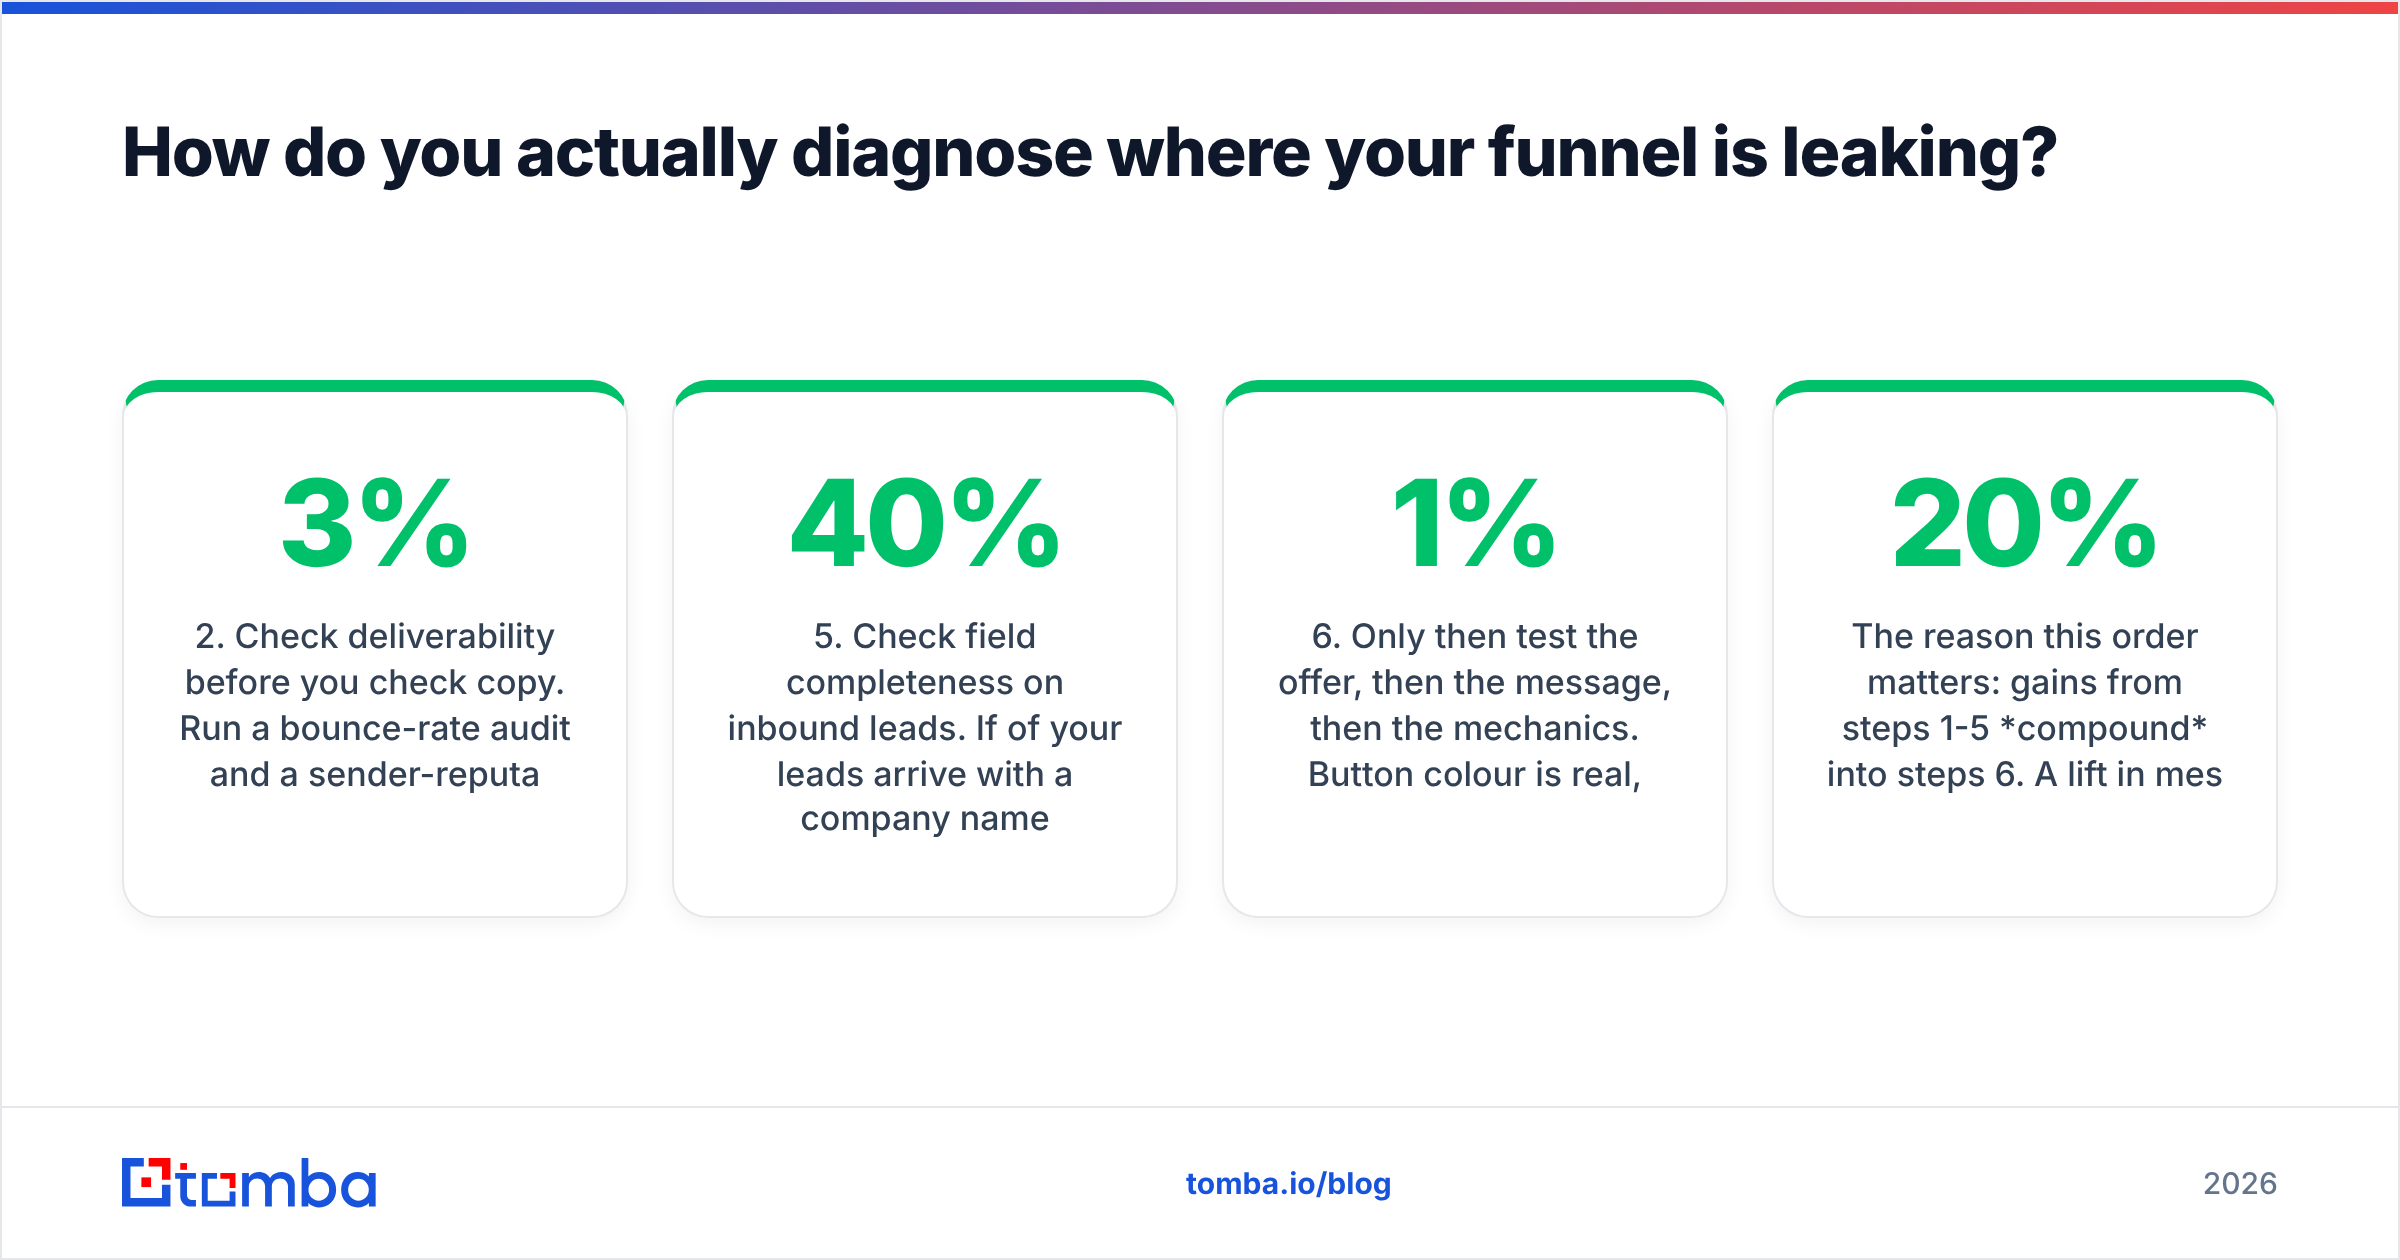
- Check deliverability before you check copy. Run a bounce-rate audit and a sender-reputation check. If bounce is above 3% or spam placement is above 10%, stop testing subject lines. You are optimising a message nobody sees. Fixing email deliverability comes first.
- Audit ICP fit on the last 50 rejected leads. If sales rejected them for "not a fit" rather than "bad timing," your problem is targeting, not conversion. No sequence rescues a list of the wrong people.
- Measure time-to-first-touch. Leads contacted within five minutes convert several times better than leads contacted the next day. This is a plumbing fix, not a strategy fix, and it is usually free.
- Check field completeness on inbound leads. If 40% of your leads arrive with a company name and nothing else, your scoring model is guessing. Data enrichment at the point of capture fixes this without adding form fields — which is the trade everyone gets backwards.
- Only then test the offer, then the message, then the mechanics. Button colour is real, measurable, and worth roughly 1% of what the five steps above are worth.
The reason this order matters: gains from steps 1-5 compound into steps 6. A 20% lift in message quality applied to a 40%-invalid list produces almost nothing. The same lift applied to a clean, well-targeted list produces a real number.
Should you optimise for more leads or better leads?#
Better leads, in almost every case — because volume degrades conversion rate non-linearly.
Here is the analogy. Widening your targeting is like widening a funnel's mouth without widening its neck. You pour in more, but the neck is your sales team's capacity, and it does not scale with your list size. What actually happens is that reps spend the same hours on a worse-fit population, response rate drops, morale drops, and your MQL-to-SQL rate craters — at which point someone proposes generating more leads to compensate.
Concretely, a team sending 5,000 emails a month to a loosely-defined list at a 0.6% meeting rate books 30 meetings. A team sending 1,200 emails to a tightly-defined, verified list at 3% books 36 meetings — with a quarter of the send volume, a healthier domain, and better meetings. The second team also has room to grow. The first team's only lever is to send more, which makes deliverability worse, which makes the rate worse.
Volume is the lever you pull after the rate is healthy, never before. As the classic conversion rate optimization literature keeps pointing out, optimising a broken system just gets you to failure faster.
What should you fix first, this week?#
If you have five working days and want the biggest measurable move:
- Day 1 — Verify your entire active outbound list. Delete everything that fails. Yes, it will feel like throwing away money. You are throwing away a liability.
- Day 2 — Rewrite your ICP as a filter, not a description. "Companies that do X and have Y" beats "innovative mid-market firms."
- Day 3 — Rebuild one segment of your list against that filter, sourced properly rather than scraped. A bulk email finder pointed at a clean company list beats any scraper output.
- Day 4 — Fix time-to-first-touch. Route new inbound leads to a rep inside five minutes.
- Day 5 — Set up stage-by-stage tracking so you never have to guess where the leak is again.
Nothing in that list is clever. All of it is unglamorous. That is why it works, and why it is still sitting undone in most funnels.
Where does Tomba fit?#
Everything above rests on one assumption: that the contact record you are working from is real. If it is not, the strategy is theatre.
The Tomba Email Finder exists for exactly that first step — turning a company and a name into a verified, deliverable professional email, so your outbound conversion rate reflects your message rather than your bounce rate. It sits alongside verification, domain search, catch-all checks, and enrichment, so one list can move from "names in a spreadsheet" to "contacts worth sending to" without leaving the stack. There is a free tier at 25 searches a month to test the accuracy on your own list before you commit; paid plans start at $49/mo on Starter and scale to $99/mo on Growth and $249/mo on Pro, and you can see the full breakdown on the Tomba pricing page.
Clean the input. The rest of the funnel gets easier — and every optimisation you run after that finally compounds.
Related guides#
Ready to find emails that actually work?
Join 150,000+ professionals who stopped guessing and started sending. Free credits on signup — no credit card required.
Get the Tomba newsletter
Practical outbound tactics and product updates — once every two weeks.
About the author