Cost of Selling in 2026: The Complete Formula and Benchmarks
Most B2B teams underestimate their cost of selling by 30-50% because they only count commissions. Here is the full formula, current benchmarks by motion, and the four levers that actually move the number.
TL;DR
- Cost of selling is every dollar you spend to convert a qualified opportunity into closed revenue — salaries, commissions, tooling, data, travel, and the loaded overhead behind them. It is not "commissions plus software."
- Most B2B teams under-report it by 30-50% because they exclude sales engineering, SDR payroll, CRM/data spend, and management time.
- Healthy 2026 benchmarks: 15-25% of revenue for mid-market SaaS, 25-40% for enterprise, and under 12% for product-led motions with a light sales assist.
- The biggest hidden line item is bad data. Reps burn 20-30% of selling hours on research, bounced emails, and wrong-number dials — that is pure cost of selling with zero pipeline attached.
- The fastest lever is not cutting headcount. It is raising the percentage of rep hours that touch a real, reachable buyer.
What is the cost of selling?#
Cost of selling is the total expense required to move revenue from "qualified opportunity" to "signed contract," expressed either in absolute dollars or as a percentage of revenue.
Think of it like the fuel bill on a delivery fleet. You can obsess over the price per gallon (commission rates), but the number that actually kills your margin is how many miles the trucks drive empty. In sales, "driving empty" is a rep spending Tuesday morning guessing at email formats for a prospect who left the company in March.
The formula is simple. The discipline is in what you include:
Cost of Selling % = (Total Sales Costs ÷ Revenue Closed) × 100Where Total Sales Costs includes:
- Direct compensation — base salary, commission, bonuses, and accelerators for AEs, SDRs, and sales engineers.
- Loaded overhead — payroll taxes, benefits, equipment, and the fully-loaded cost of sales management. A rule of thumb: multiply base comp by 1.25-1.4x.
- Sales technology stack — CRM seats, sequencer, dialer, conversation intelligence, contract tooling, and enablement platforms.
- Data and contact acquisition — the B2B database subscriptions, email verifier credits, intent signals, and list-building costs that feed the top of the funnel.
- Selling expenses — travel, events, demo environments, POC engineering time, and legal/security review cycles that only exist because a deal is in play.
- Opportunity cost of wasted hours — not a GAAP line item, but the one that decides whether your ratio is 18% or 34%.
Note what this is not. Cost of selling is a subset of customer acquisition cost, which also absorbs marketing spend, brand, and demand-gen programs. If your CFO hands you a CAC number and calls it cost of selling, you are looking at a blended figure that hides where the leak actually is.
Why does cost of selling matter more in 2026 than it did in 2021?#
Because capital stopped being free and buyers stopped picking up the phone.
Two structural shifts collided. First, growth-at-all-costs financing evaporated, so boards now grade GTM on efficiency ratios — CAC payback, net revenue retention, magic number — not raw bookings. Second, B2B buying committees expanded. Gartner's sales research has consistently found buying groups of six to ten stakeholders in complex purchases, which means more meetings, more security reviews, and more sales-engineering hours per closed dollar. Your cost of selling goes up even when your rep does nothing wrong.
The result: a deal that cost $8,000 to close in 2021 can cost $13,000 today at the same ACV. Teams that never re-baselined their cost of selling are quietly running negative-margin segments and blaming the market.
How do you actually calculate cost of selling?#
Work it in three passes. Each pass gets you closer to a number you can defend in a board meeting.
Pass 1 — Fully loaded sales payroll. Take every person whose job title contains "sales," plus sales ops and sales engineering. Multiply base by 1.3 to load benefits and taxes. Add realized commission (actual paid, not target).
Pass 2 — Non-payroll GTM cost attributable to selling. CRM, sequencer, dialer, data, enablement, travel, events where the primary purpose is pipeline (not brand). Exclude paid media and content — that is marketing CAC.
Pass 3 — Divide by closed-won revenue in the same period, not booked pipeline. Use trailing twelve months if your cycle is longer than a quarter, otherwise seasonality will make the number swing 10 points and you will chase noise.
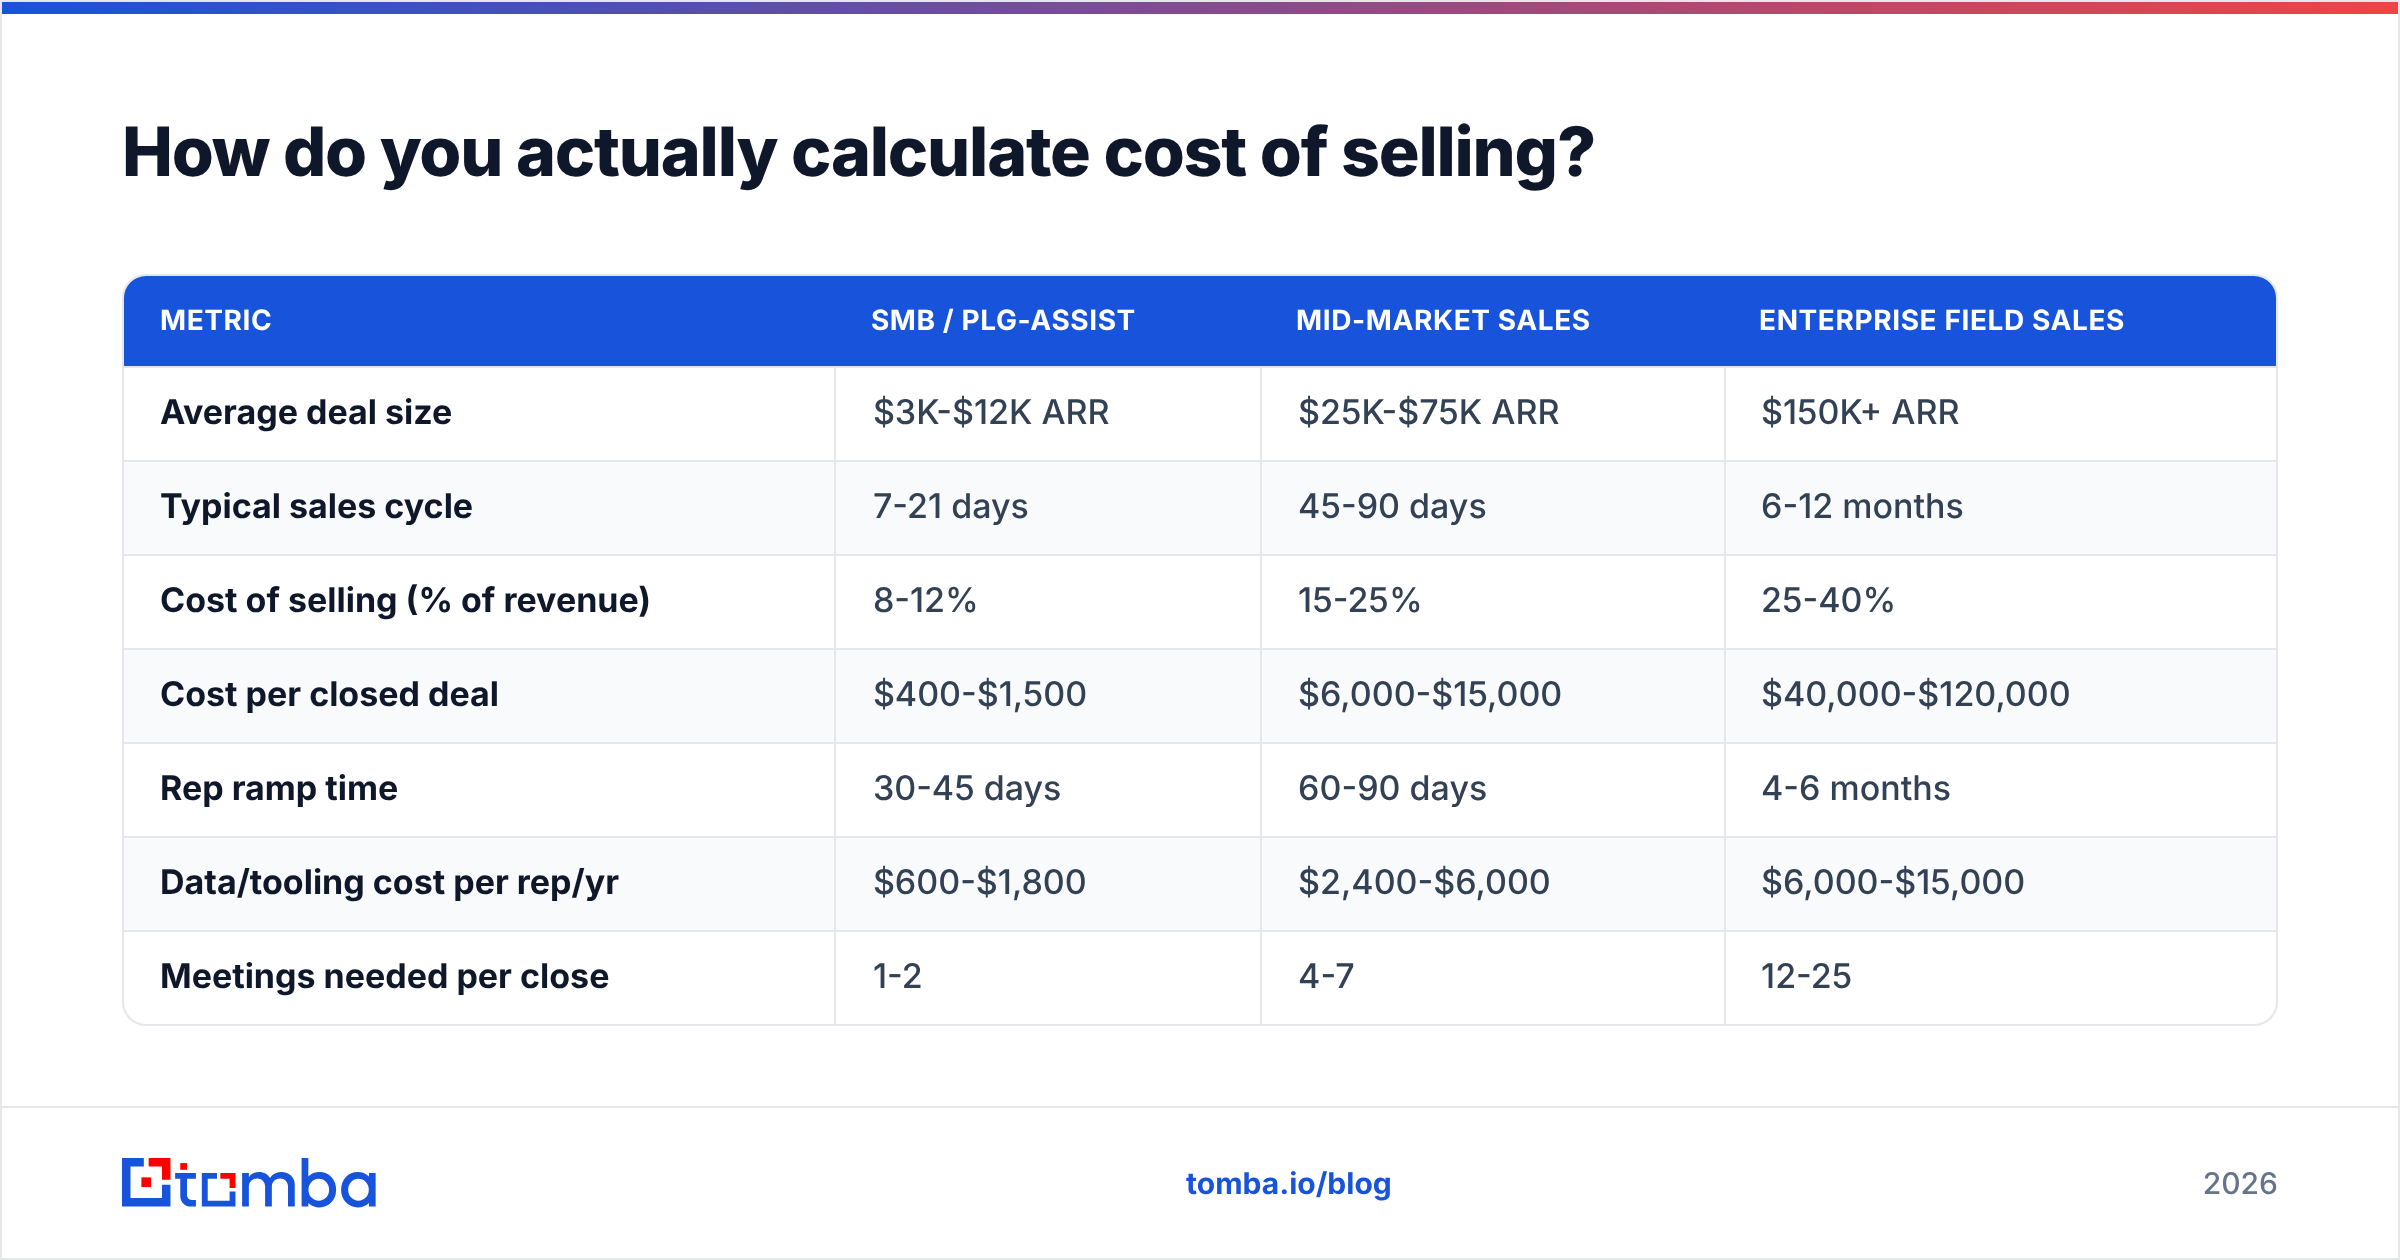
Then break it down by motion, because the blended average lies to you:
| Metric | SMB / PLG-assist | Mid-Market Sales | Enterprise Field Sales |
|---|---|---|---|
| Average deal size | $3K-$12K ARR | $25K-$75K ARR | $150K+ ARR |
| Typical sales cycle | 7-21 days | 45-90 days | 6-12 months |
| Cost of selling (% of revenue) | 8-12% | 15-25% | 25-40% |
| Cost per closed deal | $400-$1,500 | $6,000-$15,000 | $40,000-$120,000 |
| Rep ramp time | 30-45 days | 60-90 days | 4-6 months |
| Data/tooling cost per rep/yr | $600-$1,800 | $2,400-$6,000 | $6,000-$15,000 |
| Meetings needed per close | 1-2 | 4-7 | 12-25 |
| Primary cost driver | Volume of touches | Rep productivity | Cycle length + SE hours |
The table exposes the trap: an enterprise motion at 34% cost of selling can be perfectly healthy if net retention is 130%, while an SMB motion at 22% is on fire. Never judge the ratio without the retention number next to it.
What are the hidden costs most teams forget?#
Five line items get excluded from almost every cost-of-selling model I see, and together they usually account for a third of the real number.
- SDR payroll charged to marketing. If your SDRs report to marketing, their cost lands in demand gen and your sales efficiency looks artificially great. It is the same dollar either way. Pick one home and be consistent.
- Sales engineering and solutions consulting. In enterprise deals, SE hours per opportunity often exceed AE hours. Excluding them can understate enterprise cost of selling by 8-10 points.
- Management and enablement time. Your VP of Sales spends 40% of the week in deal reviews. That is a cost of selling, not G&A.
- Bad-data rework. Bounced sends that torch sender reputation, dials to disconnected numbers, and manual LinkedIn spelunking to find one email. This is the silent killer — see the next section.
- Deal desk, legal, and security review. Every SOC 2 questionnaire and redlined MSA is a cost incurred solely to close revenue.
Add those five back and most teams discover their real cost of selling is 6-12 points higher than what the board deck says.
How much does bad data really add to your cost of selling?#
Do the arithmetic on one rep and it stops being abstract.
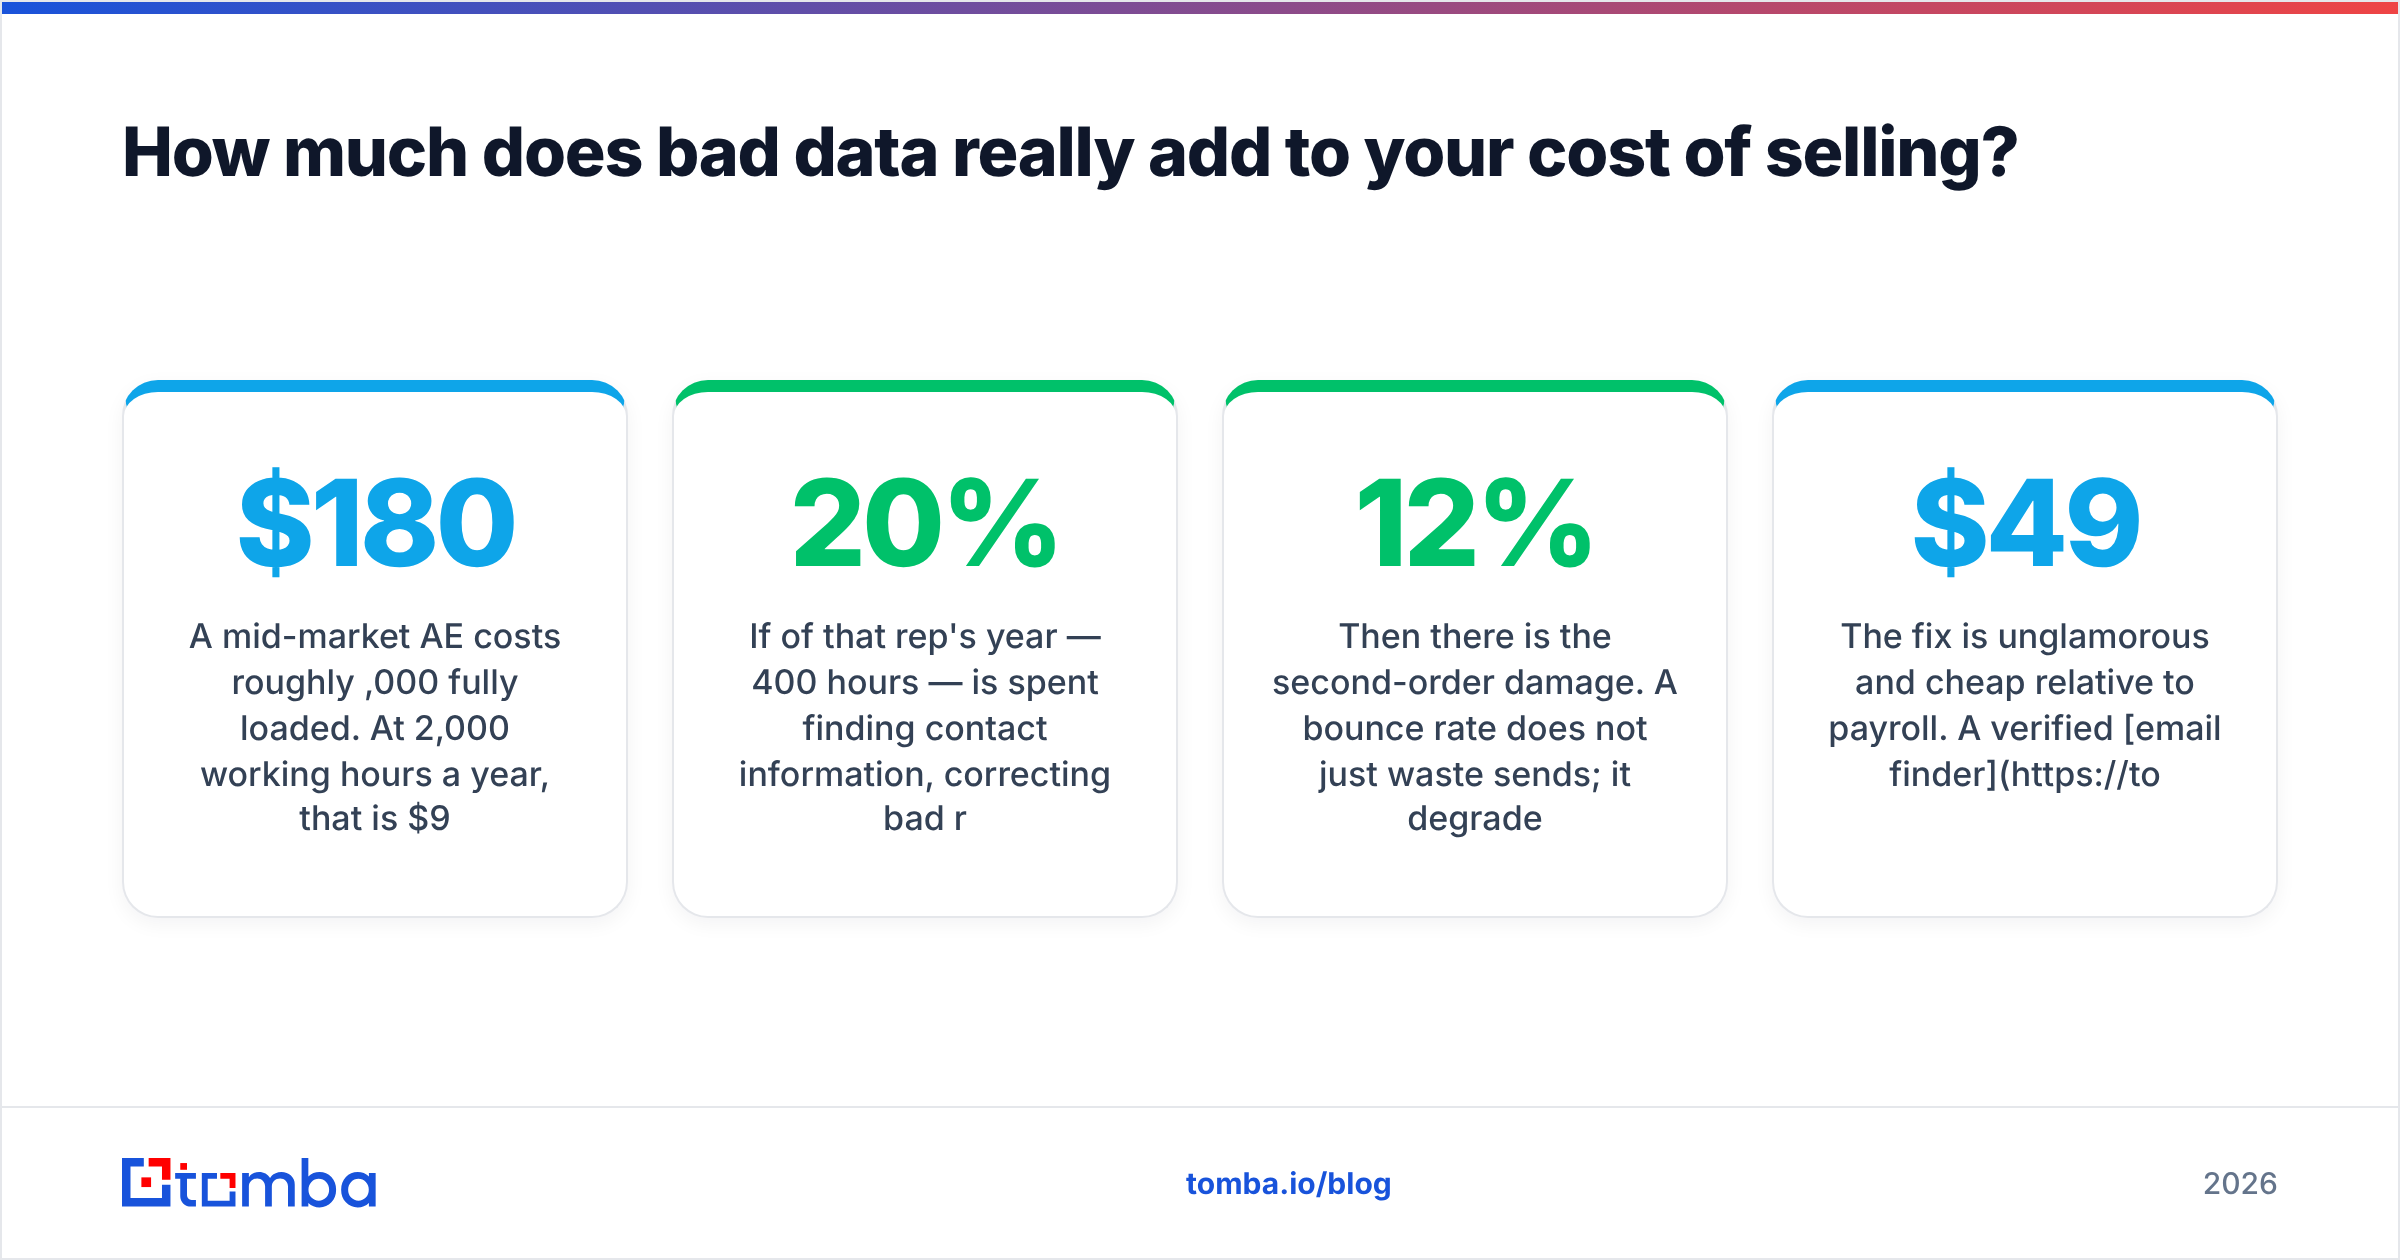
A mid-market AE costs roughly $180,000 fully loaded. At 2,000 working hours a year, that is $90 per hour. Now count where the hours go. Industry research summarized in HubSpot's sales statistics consistently shows reps spend under a third of their time actually selling; the rest goes to admin, research, and data cleanup.
If 20% of that rep's year — 400 hours — is spent finding contact information, correcting bad records, and re-routing bounced emails, that is $36,000 per rep, per year, spent on work that produces zero pipeline. Multiply by a team of eight and you have burned $288,000 on data janitorial work.
Then there is the second-order damage. A 12% bounce rate does not just waste sends; it degrades email deliverability across the whole domain, so your good emails stop reaching inboxes. You pay twice: once in wasted hours, once in suppressed reply rates on the contacts that were valid all along.
The fix is unglamorous and cheap relative to payroll. A verified email finder that returns a confidence-scored, SMTP-checked address costs a fraction of one hour of rep time per hundred lookups. At Tomba pricing — Free for 25 searches/mo, $49/mo Starter, $99/mo Growth, $249/mo Pro — the entire data line for a small team lands under $1,200/year. Set that against $36,000 of wasted rep hours and the ROI math is not close.

Which levers actually reduce the cost of selling?#
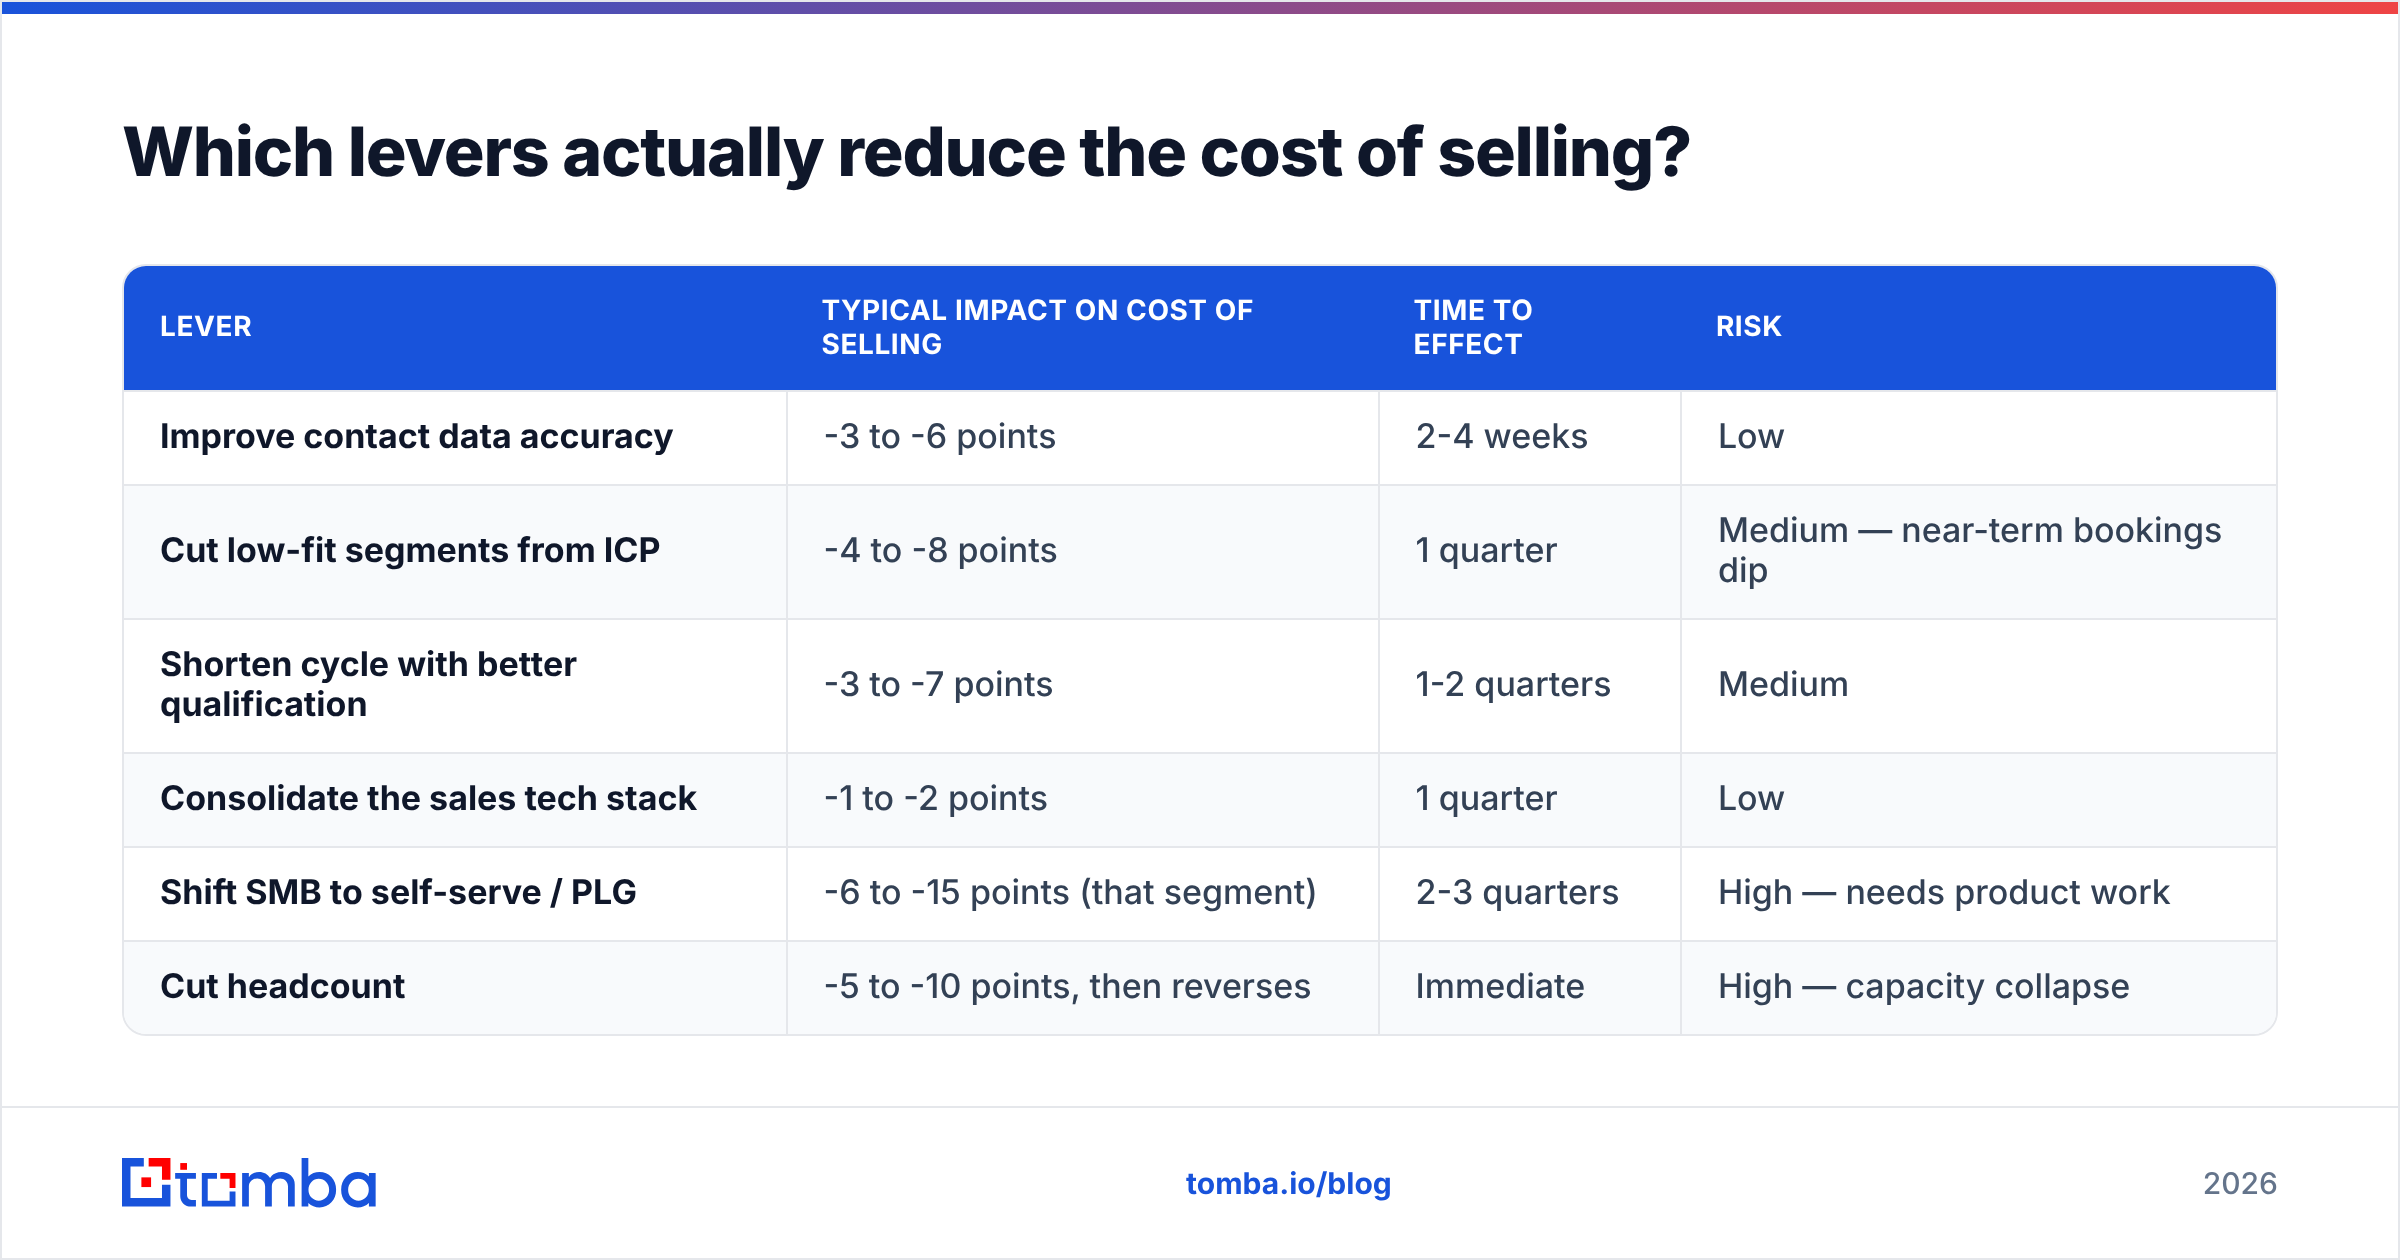
Ranked by impact-per-effort, based on what moves the ratio without breaking the pipeline:
| Lever | Typical impact on cost of selling | Time to effect | Risk |
|---|---|---|---|
| Improve contact data accuracy | -3 to -6 points | 2-4 weeks | Low |
| Cut low-fit segments from ICP | -4 to -8 points | 1 quarter | Medium — near-term bookings dip |
| Shorten cycle with better qualification | -3 to -7 points | 1-2 quarters | Medium |
| Consolidate the sales tech stack | -1 to -2 points | 1 quarter | Low |
| Shift SMB to self-serve / PLG | -6 to -15 points (that segment) | 2-3 quarters | High — needs product work |
| Cut headcount | -5 to -10 points, then reverses | Immediate | High — capacity collapse |
Note the last row. Headcount cuts improve the ratio for exactly one quarter, then pipeline coverage collapses and the ratio gets worse than where you started because your fixed costs did not fall proportionally. Every experienced RevOps leader has watched this movie.
The top row is boring and it works. Raising the share of a rep's week that touches a reachable, correctly-titled buyer is the only lever that improves cost of selling and increases capacity at the same time. Everything else is a trade-off.
Practical sequence:
- Audit your data first. Run your existing CRM contacts through a bulk verify pass. If more than 8% are invalid, your cost-of-selling problem is a data problem wearing a sales-strategy costume.
- Instrument the funnel by segment. Cost per closed deal by ICP tier, not blended. You will find one segment eating 40% of sales hours for 8% of revenue.
- Kill or automate that segment. Move it to self-serve, partner-led, or a lower-touch motion.
- Reinvest the recovered hours into the segments that already convert. This is where the ratio actually moves.
Is a low cost of selling always good?#
No — and this is where the metric gets abused.
A cost of selling under 10% in an enterprise motion usually means one of three things: you are under-investing in sales capacity and leaving pipeline on the table, you are misattributing costs to marketing, or your product is genuinely so category-dominant that buyers arrive pre-sold. Only the third is good news, and it is rare.
Peer-review the number against your own G2 and Capterra category — if competitors are outspending you 2:1 on sales coverage in the same segment, a "great" ratio often just means you are losing deals you never showed up for.
The right target is the ratio that maximizes profitable growth, not the minimum ratio. Pair cost of selling with:
- CAC payback period (target: under 18 months for mid-market SaaS)
- Net revenue retention (the number that justifies a high acquisition cost)
- Sales capacity utilization (are reps at quota-carrying capacity, or idle?)
A 30% cost of selling with 125% NRR beats a 15% cost of selling with 85% NRR every single year, forever. The first compounds. The second leaks.
What should you do this quarter?#
Start with the number you can actually change in 30 days.
Pull a list of every contact your reps touched last quarter. Check what percentage bounced, went to a catch-all, or reached someone who had left the company. If that number is above 8%, you have a measurable, recoverable cost of selling problem — and it is the cheapest one on the list to fix. A quick pass through a catch-all verifier and a proper verification step will tell you exactly how much of your rep payroll is currently funding bounced email.
Then re-baseline the full ratio with the hidden costs added back. The number will be worse than what is in your board deck. That is the point — you cannot optimize a number you are lying about.
Cut the most expensive line item in your cost of selling: wasted rep hours. Tomba Email Finder returns verified, confidence-scored professional email addresses by name, domain, or company — so your reps spend their week talking to buyers instead of guessing at email formats. Start free with 25 searches a month, or run your whole team on Starter at $49/mo. If you are cleaning an existing list first, pair it with the email verifier and find out in an afternoon exactly how much of your payroll is bouncing.
Related guides#
Ready to find emails that actually work?
Join 150,000+ professionals who stopped guessing and started sending. Free credits on signup — no credit card required.
Get the Tomba newsletter
Practical outbound tactics and product updates — once every two weeks.
About the author