Cost Per Acquisition by Industry: 2026 Benchmarks and Fixes
CPA is not one number — it is 20 different numbers depending on what you sell. Here are 2026 cost per acquisition benchmarks by industry, why they differ, and the levers that actually pull them down.
TL;DR
- Cost per acquisition (CPA) is not a single benchmark. Ecommerce averages roughly $45–$90 per customer; B2B SaaS lands between $400 and $1,500; legal, insurance, and enterprise software routinely exceed $2,000.
- The gap is driven by four things: contract value, sales-cycle length, channel auction density, and how many touches a deal needs before it closes.
- Most teams misdiagnose a high CPA as an ad problem. It's usually a data problem — you paid to reach people who were never going to buy, or you burned budget re-finding contacts you already had.
- The cheapest CPA reduction available to most B2B teams is not a bid adjustment. It's cleaning the top of funnel: verified contact data, better ICP filtering, and outbound that doesn't bounce.
- Use industry benchmarks as a sanity check, never as a target. Your CPA ceiling is set by your LTV, not by an average.
What is cost per acquisition, and what does it actually include?#
Cost per acquisition is the total money you spend to turn a stranger into a paying customer, divided by the number of customers you got.
The formula is boring. The scope is where teams get it wrong.
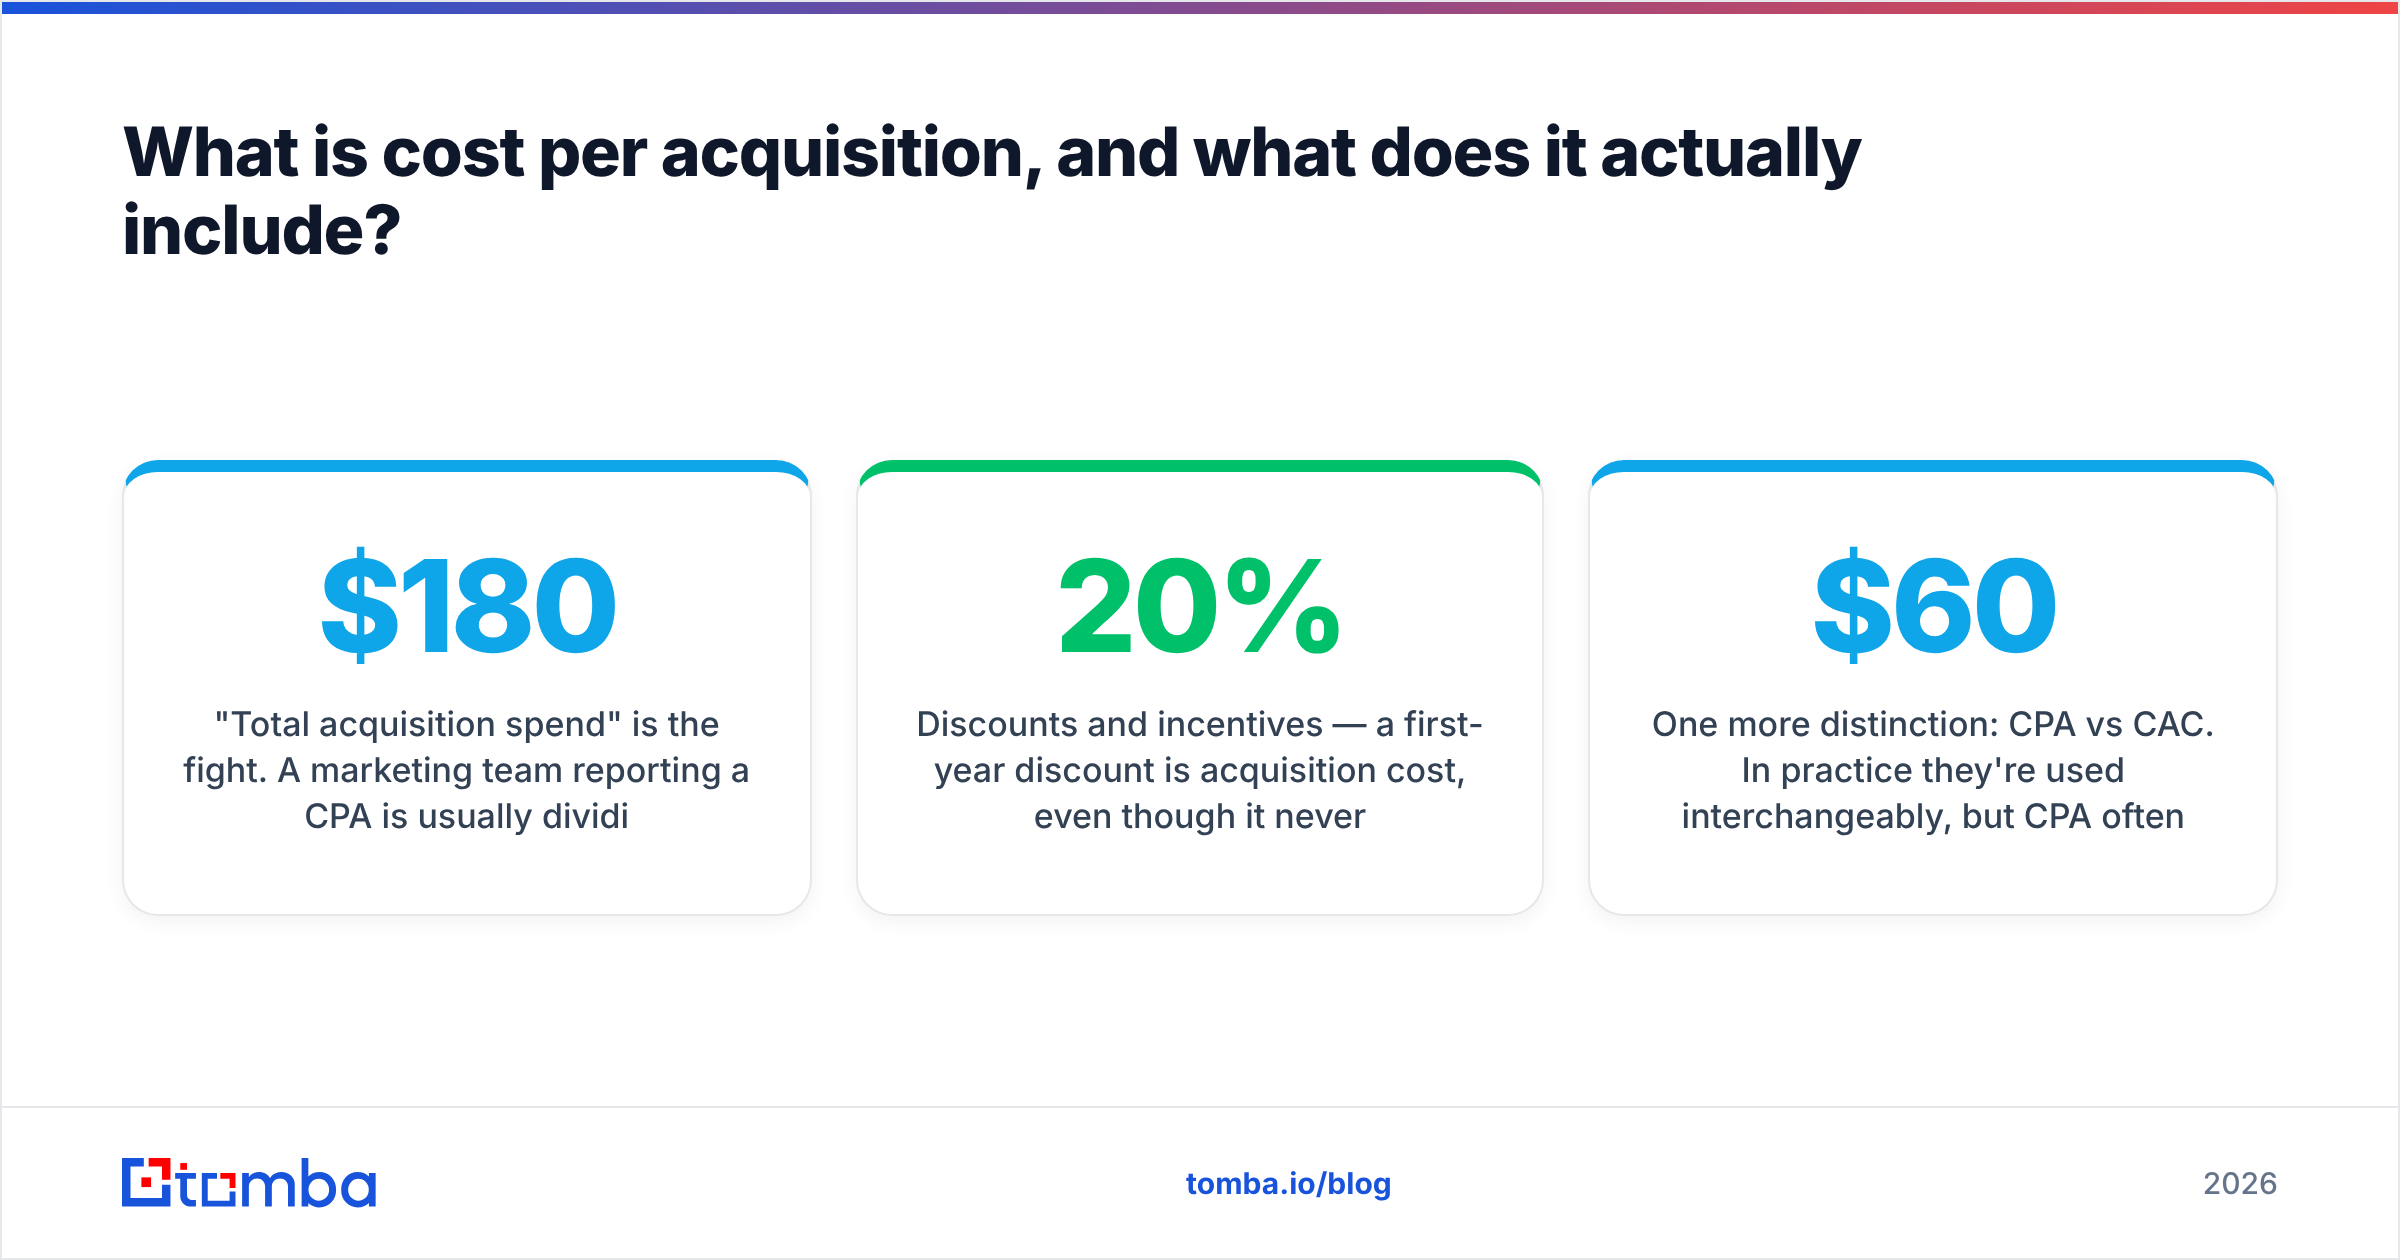
CPA = (Total acquisition spend in period) / (New customers in period)"Total acquisition spend" is the fight. A marketing team reporting a $180 CPA is usually dividing ad spend by signups. A CFO looking at the same quarter sees a $1,400 CPA, because they included:
- Media spend — Google, LinkedIn, Meta, retargeting, sponsorships.
- Tooling — CRM seats, sequencing platforms, data providers, analytics.
- People — the fully loaded cost of SDRs, AEs, and the marketers running the programs.
- Content and creative — the writers, designers, and agencies producing what the media spend distributes.
- Discounts and incentives — a 20% first-year discount is acquisition cost, even though it never leaves as cash.
If you want a number that survives a board meeting, use the fully loaded version. If you want a number you can optimize weekly, track blended media CPA separately and label it clearly. Just never compare your ad-spend-only CPA to somebody else's fully loaded benchmark and conclude you're winning. Cost per action as a concept predates most modern channels, and the definitional sloppiness has traveled with it.
One more distinction: CPA vs CAC. In practice they're used interchangeably, but CPA often refers to a single conversion event (a lead, a trial, a signup) while CAC almost always means a paying customer. When you read a benchmark, check which one is being measured. A $60 "CPA" in B2B SaaS is a cost per lead, not a cost per customer, roughly 100% of the time.
What is the cost per acquisition by industry in 2026?#
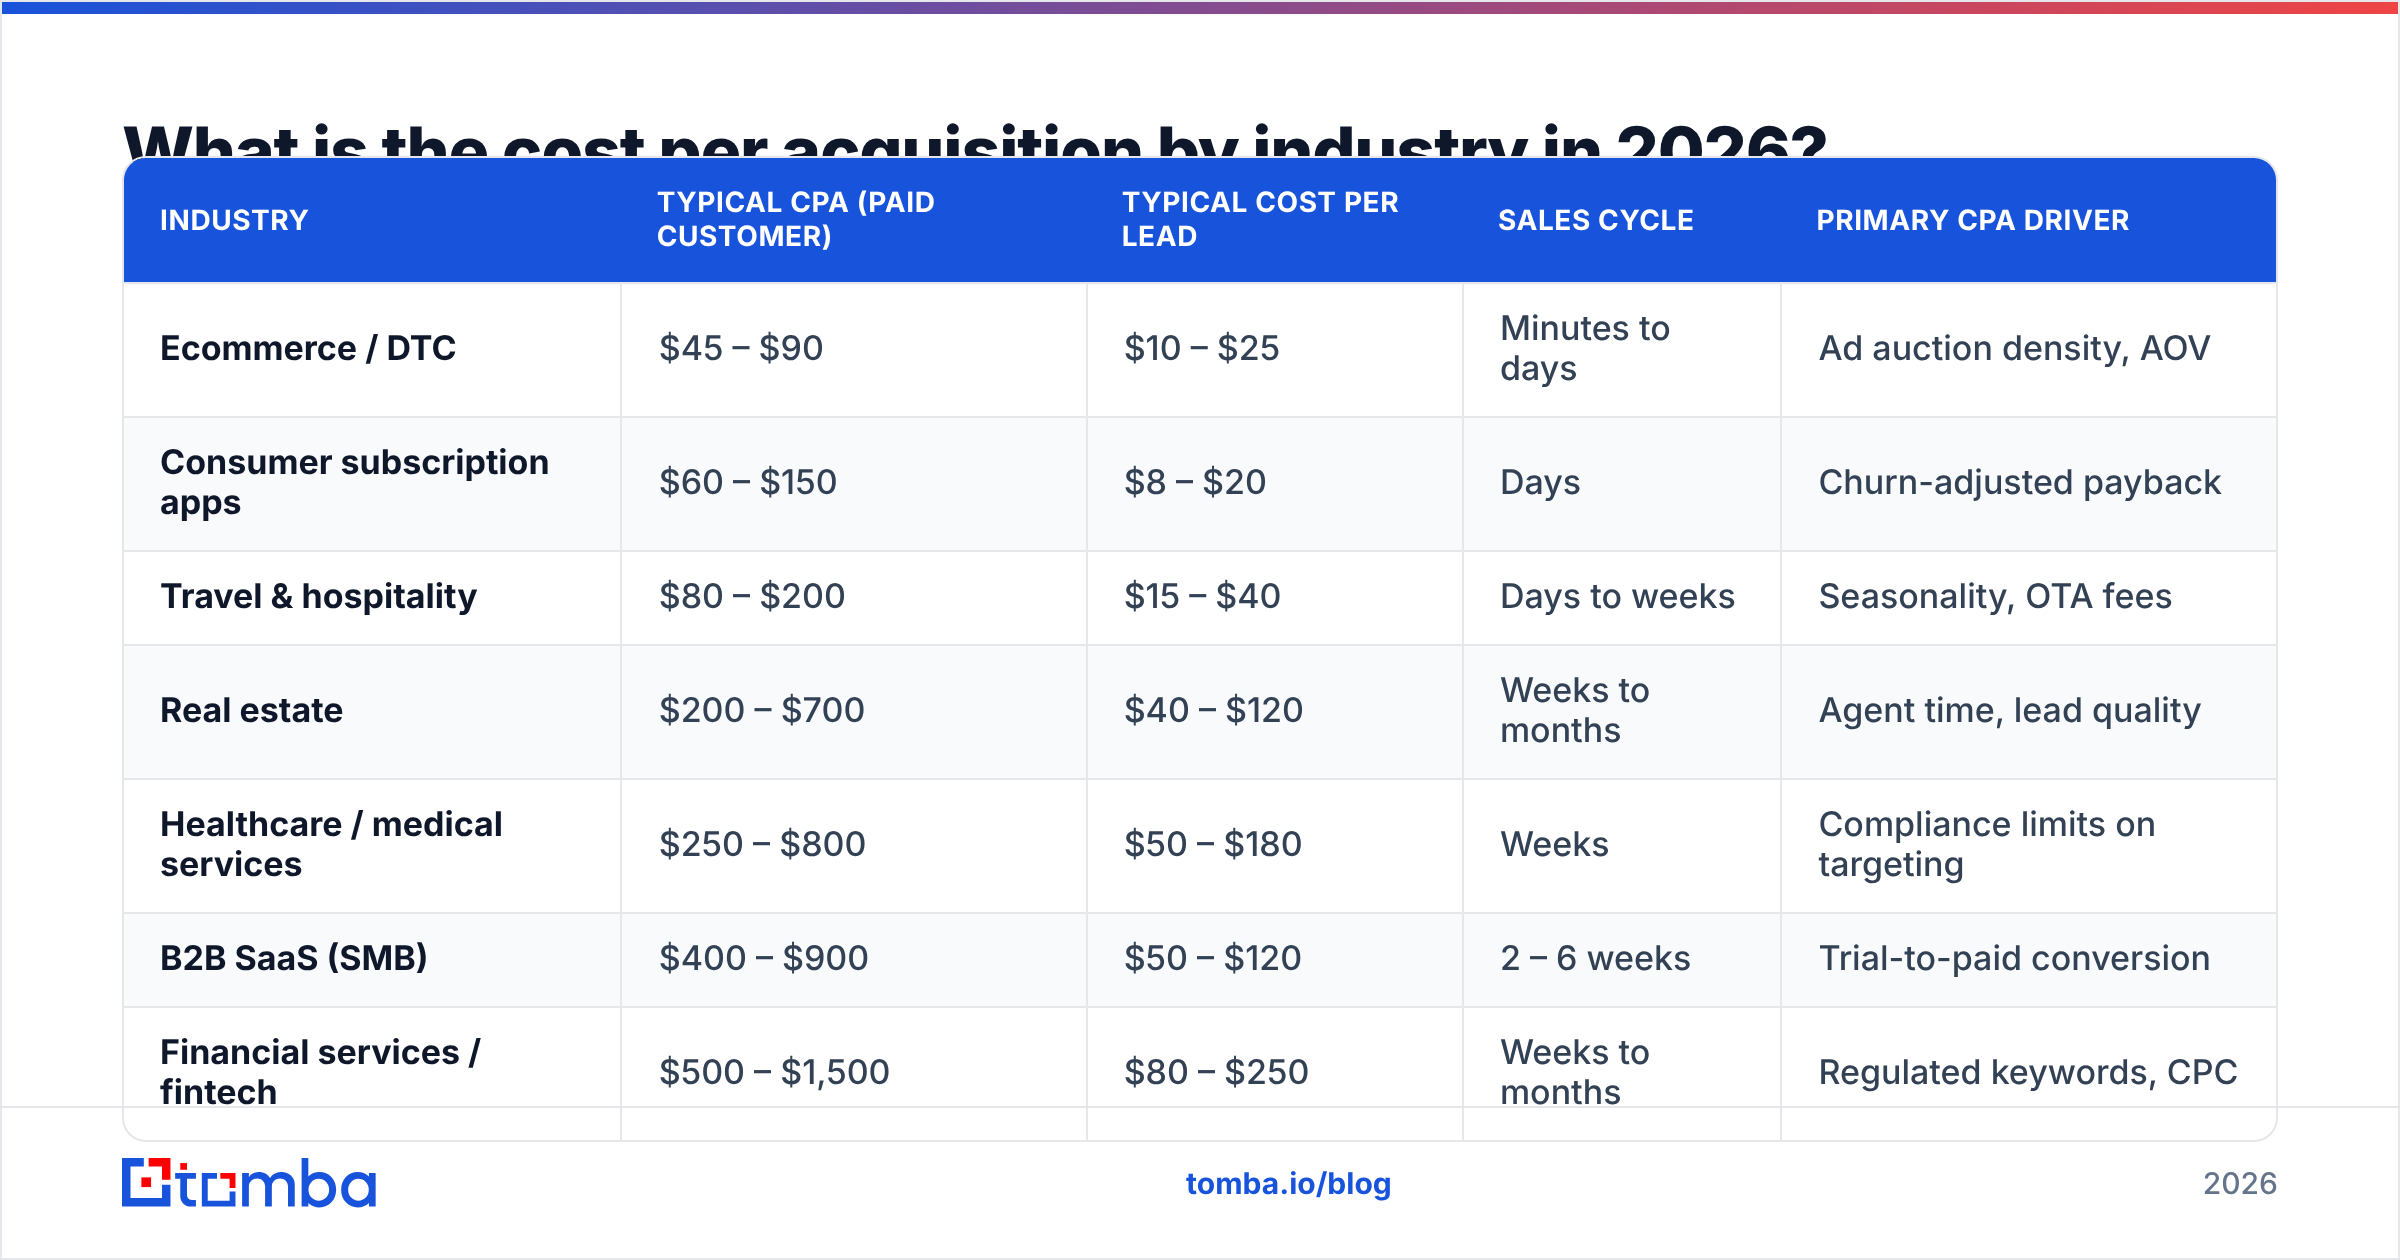
Here's the part you came for. These ranges are synthesized from publicly reported paid-channel benchmarks, vendor-reported CAC studies, and SaaS metrics disclosures. Treat them as order-of-magnitude, not gospel — the variance inside any single row is wider than the gap between adjacent rows.
| Industry | Typical CPA (paid customer) | Typical cost per lead | Sales cycle | Primary CPA driver |
|---|---|---|---|---|
| Ecommerce / DTC | $45 – $90 | $10 – $25 | Minutes to days | Ad auction density, AOV |
| Consumer subscription apps | $60 – $150 | $8 – $20 | Days | Churn-adjusted payback |
| Travel & hospitality | $80 – $200 | $15 – $40 | Days to weeks | Seasonality, OTA fees |
| Real estate | $200 – $700 | $40 – $120 | Weeks to months | Agent time, lead quality |
| Healthcare / medical services | $250 – $800 | $50 – $180 | Weeks | Compliance limits on targeting |
| B2B SaaS (SMB) | $400 – $900 | $50 – $120 | 2 – 6 weeks | Trial-to-paid conversion |
| Financial services / fintech | $500 – $1,500 | $80 – $250 | Weeks to months | Regulated keywords, CPC |
| B2B SaaS (mid-market) | $900 – $2,500 | $120 – $300 | 1 – 3 months | Multi-threading, demo rate |
| Insurance | $700 – $2,000 | $60 – $200 | Days to weeks | Extreme keyword CPC |
| Legal services | $1,000 – $3,500 | $100 – $400 | Weeks | Auction cost per click |
| Enterprise software | $5,000 – $30,000+ | $300 – $900 | 6 – 18 months | Committee size, field sales |
| Manufacturing / industrial | $600 – $2,000 | $80 – $250 | Months | Long RFQ cycles, small TAM |
Read the table in pairs. Ecommerce and enterprise software are not on the same scale — a DTC brand that hits $90 CPA on a $70 AOV is dying, and an enterprise vendor that hits $18,000 CPA on a $250,000 ACV is printing money. The absolute number tells you nothing without the deal size next to it.
Why does CPA vary so much between industries?#
Four forces explain almost all of the spread.
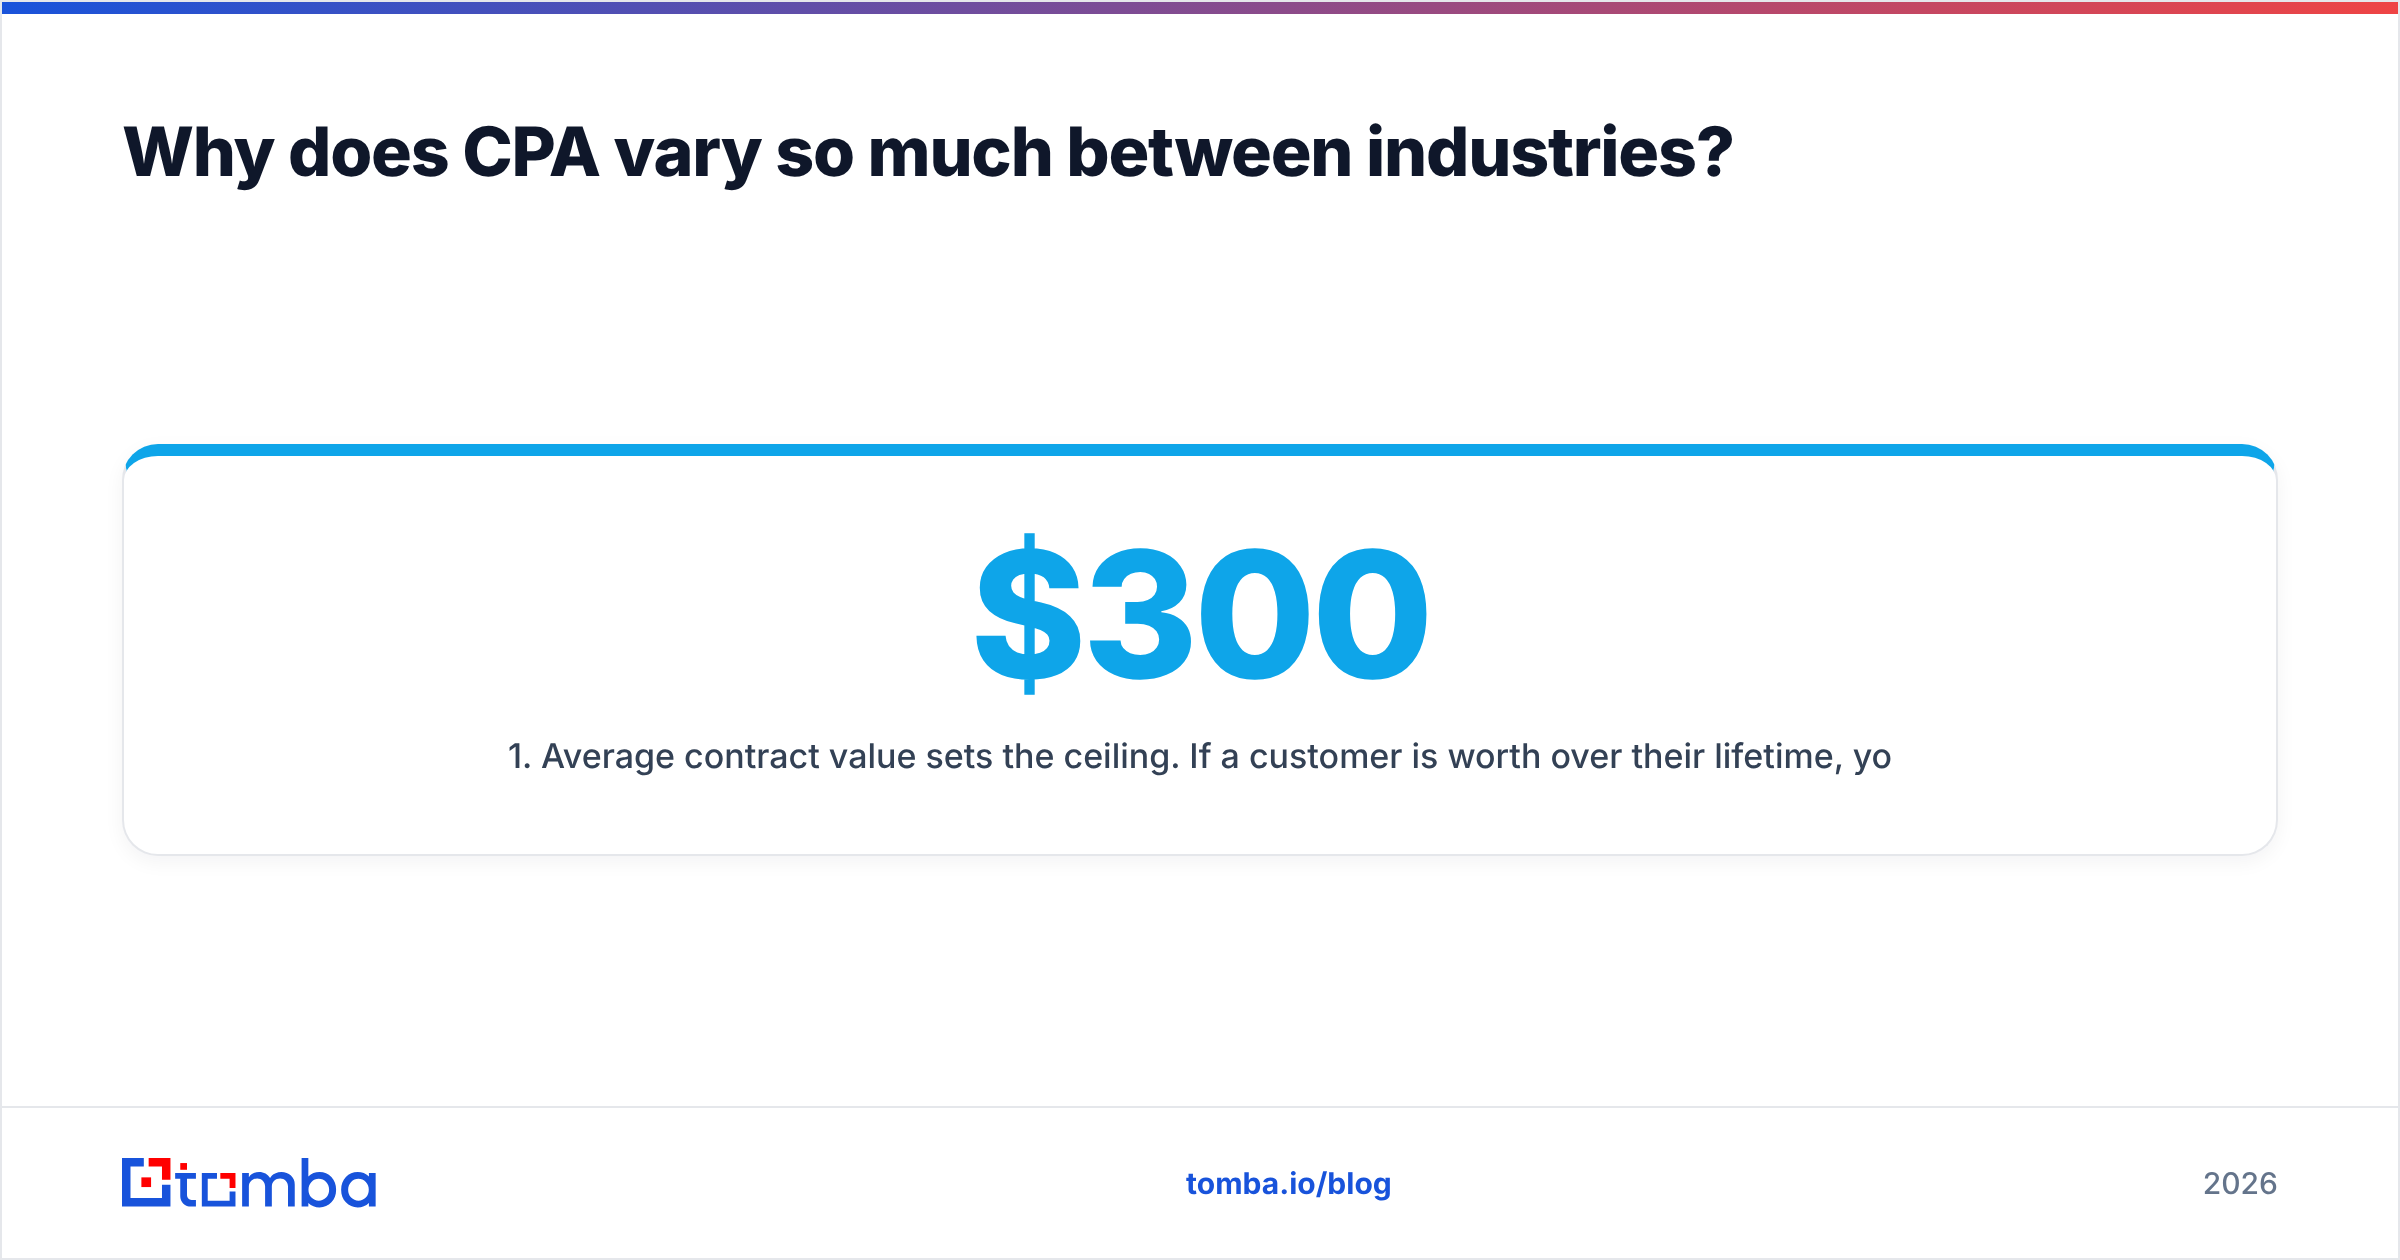
Average contract value sets the ceiling. If a customer is worth $300 over their lifetime, you cannot spend $500 to get them — so nobody in that market bids past a certain point, and CPA stays compressed. If a customer is worth $400,000, everyone bids until the auction hurts. High CPA is often a symptom of a healthy market, not a broken funnel.
Sales-cycle length multiplies the human cost. A 9-month enterprise cycle means an AE, an SE, a security review, and three follow-up cycles. Every one of those hours is acquisition cost. Ecommerce has no AE, so its CPA is nearly pure media.
Auction density compounds. Legal and insurance keywords cost what they cost because a single converted client is worth thousands and there are hundreds of local competitors bidding. Search-driven verticals with high LTV and low differentiation always end up with brutal CPCs.
Touch count. Gartner's research on B2B buying groups is consistent on this point: the more people in the buying committee, the more contacts you have to reach, the more your acquisition cost inflates. Reaching six stakeholders instead of one doesn't add 6x cost, but it's rarely less than 2–3x.
Everything else — creative quality, landing-page conversion rate, offer strength — moves CPA within a band. These four set the band.
How do you calculate your own CPA correctly?#
Do it in four passes, from cheapest to hardest.
- Blended CPA. All acquisition spend ÷ all new customers. Ugly, honest, board-ready. Start here.
- Paid CPA. Media spend + agency fees ÷ customers attributable to paid. This is the number you optimize week to week.
- Channel CPA. Same math, split by source. This is where you find that LinkedIn costs 4x Google but produces deals worth 6x more — which means LinkedIn is your cheaper channel, despite the higher CPA.
- Segment CPA. Split by ICP tier. Most companies discover that their "best" segment has a CPA 40% lower than their worst, and that they're spending 60% of budget on the worst one.
Then divide LTV by CPA. Under 3:1 and you have a problem. Over 5:1 and you are probably under-investing — you could spend more, acquire faster, and still be healthy. HubSpot's benchmark reporting tracks the same ratio across thousands of teams and the 3:1 floor holds up remarkably well as a warning line.
Is a high CPA always bad?#
No — and this is where benchmark-chasing does real damage.
A high CPA is bad when it outruns LTV, when payback stretches past 18 months, or when it's rising while conversion rates stay flat (meaning you're just paying more for the same thing). A high CPA is fine when it's buying long-lived, high-expansion customers with 130% net revenue retention.
The failure mode is a VP who reads "the average B2B SaaS CPA is $600," sees their own $1,400, panics, and cuts the channels driving their best-retaining customers. Three quarters later, blended CPA looks great and net new ARR is down 30%.
Benchmark against your own trailing quarters, segmented by channel and ICP. Use industry numbers only to answer one question: am I in a completely different universe from my peers, and if so, why?
What actually lowers cost per acquisition?#
Ranked by how much leverage they give you per hour of effort:
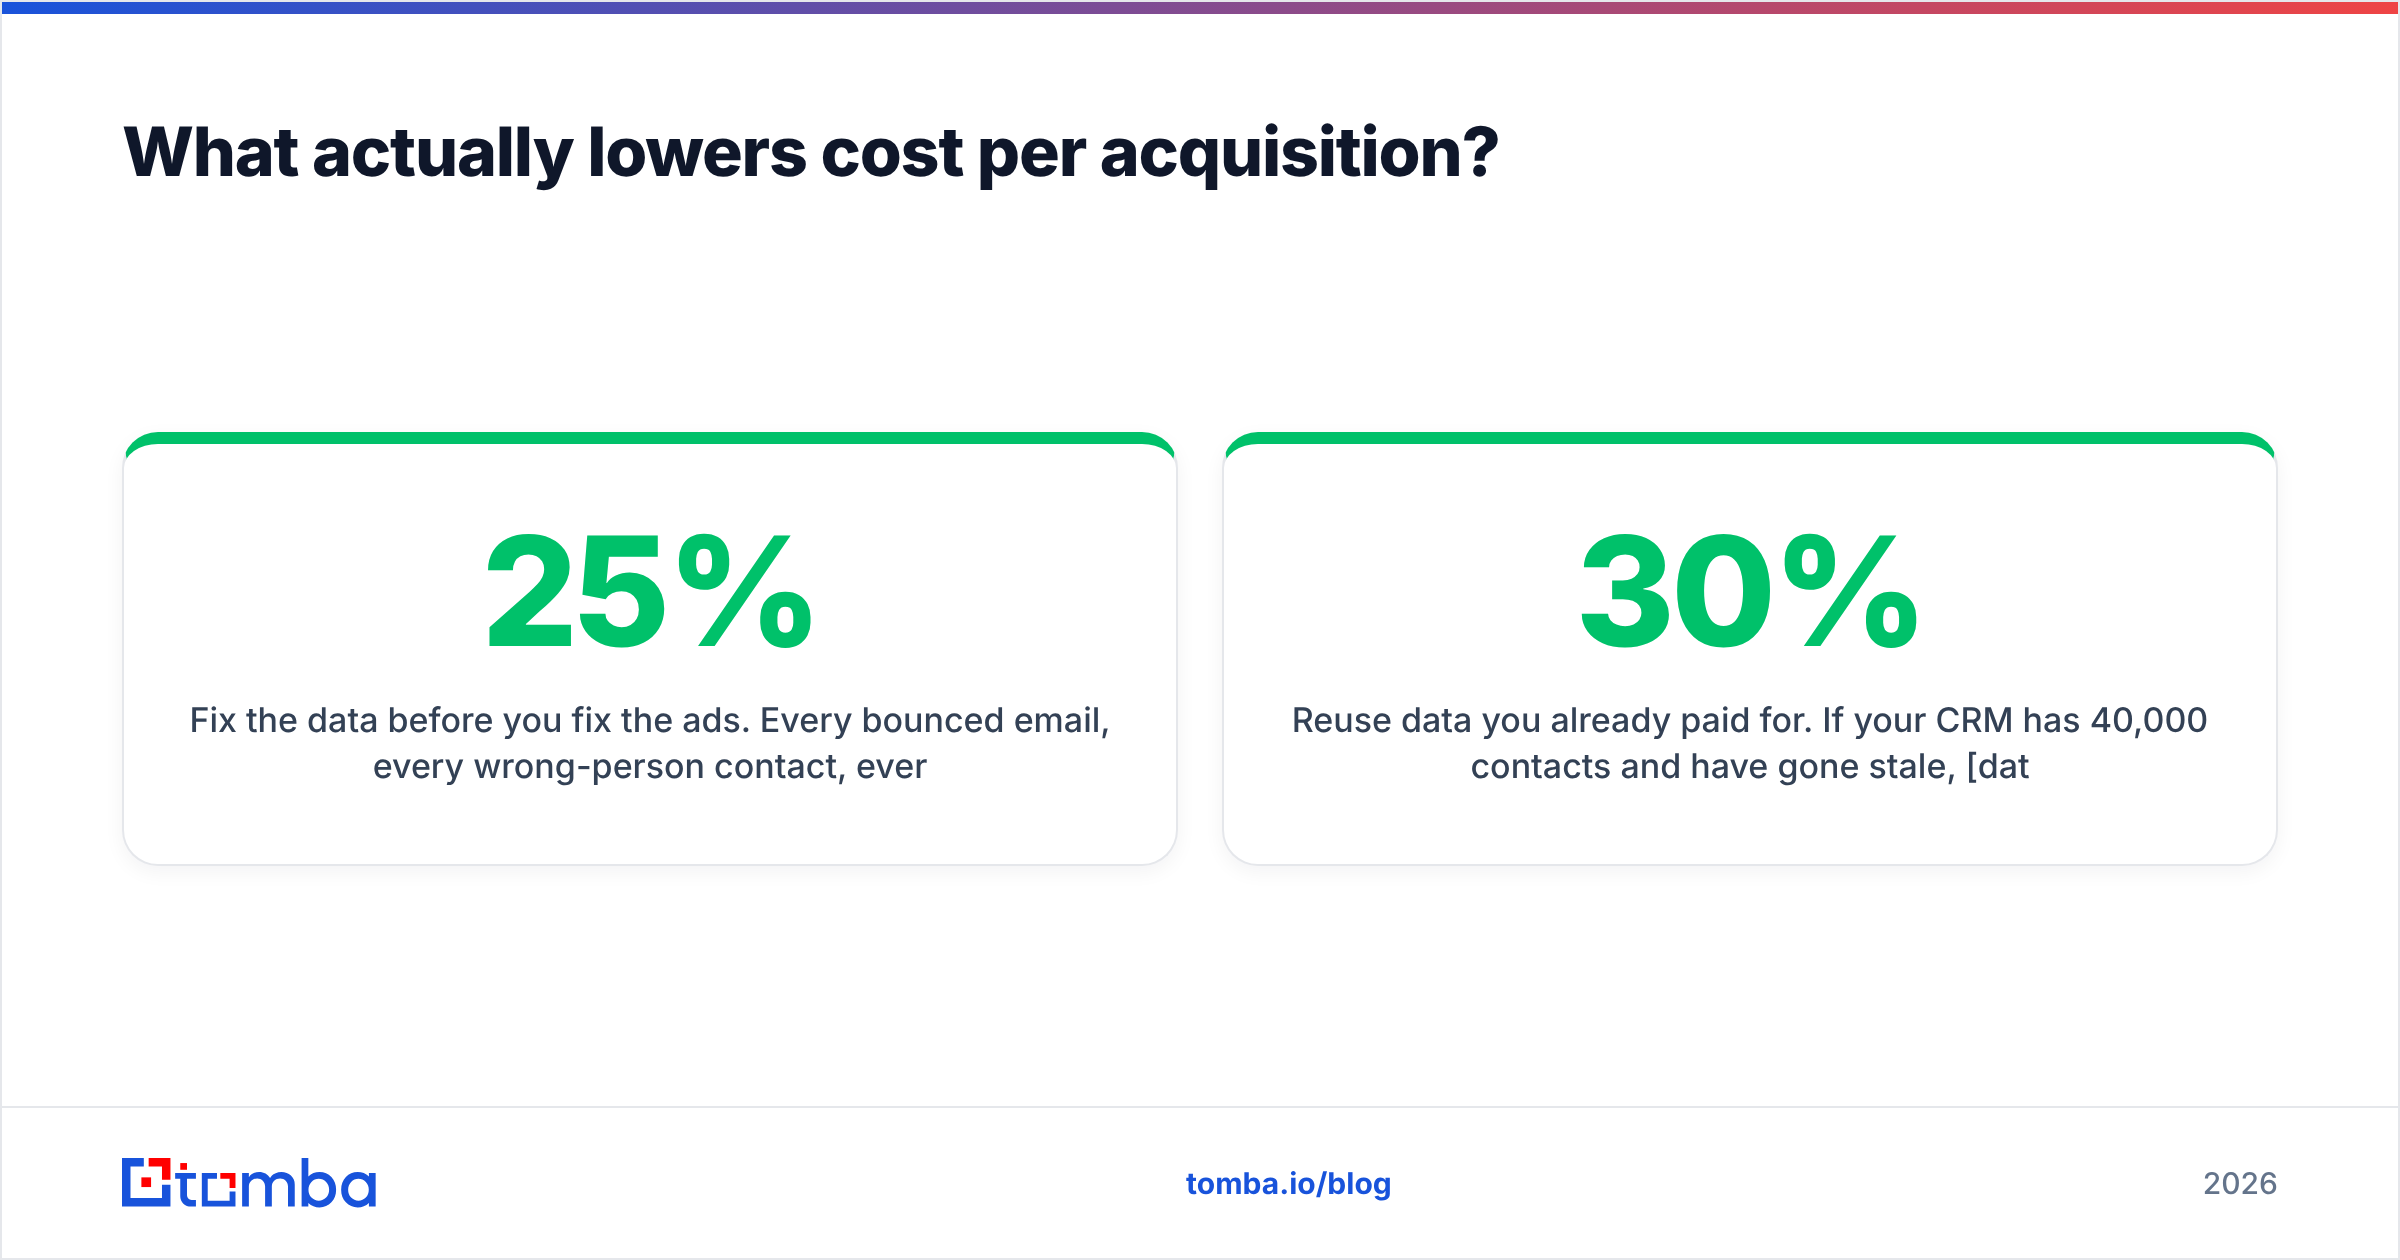
- Fix the data before you fix the ads. Every bounced email, every wrong-person contact, every stale job title is spend that produced nothing. A 25% bounce rate on outbound doesn't just waste sends — it damages your sender reputation, which suppresses the deliverability of the 75% that were good. Running your list through an email verifier before a campaign is the single highest-ROI hour in most outbound programs.
- Tighten the ICP filter earlier. Most teams filter for fit at the demo stage. Filter at the list-build stage instead. Fewer, better-matched prospects mean higher reply rates, shorter cycles, and a lower cost per closed deal — even though your cost per lead goes up.
- Shorten the cycle. Every week a deal sits open is AE salary burning against it. Multi-thread earlier: find the economic buyer's contact on day one instead of week six. Reaching three stakeholders in a buying committee from the start is cheaper than reaching one and waiting for them to forward your deck.
- Kill the worst channel decile, not the worst channel. Channel-level CPA hides enormous variance. Within a "bad" channel there are usually campaigns performing 5x better than the channel average. Cut the tail, keep the head.
- Improve conversion rate, not just cost. Halving your CPC and halving your landing-page conversion rate leaves CPA unchanged. Conversion-rate work compounds across every channel simultaneously; bid work only helps the channel you touched.
- Reuse data you already paid for. If your CRM has 40,000 contacts and 30% have gone stale, data enrichment on the existing base is dramatically cheaper than acquiring new records. You already paid the acquisition cost once.
How does contact data quality move the CPA number?#
Concretely, with numbers.
Say you run outbound to 10,000 prospects. Your list is 70% deliverable, which is normal for scraped or aged data. You get 7,000 landed emails, a 3% reply rate (210 replies), a 25% meeting rate (52 meetings), and a 20% close rate (10 customers). If the program costs $18,000 fully loaded, your CPA is $1,800.
Now run the same program with a 96% deliverable, ICP-filtered list. You get 9,600 landed emails. Because the list is better targeted, reply rate climbs to 4.5% (432 replies). Meeting rate holds at 25% (108 meetings), close rate at 20% (21 customers). Same $18,000 plus $400 in data cost. Your CPA drops to $876 — a 51% cut, with no change to your ads, your copy, or your team.
That's not a hypothetical stretch. It's the arithmetic of removing waste from the widest part of the funnel, where every percentage point multiplies through every stage downstream. The teams with the best CPA in any industry are rarely the ones with the cleverest creative. They're the ones whose top-of-funnel isn't leaking.
If you're building lists at scale, a bulk email finder plus verification pass costs a rounding error against the media and headcount spend it protects. Compare that to Tomba pricing — $49/mo on Starter, $99/mo on Growth — against the $18,000 program above and the math answers itself.
What CPA should you target for your industry?#
Work backwards, in this order:
- Calculate LTV honestly (gross margin, not revenue; include churn).
- Set your target LTV:CPA ratio — 3:1 minimum, 4:1 if you want room to scale.
- Divide. That's your CPA ceiling.
- Check it against the industry table above. If your ceiling is 5x the industry range, your LTV math is probably optimistic. If it's a fifth of the range, you likely can't compete in paid channels at all and should lean into outbound, partnerships, or product-led motions.
- Set your payback period target — 12 months for SMB, up to 24 for enterprise — and confirm the CPA ceiling clears it.
The industry benchmark is a smell test, not a goal. Nobody ever won a market by hitting the average.
Start with the data layer#
The fastest CPA reduction available to a B2B team isn't a new channel or a rebrand. It's making sure every dollar of outreach lands on a real person who fits your ICP.
Tomba Email Finder gives you verified, deliverable contacts by domain, name, or company — so your outbound spend converts instead of bouncing. Start on the free tier (25 searches/month), test it against your current list quality, and watch what happens to your cost per acquisition when the top of your funnel stops leaking.
Related guides#
Ready to find emails that actually work?
Join 150,000+ professionals who stopped guessing and started sending. Free credits on signup — no credit card required.
Get the Tomba newsletter
Practical outbound tactics and product updates — once every two weeks.
About the author