Cost Per Customer: How to Calculate and Cut It in 2026
Most teams calculate cost per customer wrong — they leave out salaries, tooling, and the leads that never converted. Here's the honest math, plus the levers that actually move the number.
TL;DR
- Cost per customer = total sales + marketing spend (including salaries, tools, and wasted spend) divided by new customers won in the same period. Most teams quietly omit two of those three inputs.
- The number is only useful when paired with LTV. A $600 cost per customer is excellent at $9,000 LTV and lethal at $1,200.
- Bad contact data is one of the largest hidden multipliers: bounced emails, wrong-number dials, and dead leads inflate the denominator's cost without adding a single customer.
- The four levers that actually move the number: raise list accuracy, kill unqualified pipeline earlier, shorten the sales cycle, and shift mix toward cheaper channels.
- Benchmarks are a sanity check, not a target. Your payback period matters more than matching someone else's CAC.
What is cost per customer, exactly?#
Cost per customer is what you spend, on average, to turn a stranger into a paying account. The formula looks trivial:
Cost per customer = (Sales spend + Marketing spend) / New customers acquiredSame period on both sides. If you spent $120,000 across sales and marketing in Q1 and closed 200 new accounts, your cost per customer is $600.
The formula is not where teams go wrong. The numerator is where they go wrong. "Sales spend + marketing spend" is not just ad budget. It is:
- Fully loaded salaries — every SDR, AE, marketer, and the fraction of a designer's or RevOps engineer's time that touches acquisition. Include benefits and payroll tax, not just base.
- Commissions and bonuses — the variable comp paid on the deals you're counting.
- Software and data — CRM seats, sequencer, enrichment, intent data, ad platforms, call recording. All of it.
- Agencies, contractors, and content — the freelance writer, the SEO retainer, the design contractor.
- Wasted spend — the campaigns that flopped, the list you bought that bounced, the SDR hours spent on leads that never had budget. This is the line people delete because it's embarrassing. It's also the line with the most upside.
- Overhead allocation — the slice of tooling and management that supports the GTM org.
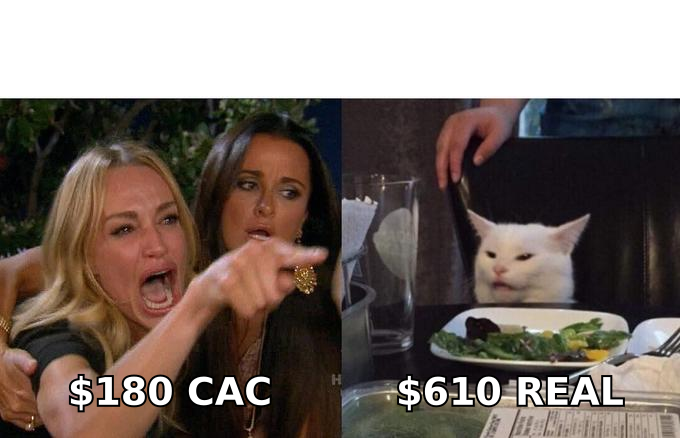
Skip items 1, 5, and 6 and your reported cost per customer will look roughly a third of its true value. That is the single most common failure mode in revenue operations reporting.
Is cost per customer the same as CAC?#
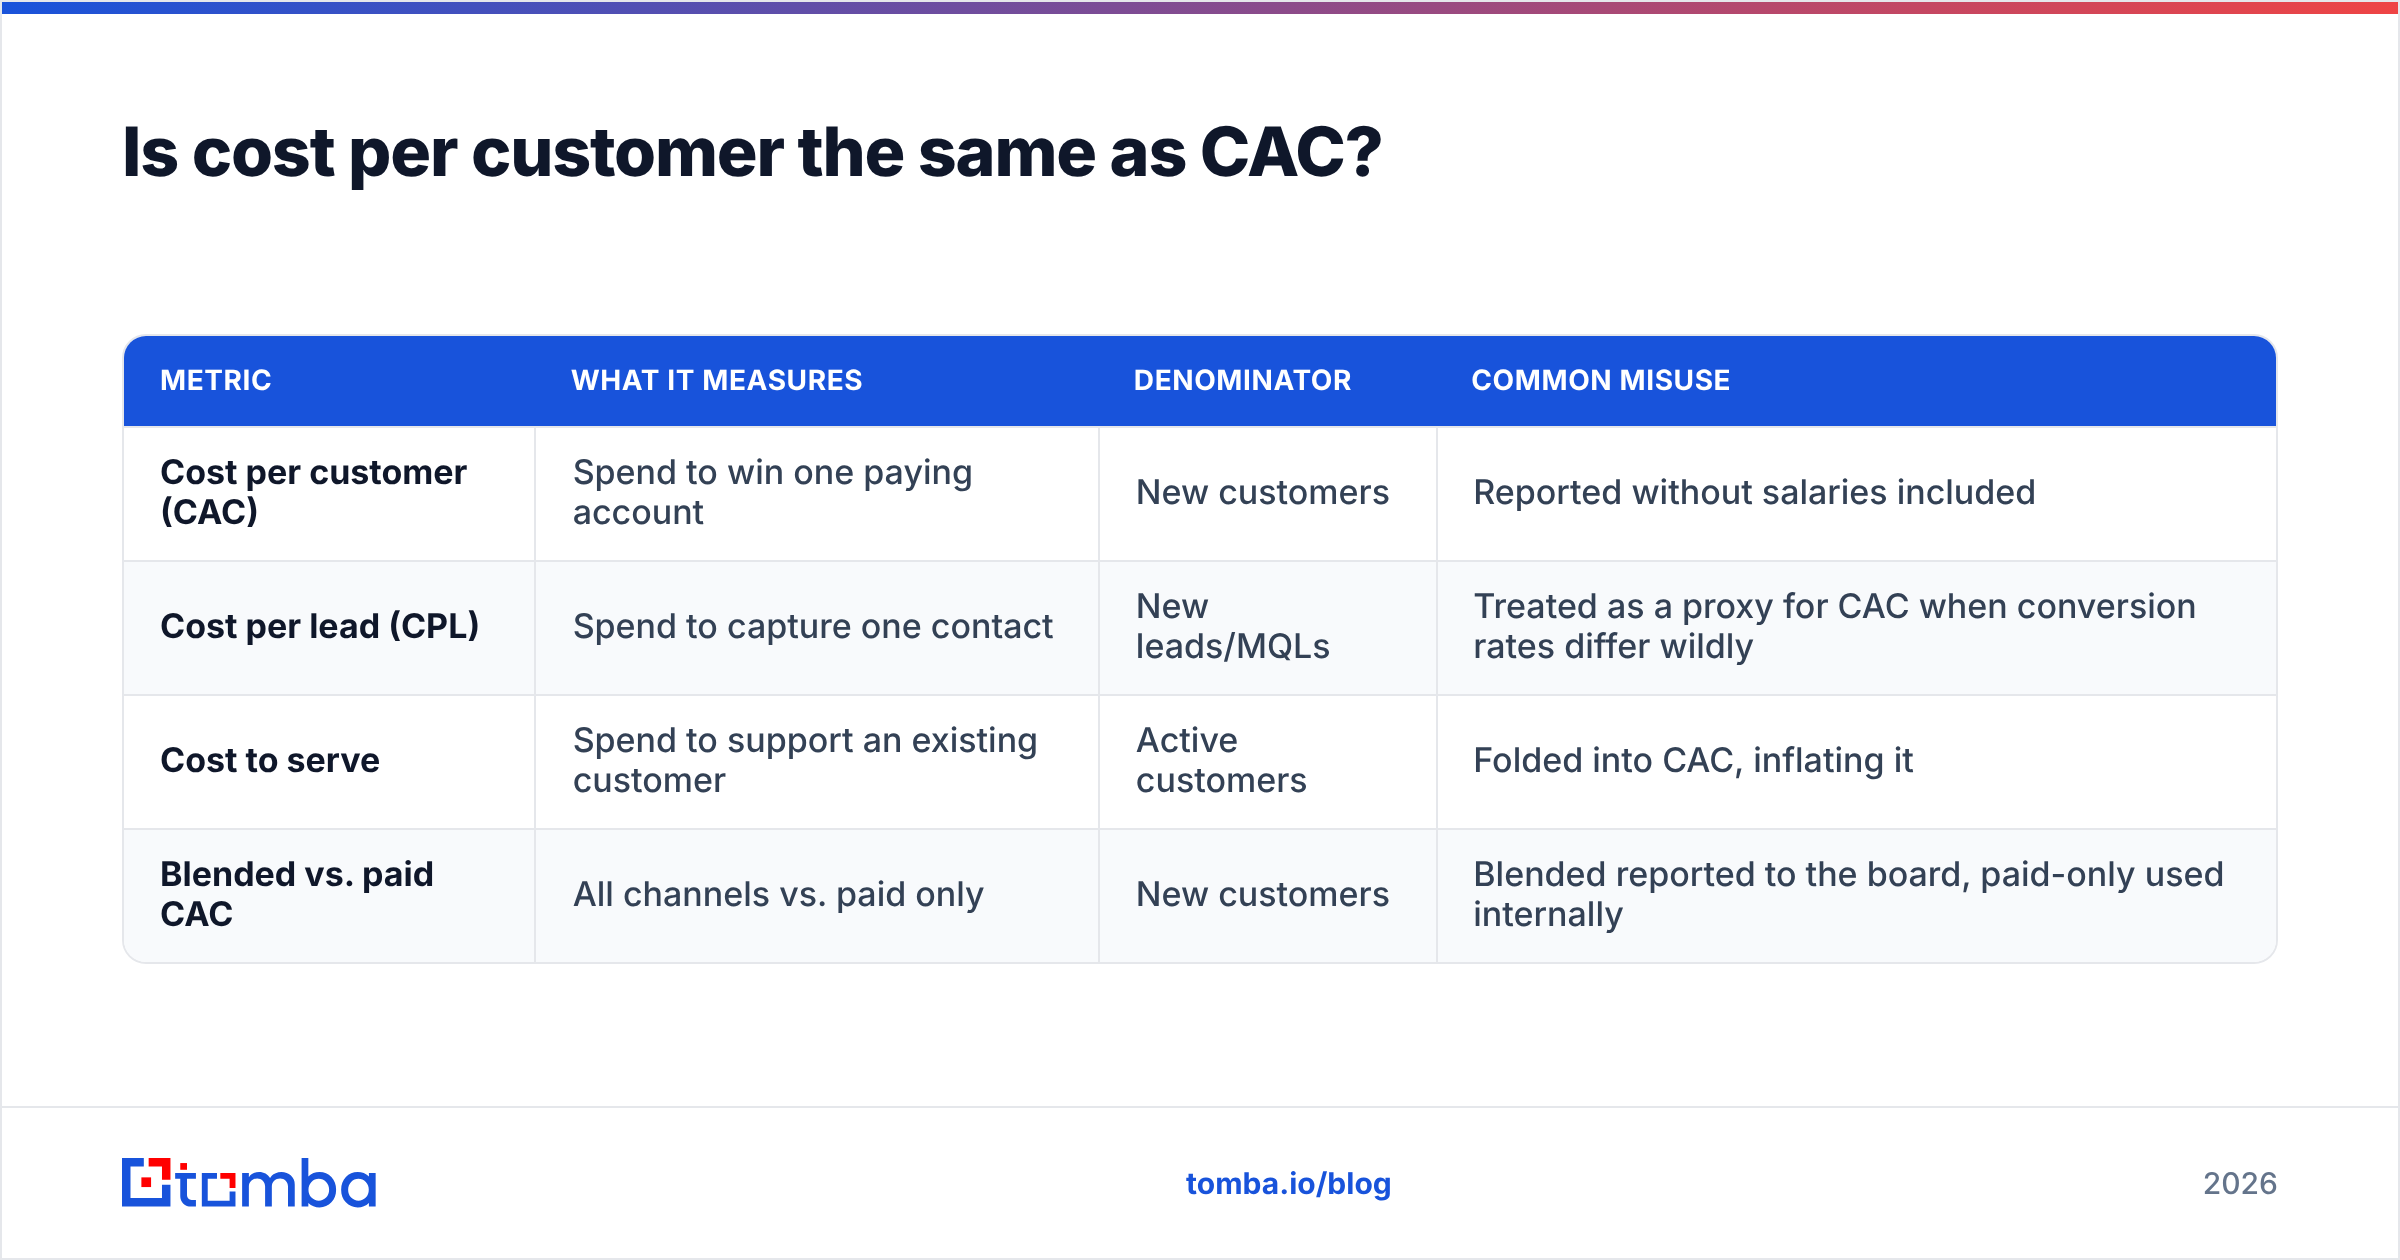
Practically, yes — most teams use "cost per customer" and "customer acquisition cost" (CAC) interchangeably, and this guide does too. But three neighboring metrics get confused with it constantly, and mixing them up produces reports that are internally inconsistent.
| Metric | What it measures | Denominator | Common misuse |
|---|---|---|---|
| Cost per customer (CAC) | Spend to win one paying account | New customers | Reported without salaries included |
| Cost per lead (CPL) | Spend to capture one contact | New leads/MQLs | Treated as a proxy for CAC when conversion rates differ wildly |
| Cost to serve | Spend to support an existing customer | Active customers | Folded into CAC, inflating it |
| Blended vs. paid CAC | All channels vs. paid only | New customers | Blended reported to the board, paid-only used internally |
The distinction that trips people up most: cost per lead is not a leading indicator of cost per customer unless lead quality is stable. You can halve CPL by buying a cheaper list and simultaneously double CAC, because the cheap list converts at a fifth of the rate. The two numbers move in opposite directions all the time.
A related trap is blended vs. paid CAC. Blended CAC divides total spend by all new customers, including the ones who found you organically, got referred, or came back from a two-year-old blog post. It flatters the number. Paid CAC isolates spend against customers attributable to that spend. Report blended to understand company-level efficiency; use paid CAC to decide whether to keep buying a channel.
What is a good cost per customer in 2026?#
There is no universal number, and anyone quoting one is selling something. What exists are ratios that hold up across business models.
The two that matter:
- LTV:CAC ratio. Lifetime value divided by cost per customer. Below 1:1 you are lighting money on fire. Around 3:1 is the conventional healthy target for B2B SaaS. Above 5:1 usually means you are underinvesting in growth, not winning — you could afford to spend more and capture more market.
- CAC payback period. Months of gross profit it takes to earn back the acquisition cost. Under 12 months is strong for SMB motions; 18–24 months is tolerable for enterprise deals with long contracts and high retention. Beyond 24 months you are effectively a lending business.
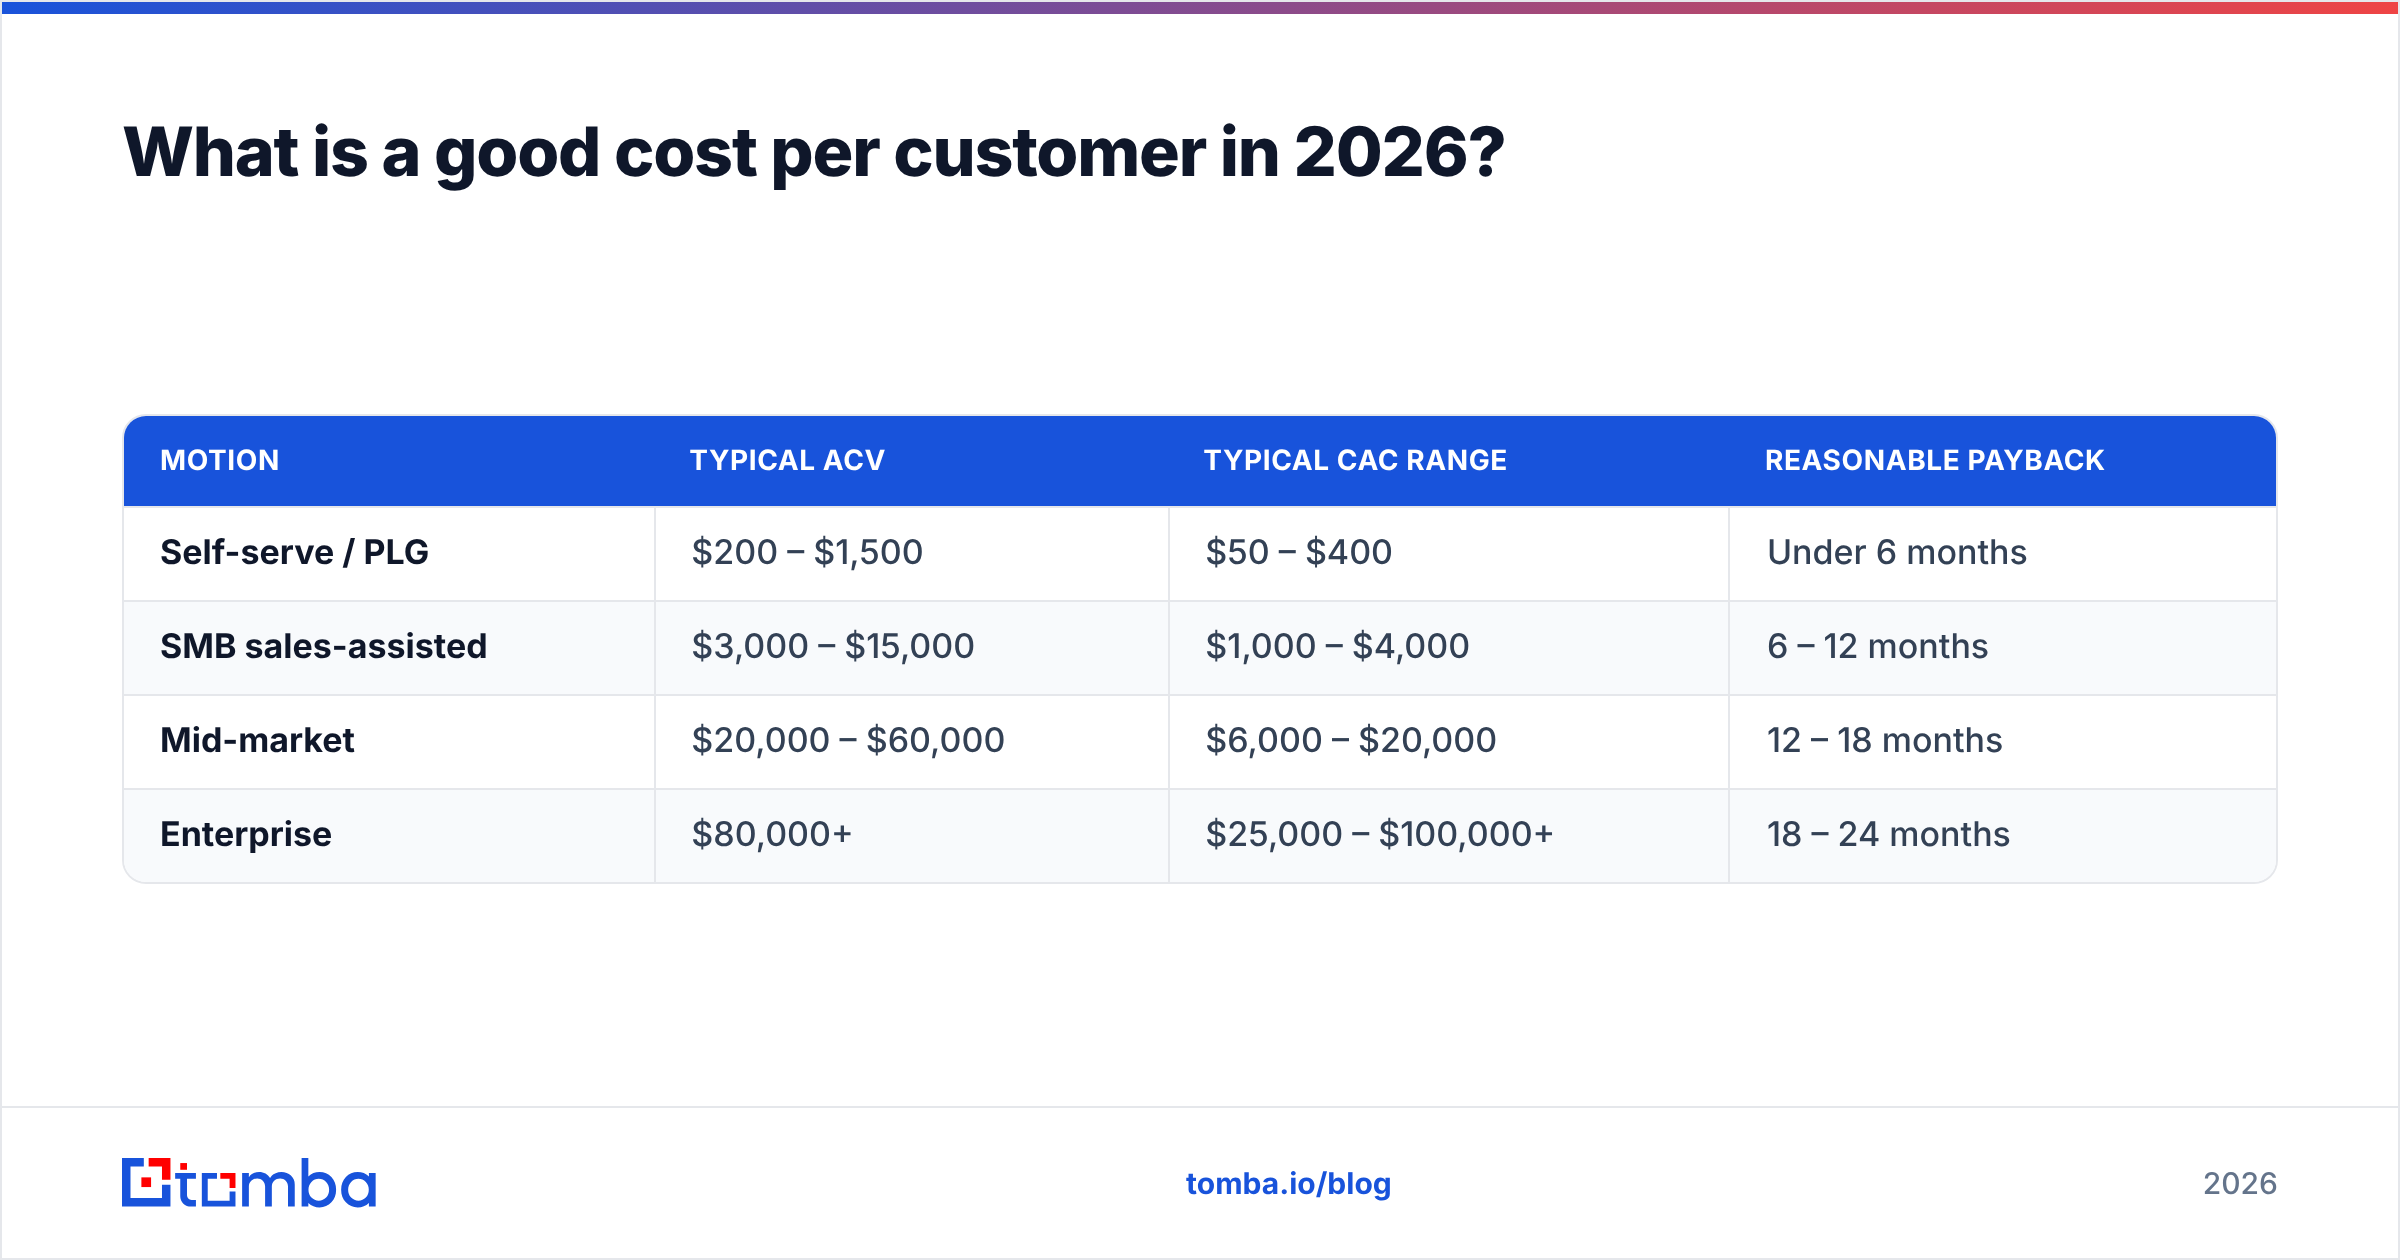
Rough shape of the market, useful only for orientation:
| Motion | Typical ACV | Typical CAC range | Reasonable payback |
|---|---|---|---|
| Self-serve / PLG | $200 – $1,500 | $50 – $400 | Under 6 months |
| SMB sales-assisted | $3,000 – $15,000 | $1,000 – $4,000 | 6 – 12 months |
| Mid-market | $20,000 – $60,000 | $6,000 – $20,000 | 12 – 18 months |
| Enterprise | $80,000+ | $25,000 – $100,000+ | 18 – 24 months |
Treat these as a smell test. If your enterprise CAC is $900, you have almost certainly excluded salaries. If your PLG CAC is $3,000, your paid channels are underwater and you should know exactly which one.
For a broader read on how efficiency benchmarks have shifted, Gartner's sales research and Forrester's B2B coverage both track the trend line most CFOs are anchoring to right now: acquisition efficiency is back under scrutiny after years of growth-at-any-cost.
Why is your real cost per customer higher than you think?#
Because the denominator is honest and the numerator lies.
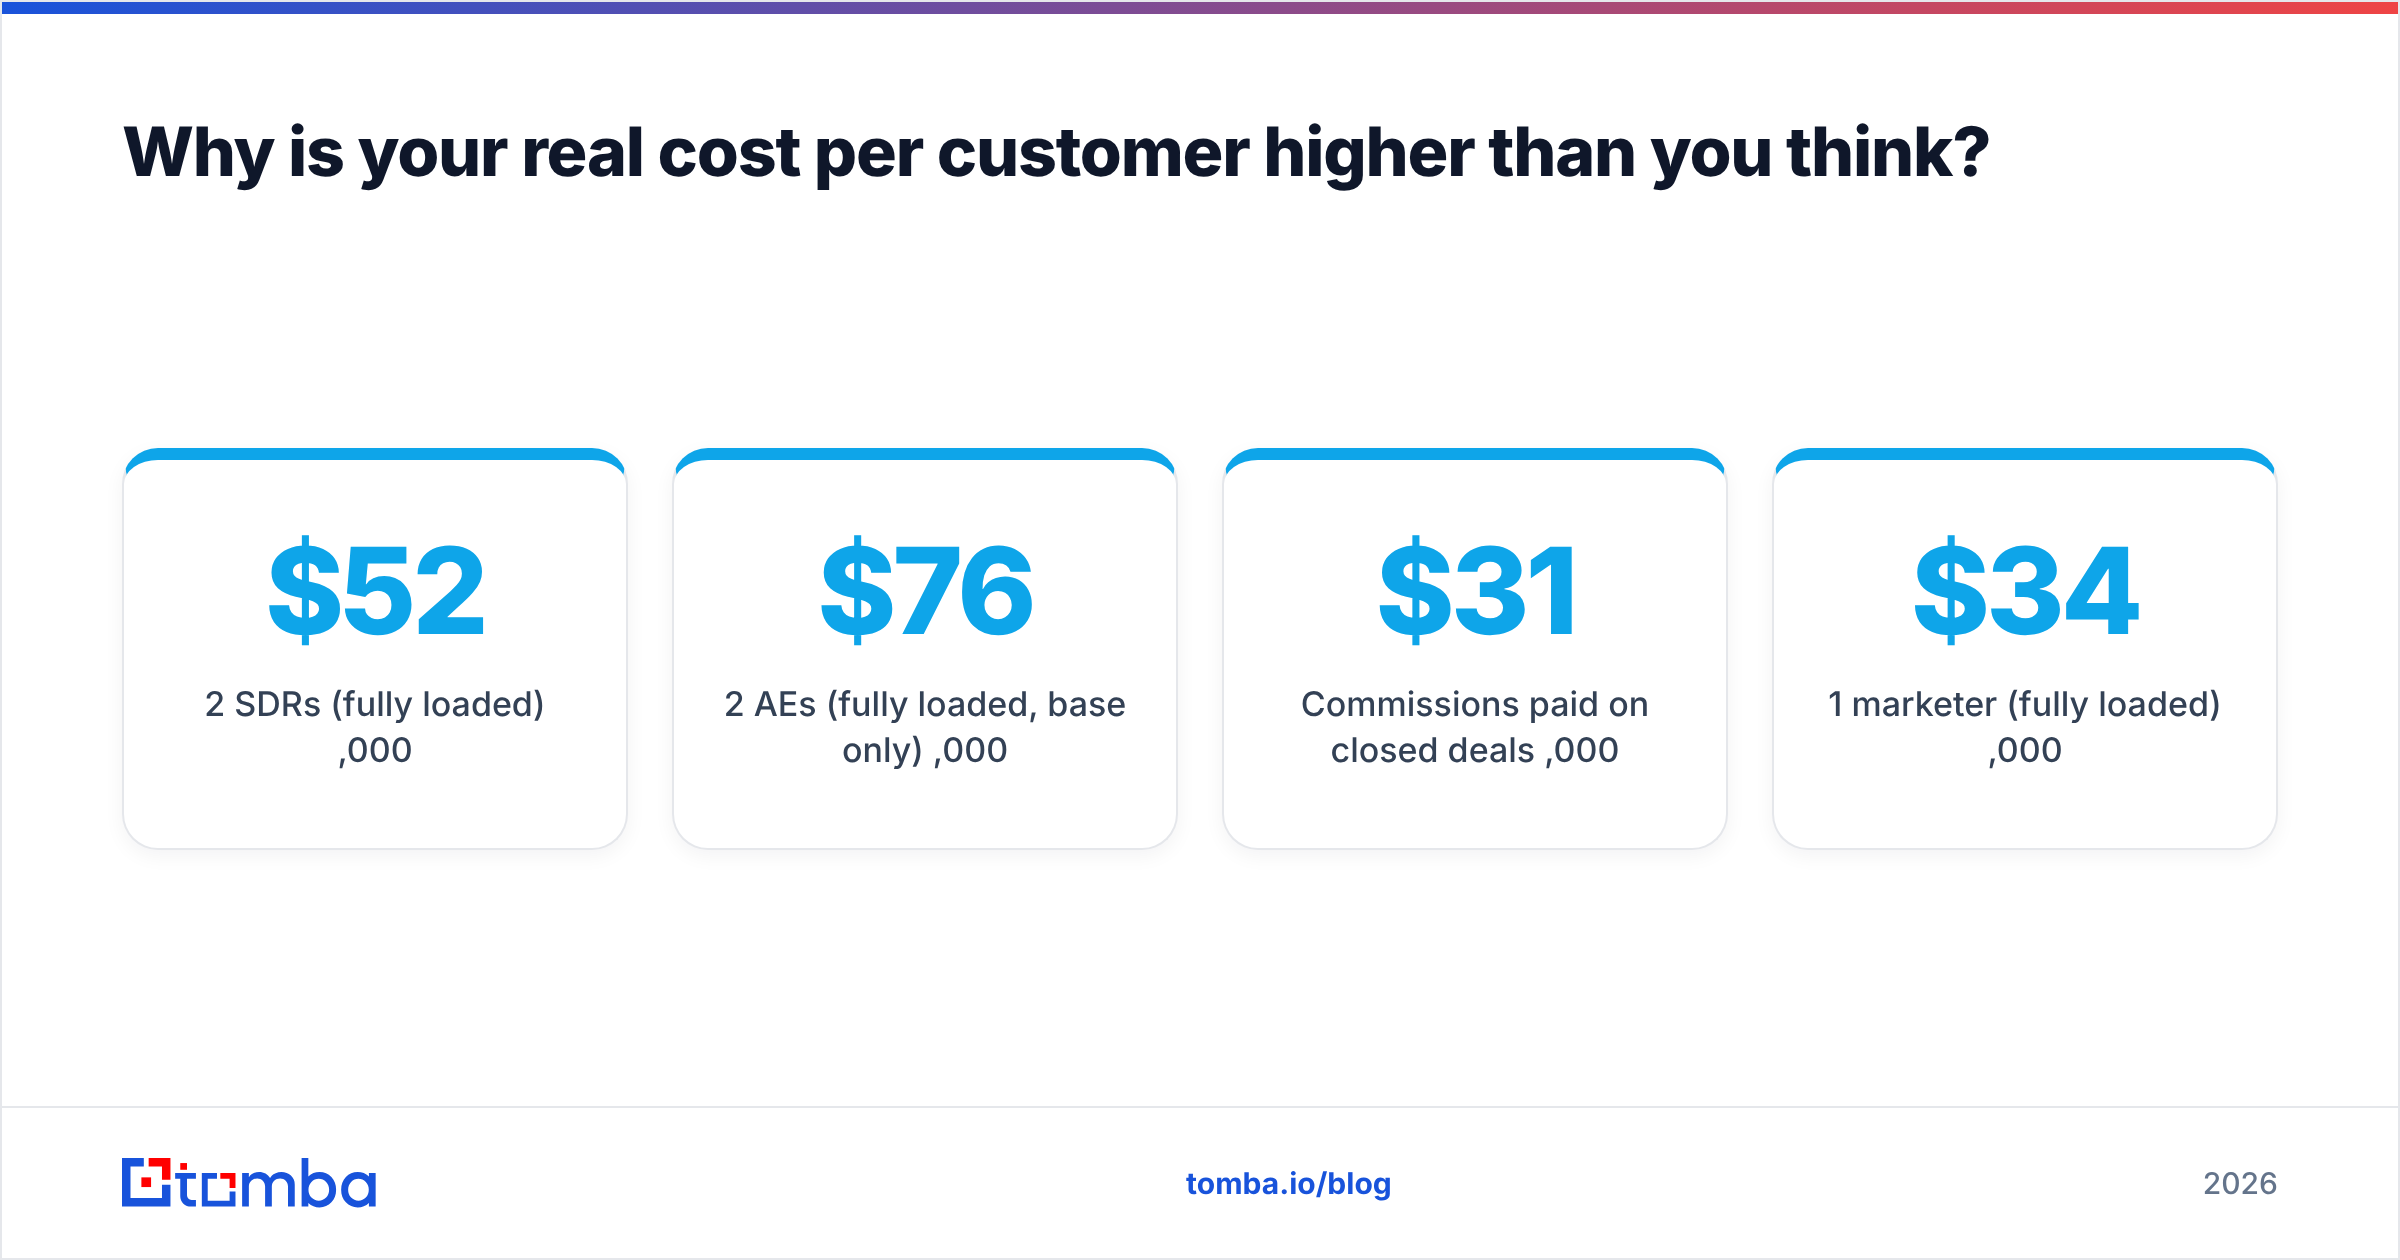
Here is a worked example. A 6-person GTM team, one quarter:
| Line item | Quarterly cost |
|---|---|
| 2 SDRs (fully loaded) | $52,000 |
| 2 AEs (fully loaded, base only) | $76,000 |
| Commissions paid on closed deals | $31,000 |
| 1 marketer (fully loaded) | $34,000 |
| Paid ads | $45,000 |
| CRM + sequencer + data tools | $9,500 |
| Content + agency retainer | $12,000 |
| Total | $259,500 |
Close 45 new customers, and the true cost per customer is $5,767.
Now the version most teams report: paid ads ($45,000) plus tools ($9,500) plus agency ($12,000), divided by 45. That's $1,478. The reported number is 26% of the real one. Every downstream decision — pricing, discount floors, channel budget, hiring plan — is made on a figure that is off by 4x.
The fix is boring and non-negotiable: agree on a definition, write it down, and make finance and RevOps use the same one. If your CRM and your P&L disagree about what counts as acquisition spend, your cost per customer is fiction.
How does bad contact data inflate cost per customer?#
This is the lever nobody puts on the slide, and it's usually the biggest one.
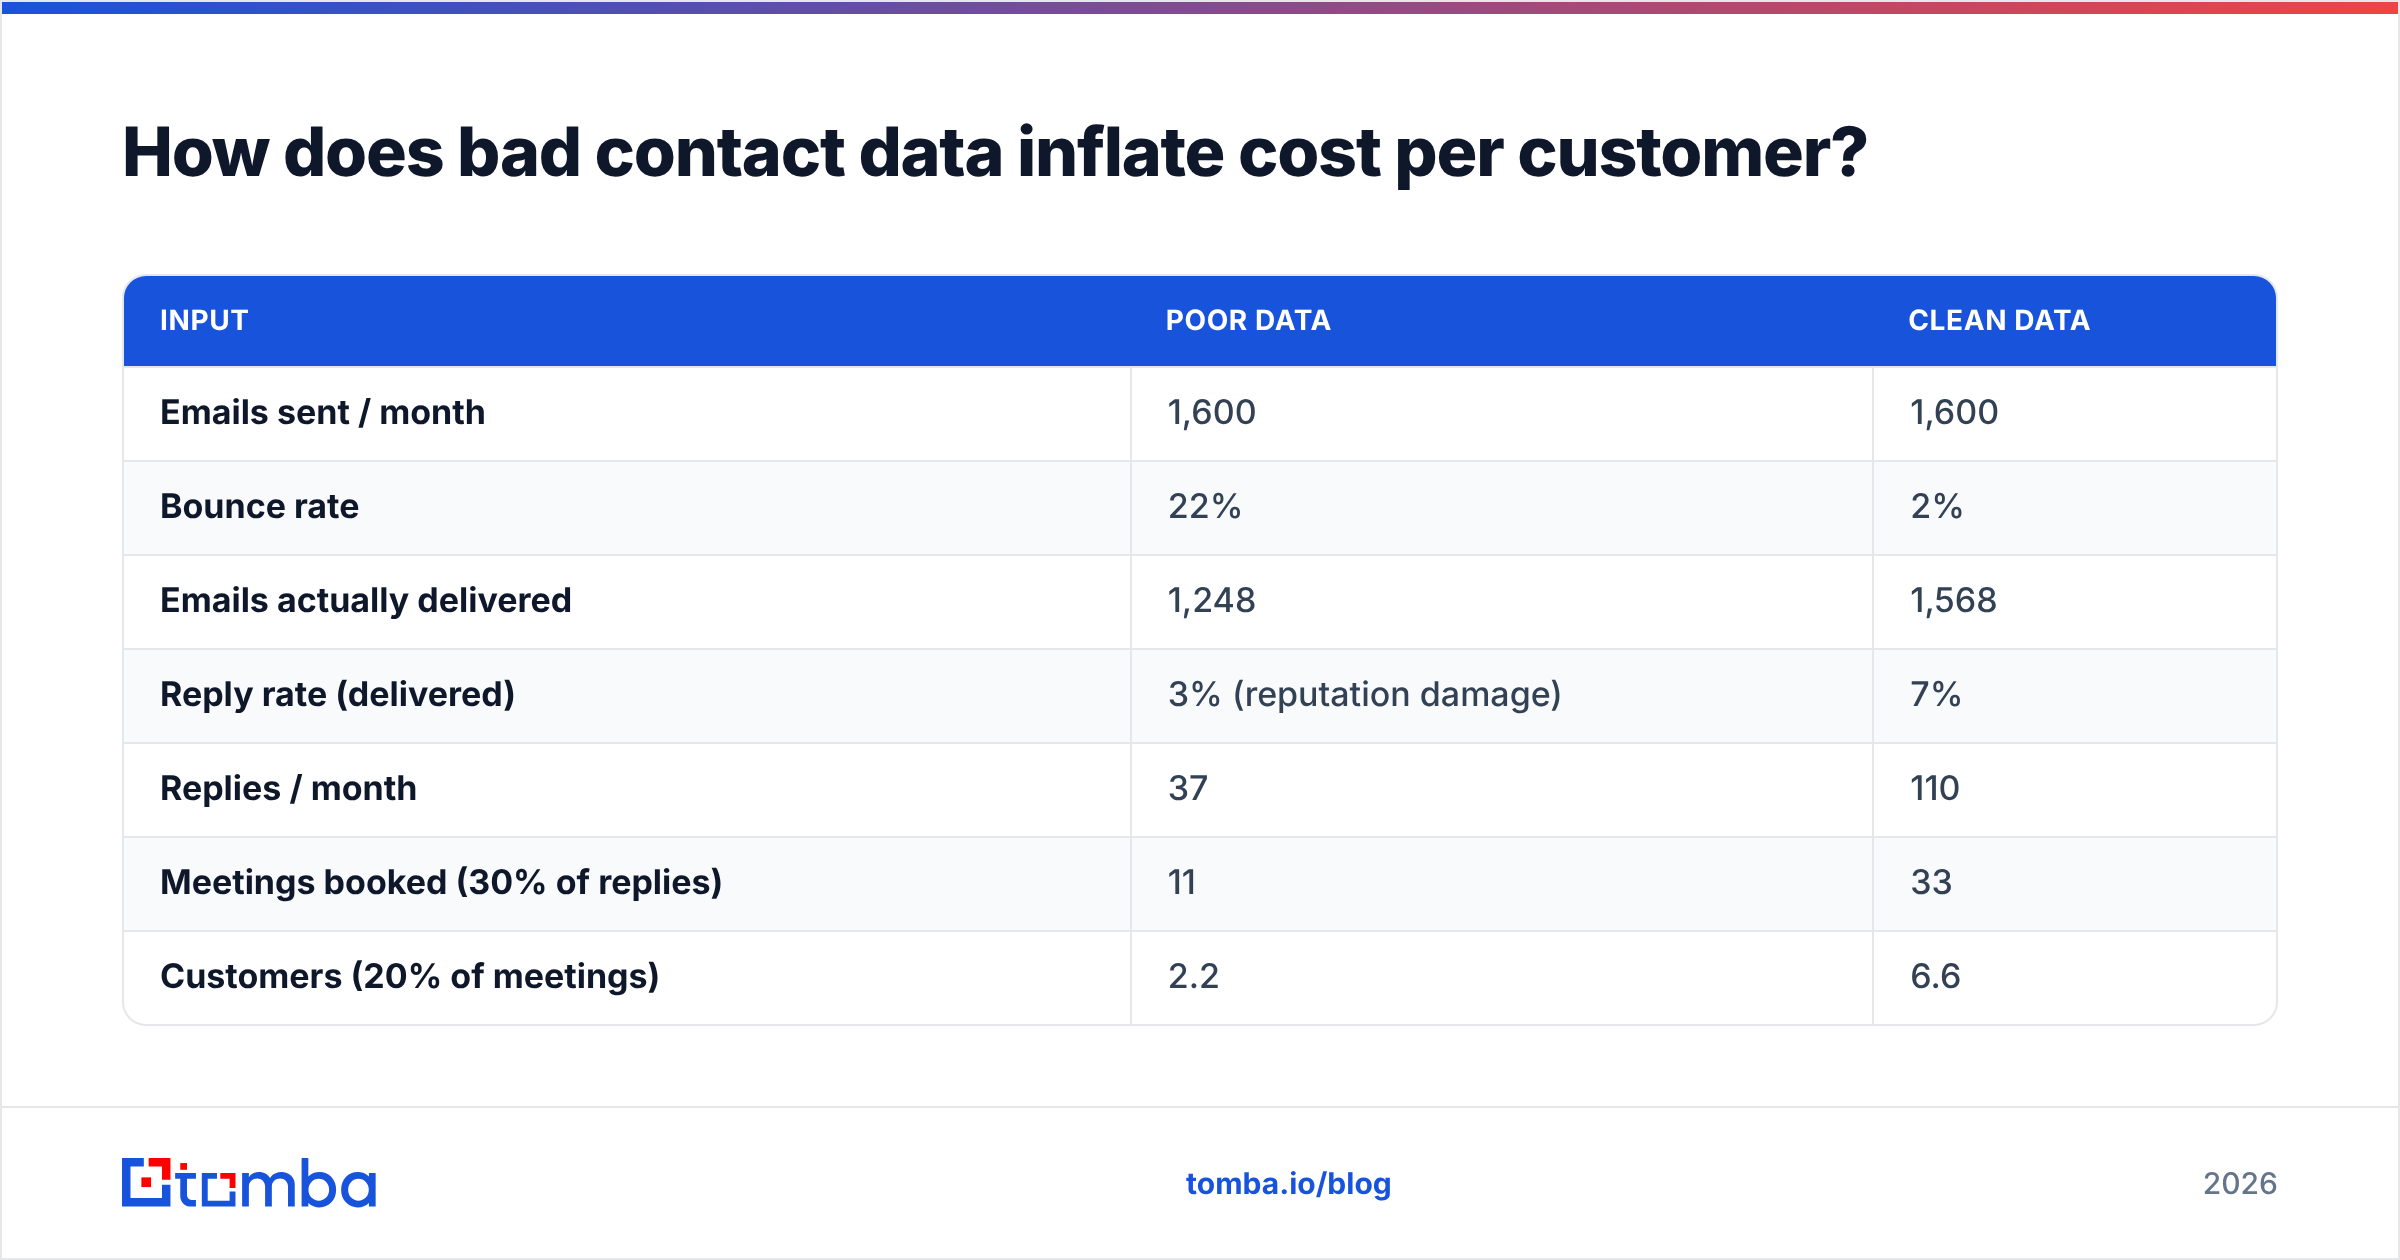
Every wasted touch is real money. An SDR sending 400 emails a week where 22% bounce isn't just losing 88 emails — they're losing the research time, the sequence slot, the sender reputation hit that suppresses deliverability for the good addresses, and eventually the domain itself. The cost shows up in the numerator (salary burned) while contributing nothing to the denominator (customers won).
Run the math on a single SDR:
| Input | Poor data | Clean data |
|---|---|---|
| Emails sent / month | 1,600 | 1,600 |
| Bounce rate | 22% | 2% |
| Emails actually delivered | 1,248 | 1,568 |
| Reply rate (delivered) | 3% (reputation damage) | 7% |
| Replies / month | 37 | 110 |
| Meetings booked (30% of replies) | 11 | 33 |
| Customers (20% of meetings) | 2.2 | 6.6 |
| SDR fully loaded cost / month | $8,600 | $8,600 |
| SDR cost per customer | $3,909 | $1,303 |
Same salary. Same effort. Three times the cost per customer, purely because the list was dirty. And the reply-rate collapse is not hypothetical — high bounce rates directly damage email deliverability, which throttles the inbox placement of every message that follows.
The remedy is unglamorous: verify before you send. Run every list through an email verifier, handle catch-all domains explicitly with a catch-all verifier rather than guessing, and source addresses from a system that returns a confidence score instead of a permutation guess. Tools like Tomba's email finder, Hunter, and peers such as BookYourData all attack the same problem from different angles — verified sourcing at the top of the funnel, so you stop paying salaries to bounce.
Which levers actually reduce cost per customer?#
Four, in rough order of speed-to-impact.
Fix data quality first. It's the fastest lever because it requires no headcount, no repositioning, and no new channel. Verified contact data raises delivered volume and protects reply rates simultaneously — both sides of the funnel improve from one change. Budget for it: verification costs cents per record against SDR salaries that cost dollars per touch.
Disqualify earlier and harder. The most expensive lead is the one an AE spends five calls on before discovering there was never budget. Tighten your qualification criteria at the MQL boundary, and give SDRs explicit permission to kill deals. A team that disqualifies 40% of inbound in week one has a lower CAC than one that nurtures everything to the bitter end.
Shorten the sales cycle. Cost per customer is time multiplied by burn rate. Every week a deal sits in pipeline consumes AE hours you're paying for. Multi-threading early (three contacts per account, not one), sending the pricing conversation forward instead of hiding it, and pre-empting the security review all compress the cycle. A 90-day cycle cut to 60 days drops the AE cost component by a third.
Rebalance channel mix. Compute CAC per channel, not just in aggregate. Almost every team discovers one channel is subsidizing another. Referrals and content typically carry the lowest CAC and the highest LTV; paid search is often the most expensive and the least loyal. You cannot rebalance what you haven't measured separately.
What does not reliably reduce cost per customer, despite being the first suggestion in every meeting: cutting ad spend. That reduces the numerator and the denominator together, usually in the wrong ratio, and it does nothing about the structural inefficiency underneath.
How do you track cost per customer without drowning in spreadsheets?#
Three requirements, in order:
- One definition, written down. A single doc that says exactly which cost lines count, which don't, and how you attribute. Circulate it to finance. Get a signature if you have to.
- A consistent time window. Monthly is too noisy for anything but PLG. Quarterly is right for most B2B. Match your lag: if your sales cycle is 90 days, this quarter's customers were paid for last quarter — offset the numerator accordingly or you'll misread every trend.
- Segmentation from day one. By channel, by segment, by product line. Aggregate CAC hides everything actionable. The moment you split it, the underperforming channel becomes obvious.
Wire it into whatever CRM you're already running. HubSpot and Salesforce both support custom CAC reporting natively — HubSpot's revenue reporting docs cover the attribution setup, and it's worth an afternoon to configure properly rather than rebuilding the number in a spreadsheet every quarter. Data feeds and enrichment can push straight into the CRM through standard integrations, so the spend side and the customer side live in the same system.
The one thing to resist: a dashboard with eleven CAC variants. Pick blended CAC for the board, paid CAC for channel decisions, and LTV:CAC for strategy. Three numbers. Anything more and nobody looks at any of them.
What should you do this week?#
Start with an audit, not a strategy.
- Pull last quarter's actual GTM spend from the P&L — not the marketing budget, the P&L. Include every salary.
- Count new customers won in the same window, offset by your sales cycle length.
- Divide. Write the number down. It will be higher than you expected.
- Then check your bounce rate. If it's above 3%, you've found a lever worth more than any campaign you're about to launch.
Cost per customer isn't a metric you optimize once. It's a diagnostic that tells you where the waste sits, and in most B2B teams the waste sits in the top of the funnel: unverified contacts, unqualified leads, and salaries spent on both.
If dirty data is inflating your acquisition cost — and for most outbound teams it is — start at the source. The Tomba Email Finder returns verified, confidence-scored business emails by domain or name, so your SDRs spend their hours on contacts that actually exist. The free tier gives you 25 searches a month to test the accuracy against your current list; paid plans start at $49/mo, with full Tomba pricing available if you need bulk volume or API access. Fix the input, and the cost per customer follows.
Related guides#
Ready to find emails that actually work?
Join 150,000+ professionals who stopped guessing and started sending. Free credits on signup — no credit card required.
Get the Tomba newsletter
Practical outbound tactics and product updates — once every two weeks.
About the author