Cost Per Customer Formula: How to Calculate CAC Correctly
Most teams calculate cost per customer wrong, then build a budget on the result. Here is the exact formula, the costs people forget, the benchmarks for 2026, and how to fix the number instead of hiding it.
TL;DR
- The core cost per customer formula is
Total acquisition cost ÷ New customers acquiredover the same time window. Everything hard about it lives in the word "total." - Most teams under-report by 30-60% because they exclude salaries, tooling, agency fees, and the cost of the data that fed the campaign.
- Blended CAC (all spend, all customers) and paid CAC (paid spend, paid-attributed customers) answer different questions. Report both or you will mislead yourself.
- A healthy B2B SaaS target is roughly 3:1 LTV:CAC with payback under 12-18 months. Below 1:1 you are buying revenue at a loss.
- The fastest lever on CAC is rarely "spend less." It is usually contacting fewer wrong people — bad contact data inflates the denominator's cost without adding customers.
What is the cost per customer formula?#
The base formula is short:
Cost Per Customer (CAC) = Total Acquisition Costs ÷ New Customers AcquiredBoth terms must cover the same period. If you spent $60,000 in Q1 and closed 40 new customers in Q1, your cost per customer is $1,500.
That is the version on every slide deck. It is also the version that quietly lies to you, because "total acquisition costs" is a judgment call and most teams make that call generously in their own favor. Think of it like a restaurant reporting the cost of a steak as the price of the beef — ignoring the chef, the gas, the plate, and the two steaks that got sent back.
A defensible version looks like this:
CAC = (Paid media + Sales salaries + Marketing salaries
       + Tools & data + Agencies/contractors + Content production
       + Commissions & bonuses + Overhead allocation)
      ÷ New customers closed in the period
Run it with a 30-90 day lag on the denominator if your sales cycle is long. Spend in January rarely converts in January.
Which costs belong in the numerator?#
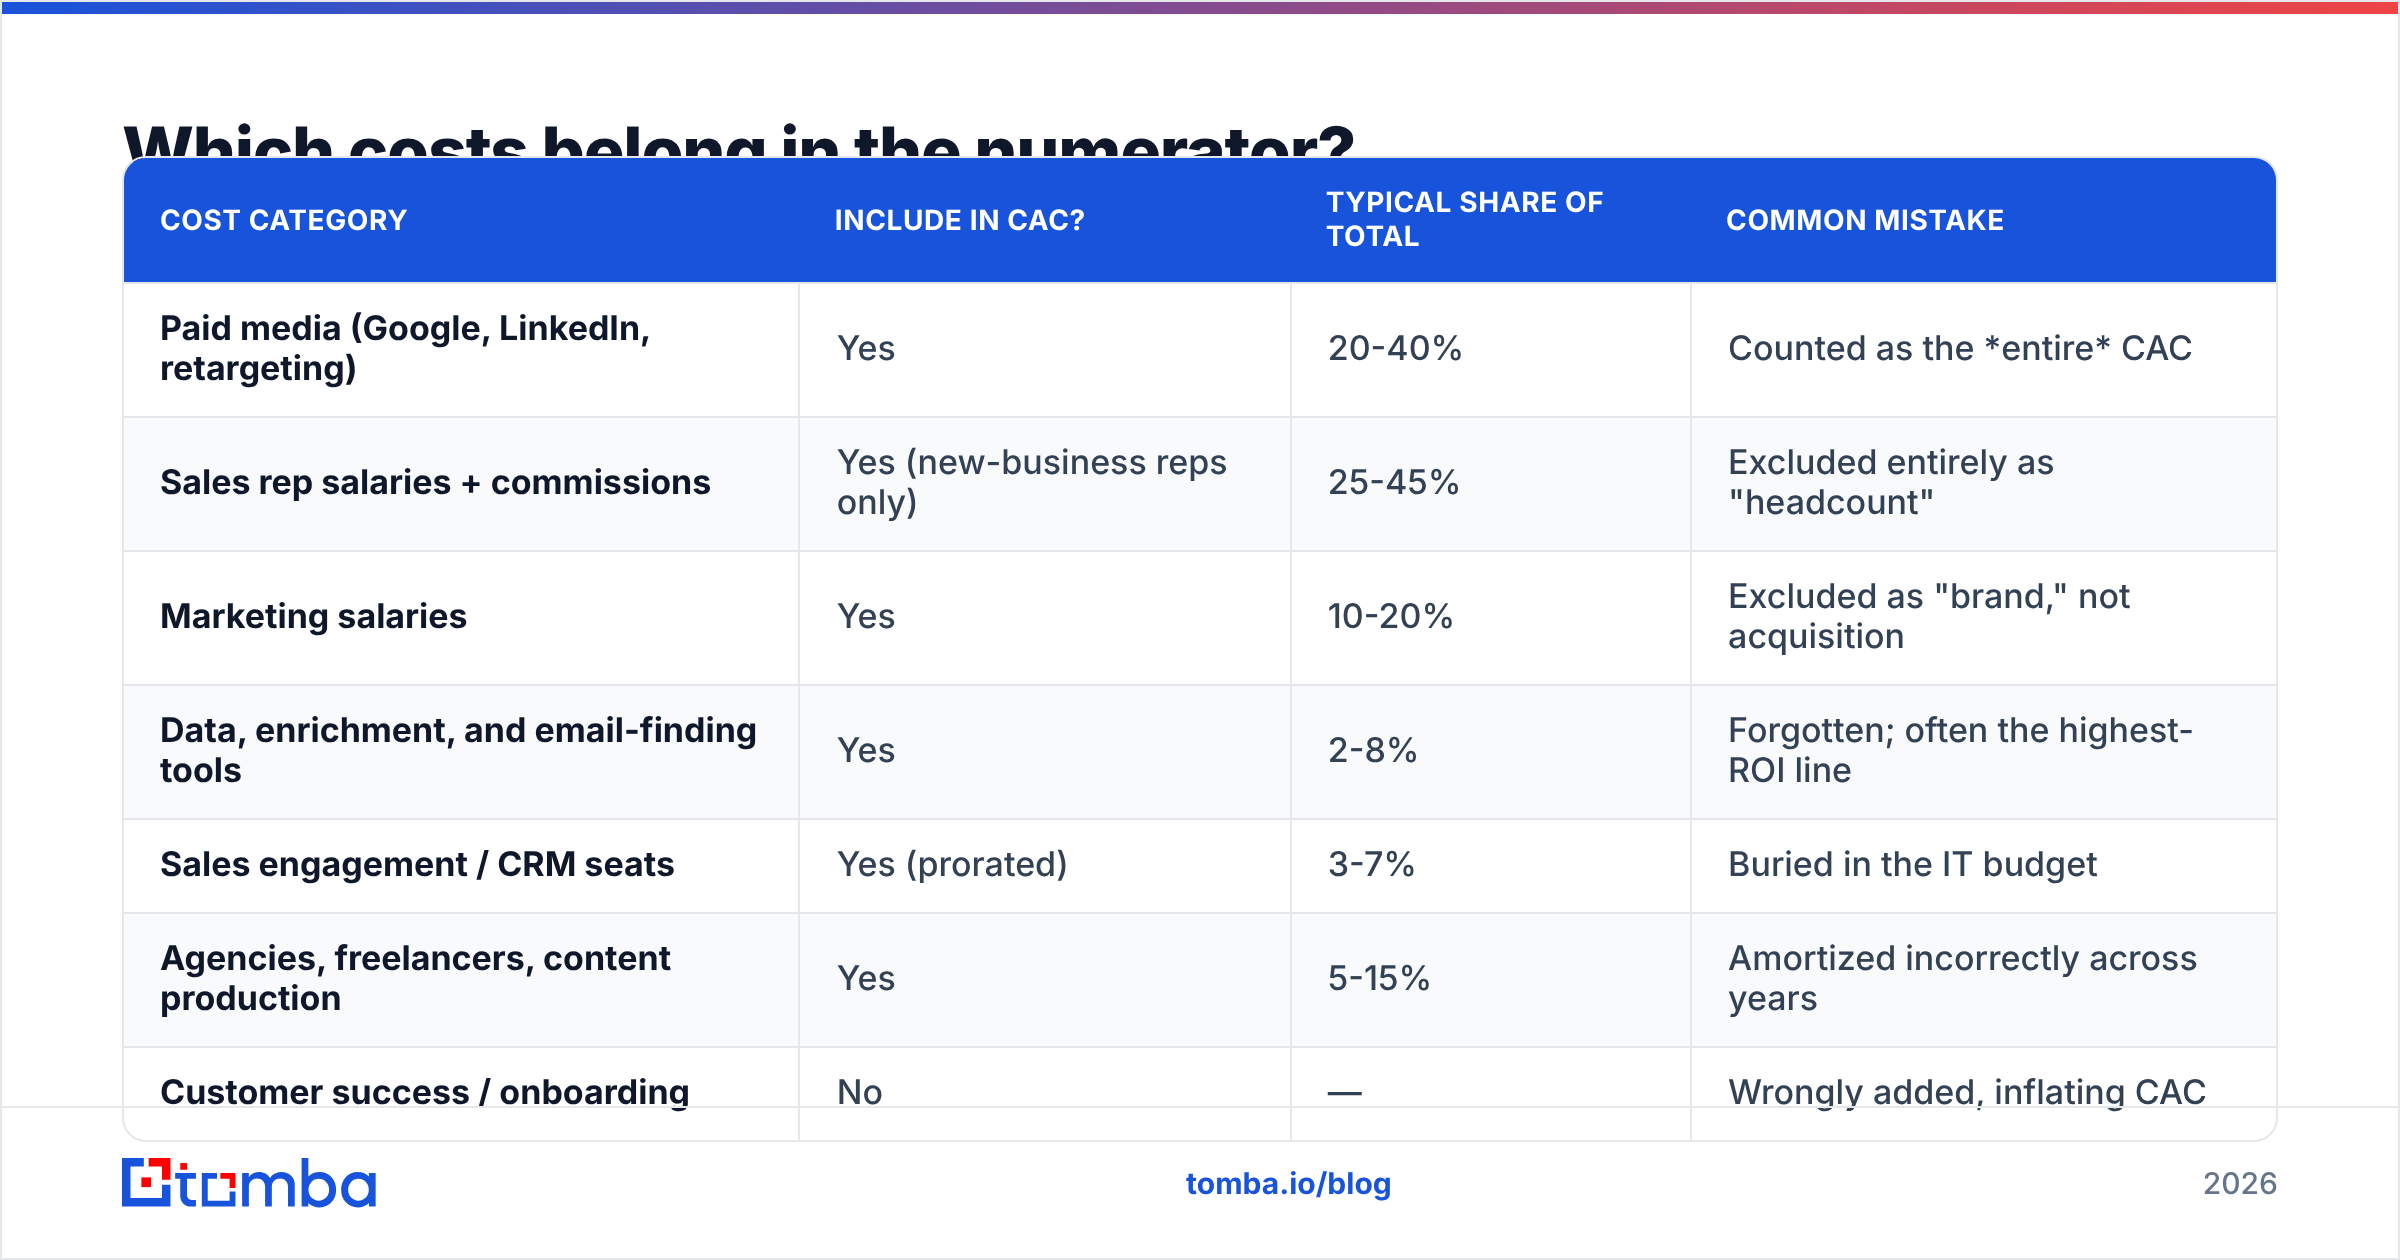
This is where the number is won or lost. Use the table below as a checklist — if a line item exists to get a new customer, it counts. If it exists to keep one, it is retention cost, not acquisition cost.
| Cost category | Include in CAC? | Typical share of total | Common mistake |
|---|---|---|---|
| Paid media (Google, LinkedIn, retargeting) | Yes | 20-40% | Counted as the entire CAC |
| Sales rep salaries + commissions | Yes (new-business reps only) | 25-45% | Excluded entirely as "headcount" |
| Marketing salaries | Yes | 10-20% | Excluded as "brand," not acquisition |
| Data, enrichment, and email-finding tools | Yes | 2-8% | Forgotten; often the highest-ROI line |
| Sales engagement / CRM seats | Yes (prorated) | 3-7% | Buried in the IT budget |
| Agencies, freelancers, content production | Yes | 5-15% | Amortized incorrectly across years |
| Customer success / onboarding | No | — | Wrongly added, inflating CAC |
| Expansion/upsell spend | No | — | Belongs in NRR math, not CAC |
| Free-trial infrastructure | Partially | 1-3% | All-or-nothing treatment |
Two rules keep this honest:
- Fully loaded, always. A rep's $90k base plus benefits, laptop, and a $200/month tool stack is not $90k. It is closer to $115k. Apply a 1.25-1.3x loading factor.
- Split, don't guess. If an AE spends 70% of their time on new logos and 30% on renewals, only 70% of their loaded cost enters CAC.
Blended CAC vs paid CAC: which number should you report?#
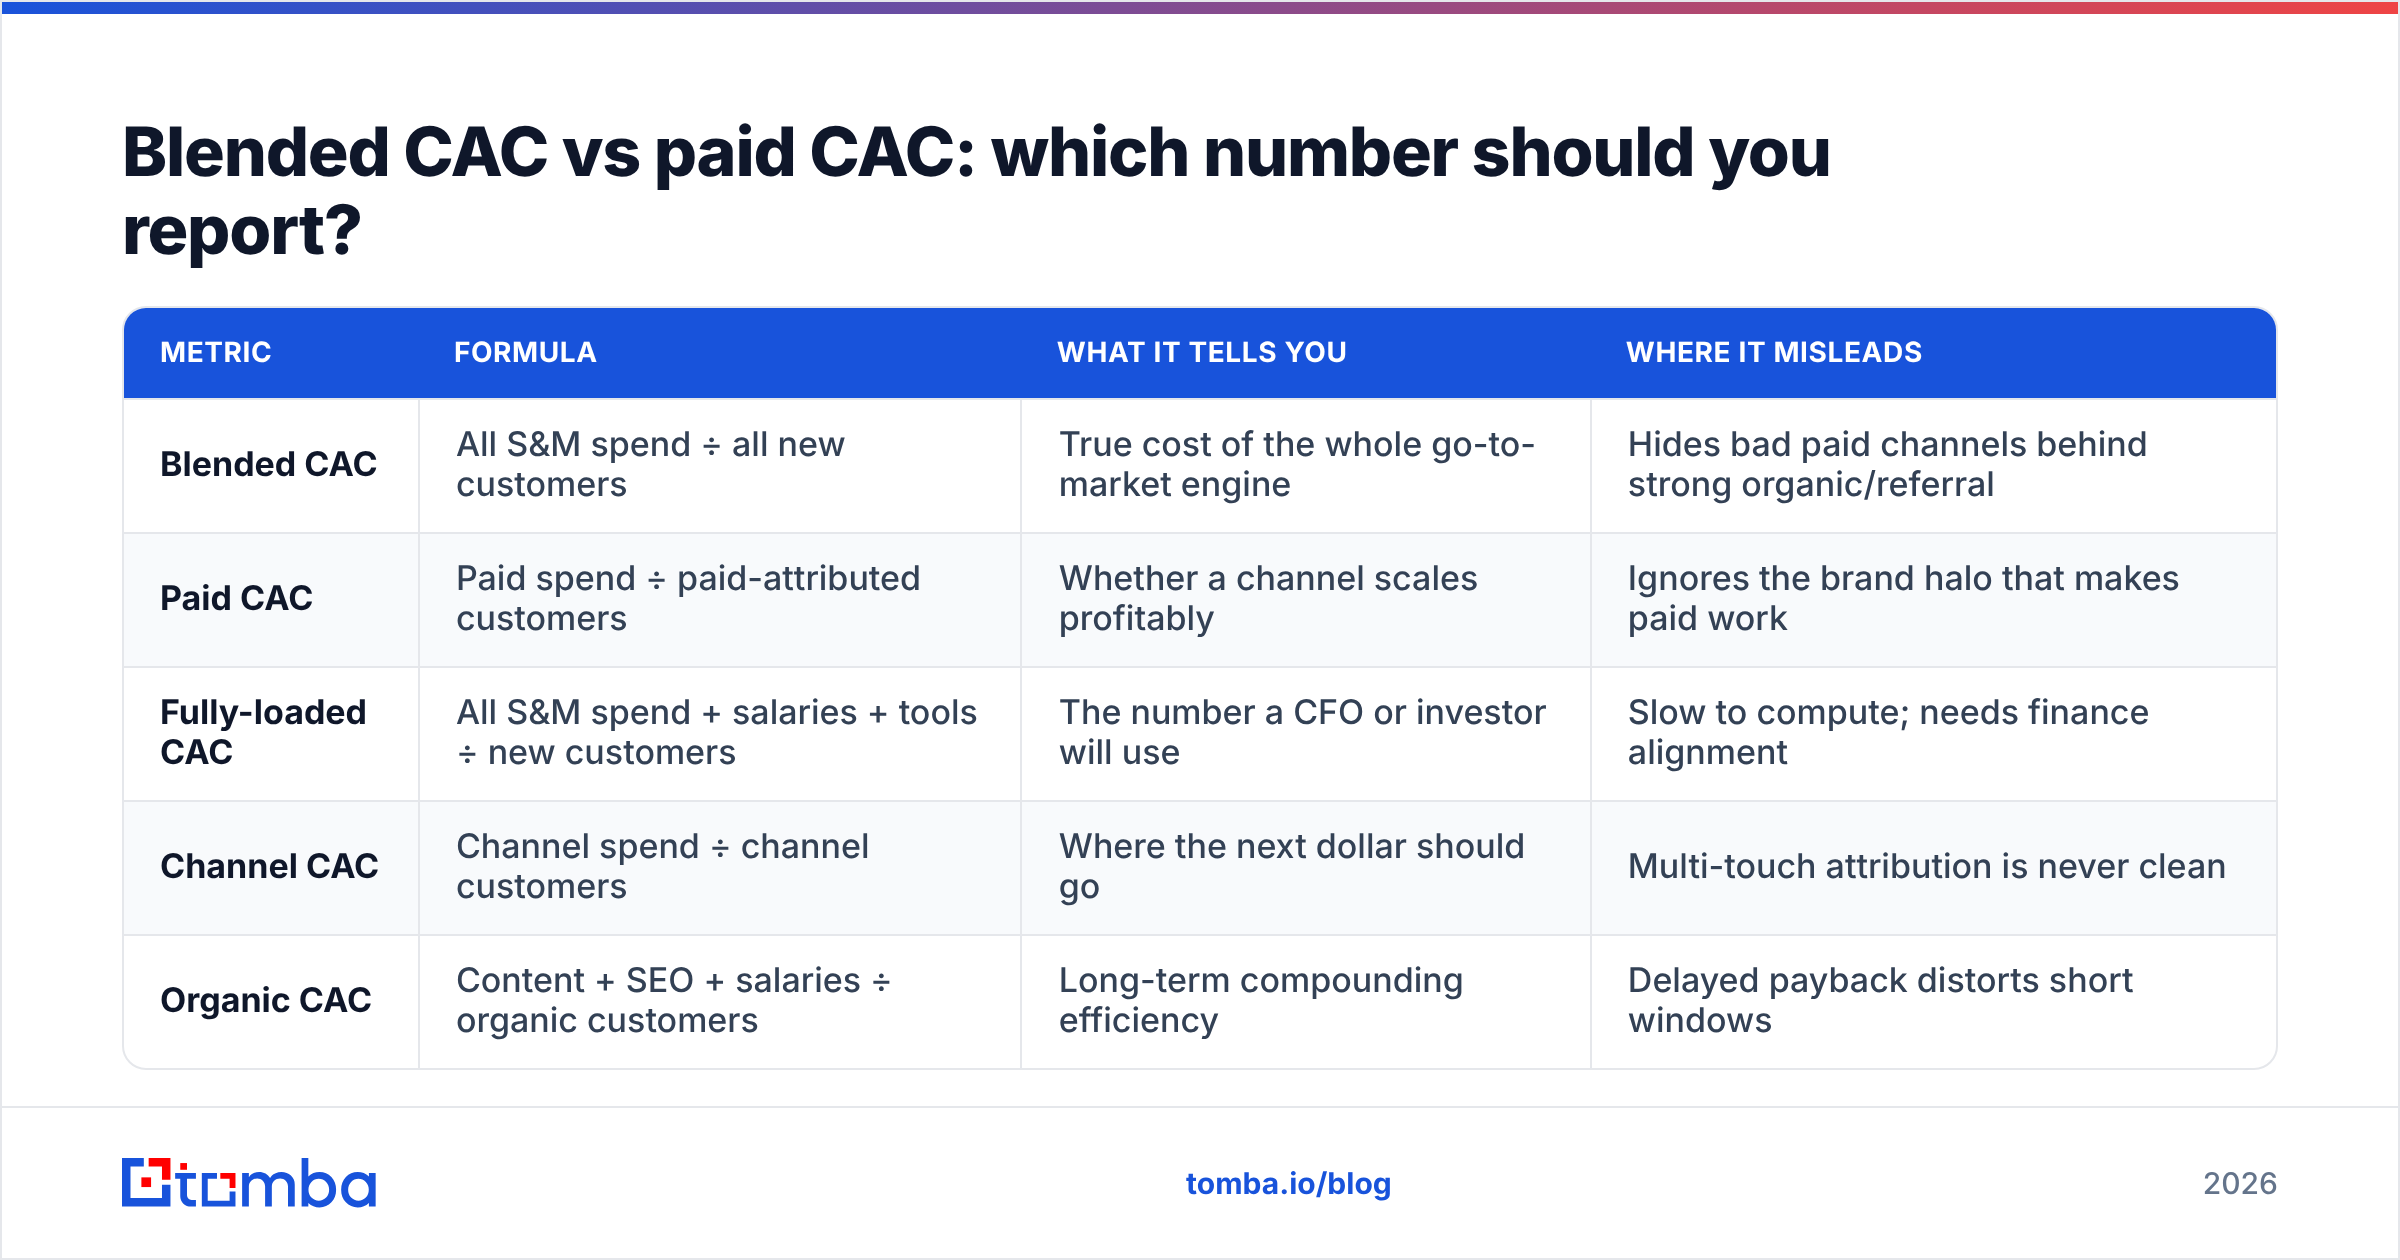
Both. They answer different questions and reporting only one is how boards get surprised.
| Metric | Formula | What it tells you | Where it misleads |
|---|---|---|---|
| Blended CAC | All S&M spend ÷ all new customers | True cost of the whole go-to-market engine | Hides bad paid channels behind strong organic/referral |
| Paid CAC | Paid spend ÷ paid-attributed customers | Whether a channel scales profitably | Ignores the brand halo that makes paid work |
| Fully-loaded CAC | All S&M spend + salaries + tools ÷ new customers | The number a CFO or investor will use | Slow to compute; needs finance alignment |
| Channel CAC | Channel spend ÷ channel customers | Where the next dollar should go | Multi-touch attribution is never clean |
| Organic CAC | Content + SEO + salaries ÷ organic customers | Long-term compounding efficiency | Delayed payback distorts short windows |
A concrete example. A 20-person B2B SaaS company spends, in one quarter:
- $45,000 paid media
- $120,000 loaded sales salaries (new business only)
- $60,000 loaded marketing salaries
- $9,000 tools, data, and enrichment
- $16,000 agency and content
Total: $250,000. They closed 62 new customers, 21 of them from paid.
- Blended, fully-loaded CAC = $250,000 ÷ 62 = $4,032
- Paid CAC (media only) = $45,000 ÷ 21 = $2,143
- Paid CAC (media + prorated headcount) = ~$3,100
The $2,143 number is the one that ends up in the growth deck. The $4,032 number is the one that determines whether the company survives. Report the honest one and annotate the optimistic one.
How does CAC connect to LTV and payback?#
CAC alone is meaningless. A $10,000 CAC is excellent if the customer pays you $200,000 over five years, and catastrophic if they churn at month four.
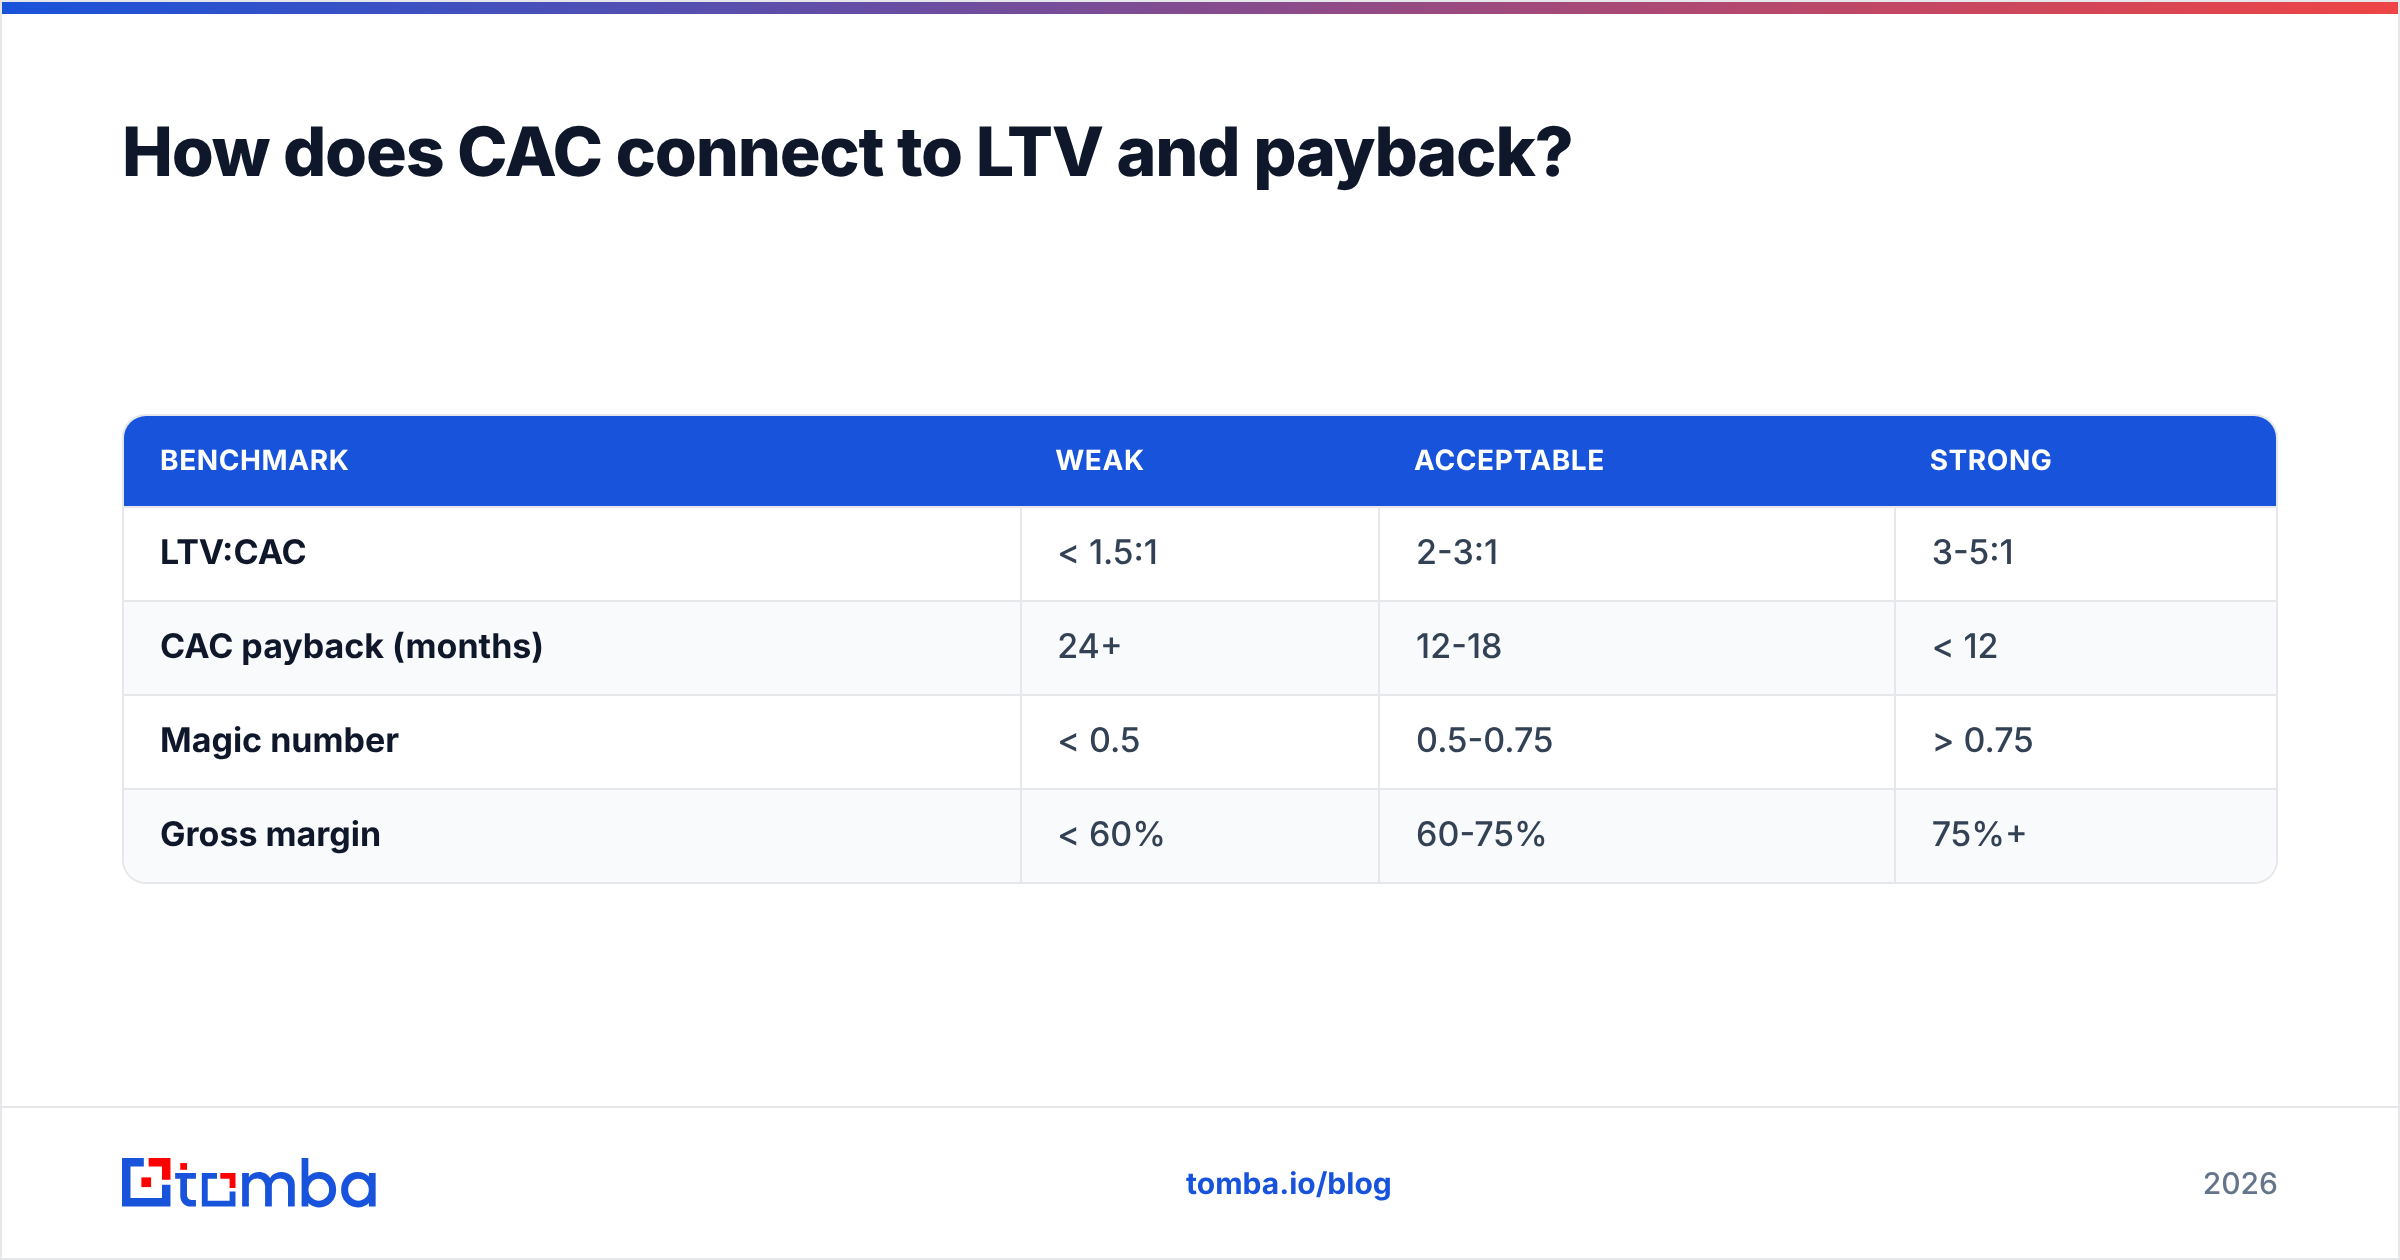
The three ratios that matter:
- LTV:CAC ratio —
Lifetime value ÷ CAC. Below 1:1 you lose money on every customer. Around 3:1 is the widely used healthy benchmark for B2B SaaS. Above 5:1 you are probably underspending and leaving growth on the table. - CAC payback period —
CAC ÷ (Monthly gross-margin revenue per customer). Under 12 months is strong, 12-18 acceptable, 24+ is a cash-flow problem regardless of how good the LTV:CAC looks on paper. - Magic number —
(This quarter's ARR − last quarter's ARR) × 4 ÷ last quarter's S&M spend. Above 0.75 means you can push the accelerator.
| Benchmark | Weak | Acceptable | Strong |
|---|---|---|---|
| LTV:CAC | < 1.5:1 | 2-3:1 | 3-5:1 |
| CAC payback (months) | 24+ | 12-18 | < 12 |
| Magic number | < 0.5 | 0.5-0.75 | > 0.75 |
| Gross margin | < 60% | 60-75% | 75%+ |
Note the interaction: gross margin sits inside payback. A company with 55% margins needs nearly twice the revenue to repay the same CAC as one at 85%. For a fuller definition of how these tie into planning, see the revenue operations glossary entry, and HubSpot's CAC breakdown for a marketing-side treatment. The customer acquisition cost entry on Wikipedia is a reasonable neutral reference for the historical definition.
Why is your real cost per customer higher than you think?#
Five leaks, roughly in order of how often they show up.
1. The denominator is padded. Free-plan signups, LOIs, and pilot accounts get counted as "customers." If it does not have a paid contract, it does not belong in the denominator. Padding the denominator is the most common way CAC gets reported 40% too low.
2. The time windows don't match. Spend from March closes in June. Comparing March spend to March closes in a 90-day sales cycle produces a number with no relationship to reality. Lag the denominator by your median cycle length.
3. Salaries live in a different spreadsheet. Finance owns headcount, marketing owns media spend, and nobody owns the sum. This is the single biggest gap between "marketing CAC" and "board CAC."
4. Wasted outreach is invisible. If your SDR sends 3,000 emails and 22% bounce, you paid for 660 sends that could never convert — in tool credits, in sender reputation, and in the rep's hours. That cost sits in CAC's numerator while contributing nothing to the denominator. Cleaning the list with an email verifier before a sequence launches is one of the few CAC levers that costs almost nothing to pull.
5. Bad data multiplies everything downstream. A 30% inaccurate contact list means 30% of your sequences, calls, ad retargeting, and rep hours are aimed at people who don't exist or don't fit. That is not a data problem, it is a CAC problem wearing a data costume.

How do you actually lower cost per customer?#
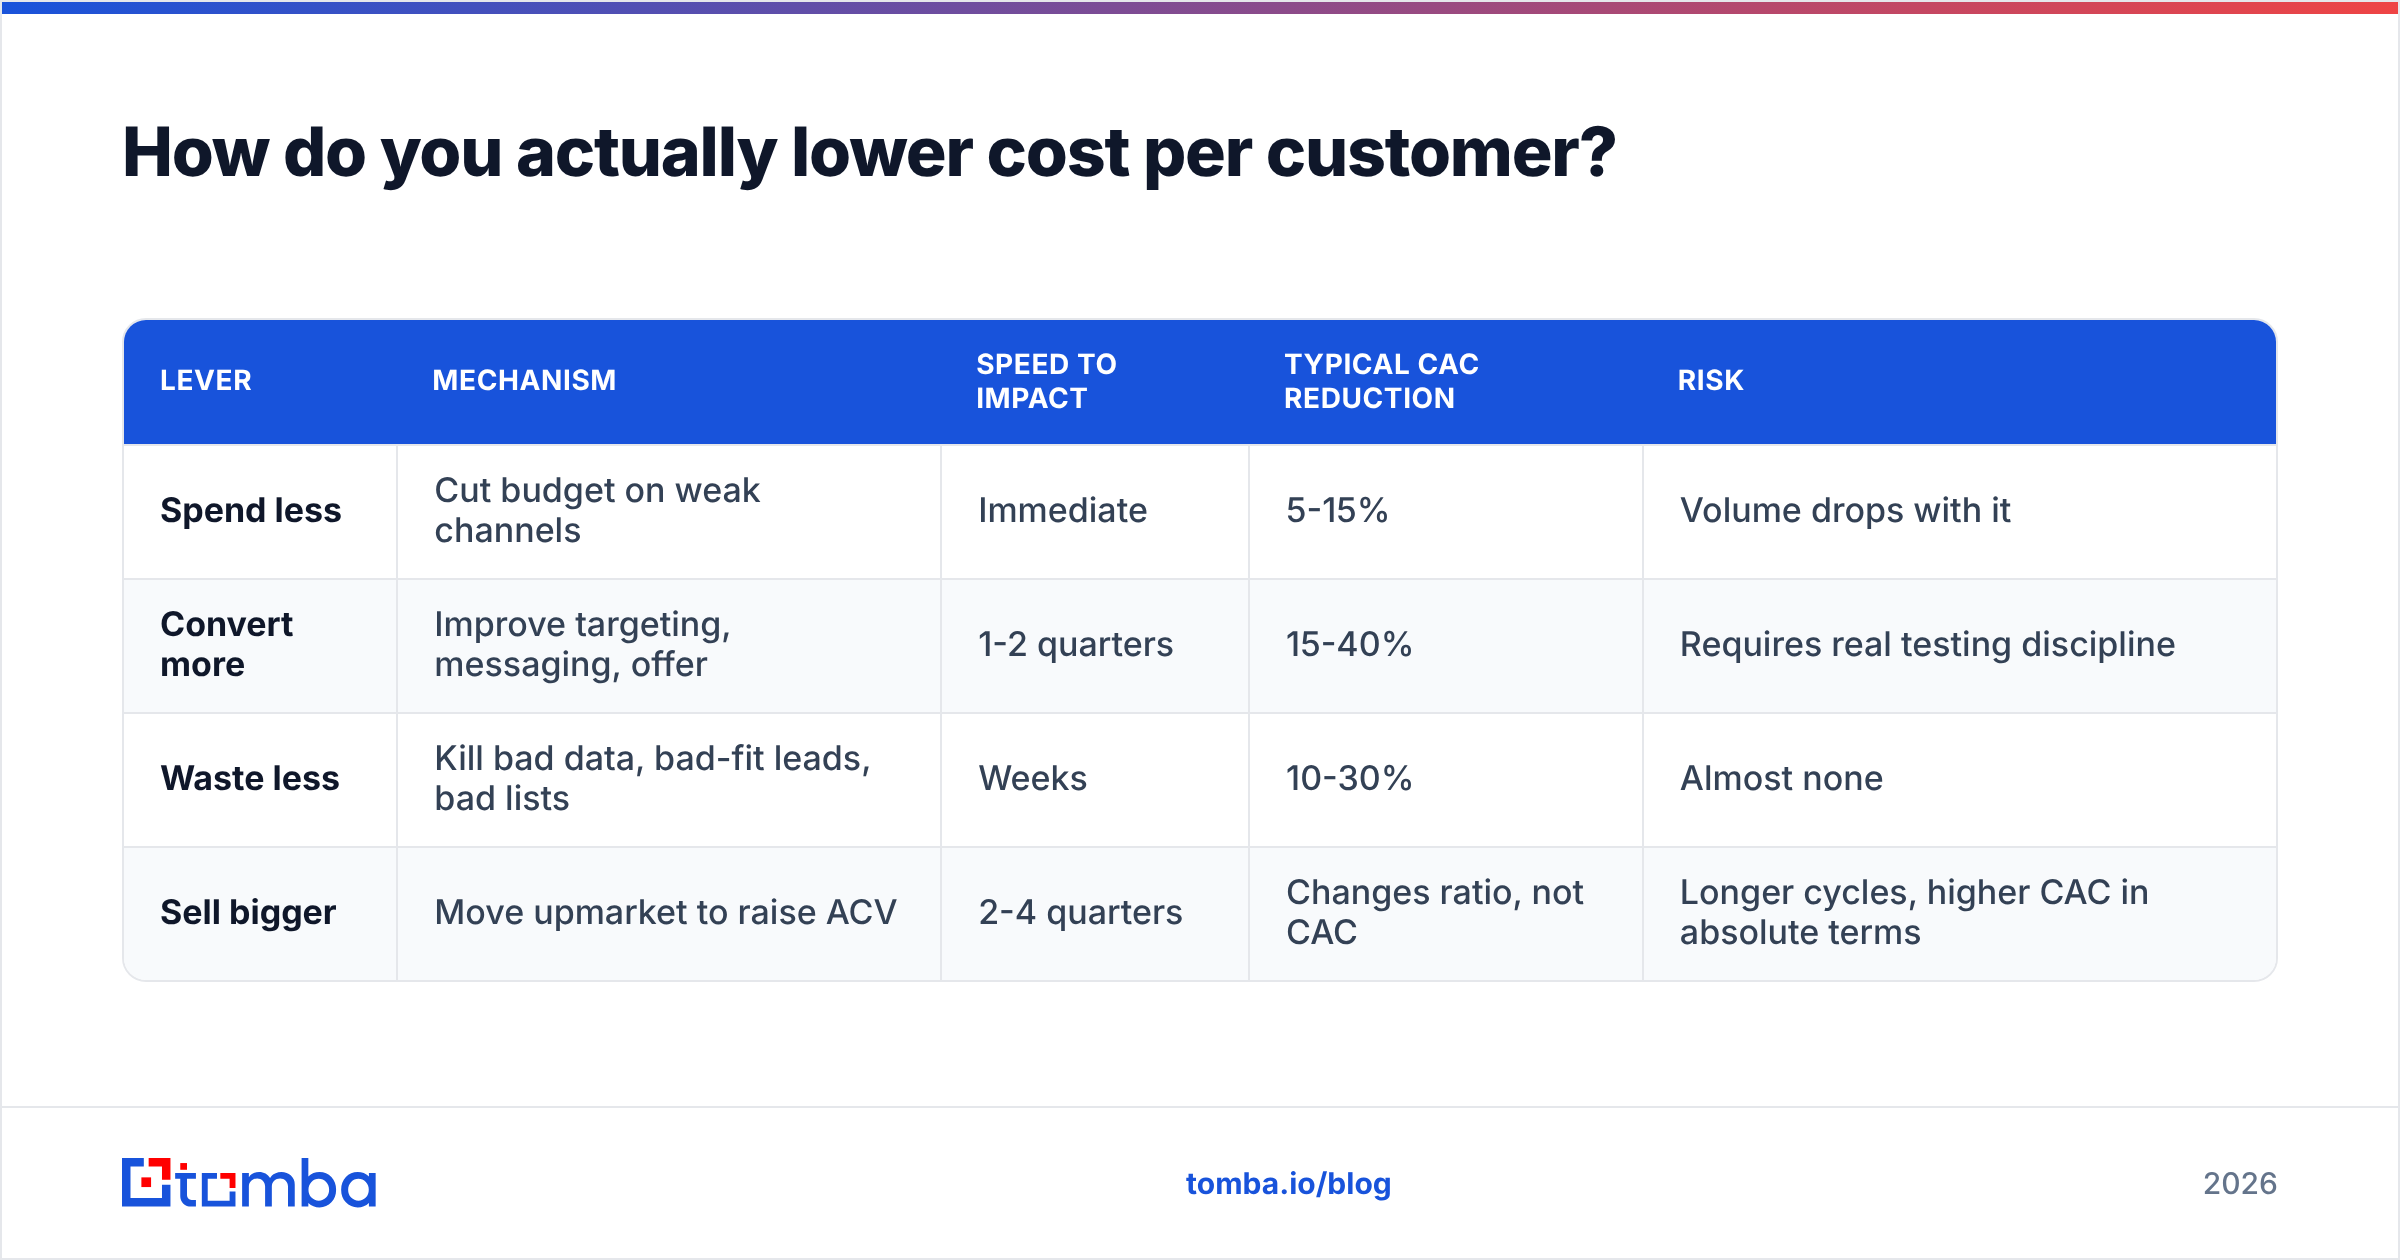
You have exactly three levers, and they are not equally easy.
| Lever | Mechanism | Speed to impact | Typical CAC reduction | Risk |
|---|---|---|---|---|
| Spend less | Cut budget on weak channels | Immediate | 5-15% | Volume drops with it |
| Convert more | Improve targeting, messaging, offer | 1-2 quarters | 15-40% | Requires real testing discipline |
| Waste less | Kill bad data, bad-fit leads, bad lists | Weeks | 10-30% | Almost none |
| Sell bigger | Move upmarket to raise ACV | 2-4 quarters | Changes ratio, not CAC | Longer cycles, higher CAC in absolute terms |
The third row is the boring one and usually the biggest. Concretely:
- Verify before you send. Bounces cost credits, reputation, and rep hours. A pre-send verification pass on every list is the cheapest CAC reduction available.
- Enrich before you route. Sending a rep an unqualified contact costs 15-40 minutes of a $115k-loaded person's time. Contact enrichment so that firmographics are attached before routing removes most of that.
- Build lists from the account, not the vendor. Domain search against a target account list produces contacts that match your ICP by construction, rather than a purchased list you have to filter after the fact.
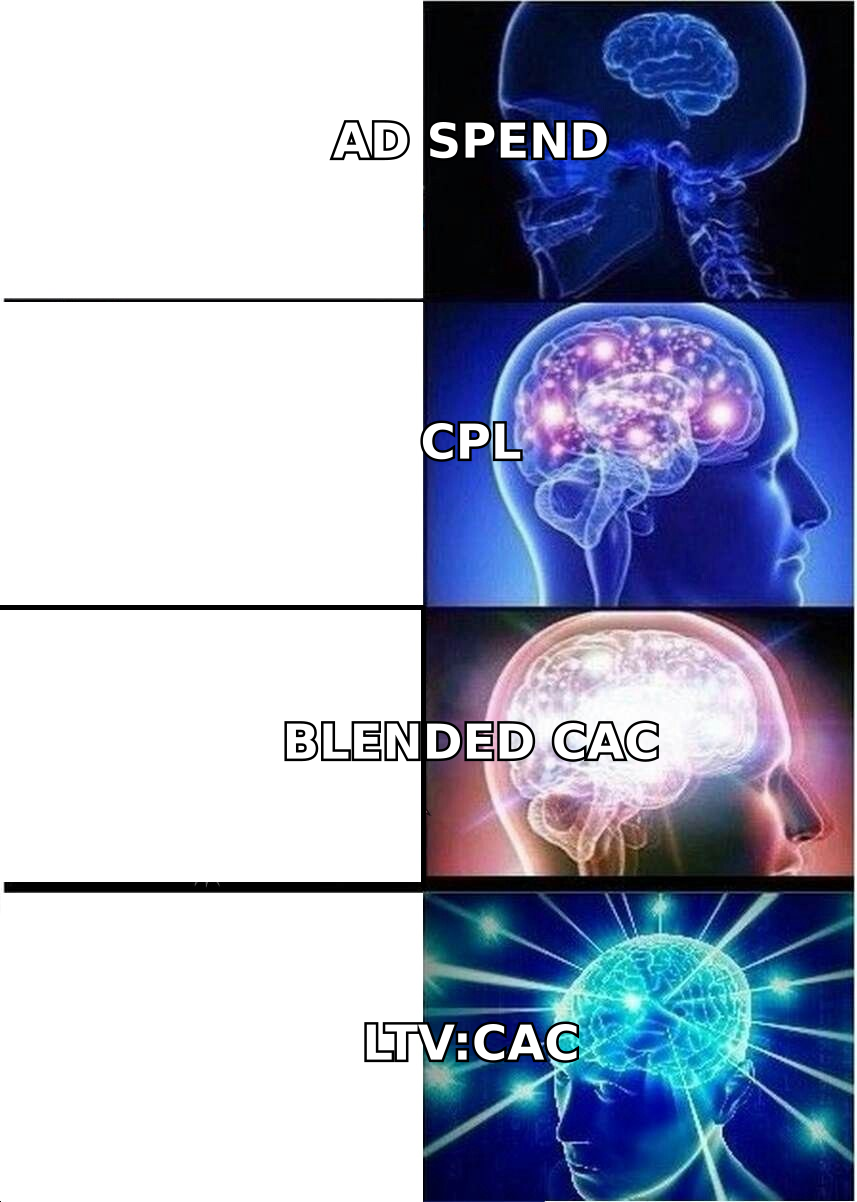
- Track cost per qualified opportunity, not cost per lead. CPL rewards volume. Cost per SQL rewards fit. The two diverge fast, and only one of them is upstream of CAC.
- Kill the channel that looks fine but isn't. Run channel CAC monthly. Any channel above 2x your blended CAC with no strategic justification should be paused, not "optimized."
- Instrument the handoff. Most CAC waste happens between MQL and first meeting. Measure the drop-off there before you touch ad spend.
What does a worked example look like?#
A 30-rep outbound team, one quarter:
- 30 SDRs × $75k loaded ÷ 4 = $562,500
- Sales tooling and CRM seats: $28,000
- Contact data and email-finding tools: $11,000
- Paid media supporting outbound: $40,000
- Management overhead allocation: $60,000
- Total: $701,500
They booked 340 meetings, which converted to 68 new customers.
CAC = $701,500 ÷ 68 = $10,316 per customer.
Now change one input. Their contact list is 74% deliverable. Bring it to 95% with verification and enrichment, and the same 30 reps reach ~28% more real inboxes with the same effort. Even assuming a conservative conversion lift, the meeting count rises to ~420 and closed customers to ~84.
New CAC = $712,500 (add $11k for the better data) ÷ 84 = $8,482.
That is an 18% CAC reduction from a line item that represents 1.5% of the budget. No headcount change, no budget cut, no new channel. The lever is proportional to how wrong your data was to begin with — which is exactly why teams with the worst data see the biggest gains and the teams with the best data see almost none.
If you want to sanity-check the tooling side of that math, Tomba pricing starts free at 25 searches/month, with paid tiers at $49, $99, and $249/month — small enough that the data line stays a rounding error in your CAC numerator while acting on the denominator. Compare that against the loaded cost of a single SDR hour and the case makes itself. Independent user reviews on G2 are a reasonable place to pressure-test any vendor's accuracy claims before you commit.
How often should you recalculate it?#
- Monthly for channel CAC and cost per SQL. These move fast and are the ones you act on.
- Quarterly for fully-loaded blended CAC. Headcount and tooling only change on a quarterly rhythm anyway, and monthly recalcs of loaded CAC produce noise that people over-interpret.
- Annually for LTV inputs. Churn and expansion rates need long windows to stabilize; recomputing LTV every month makes your LTV:CAC ratio look like a seismograph.
One discipline to adopt: publish a single, versioned CAC definition document. Half the arguments about CAC in B2B companies are not disagreements about the number — they are two people using two different formulas and assuming the other person is wrong.
The bottom line#
The cost per customer formula is arithmetic. The hard part is refusing to flatter yourself in the numerator and refusing to pad the denominator. Do both honestly, split blended from paid, and pair the result with payback and LTV:CAC before you make a single budget decision.
Then look at where the waste actually is. In most outbound teams it is not the ad account — it is the list. Every bounced send, every wrong-title contact, and every rep hour spent chasing a person who left the company two years ago sits in your CAC numerator and contributes nothing to the denominator.
Start there. Use the Tomba Email Finder to build lists from your target accounts rather than filtering someone else's, verify before you send, and enrich before you route. The free tier gives you 25 searches a month to test the accuracy against your own known-good contacts — which is the only benchmark that matters. Fix the data, and CAC drops without anyone having to cut a budget.
Related guides#
Ready to find emails that actually work?
Join 150,000+ professionals who stopped guessing and started sending. Free credits on signup — no credit card required.
Get the Tomba newsletter
Practical outbound tactics and product updates — once every two weeks.
About the author