Cost Per User Acquisition: How to Calculate and Cut It in 2026
Most teams calculate cost per user acquisition wrong, then optimize the wrong channel. Here is the real formula, 2026 benchmarks by channel, and the five levers that actually move the number.
TL;DR#
- Cost per user acquisition (CAC) = all sales + marketing spend ÷ new customers acquired in the same period. Most teams inflate the denominator by counting free signups, or deflate the numerator by leaving out salaries, tools, and agency fees.
- The number is meaningless alone. Pair it with LTV:CAC (target 3:1+) and CAC payback (target under 12 months for B2B SaaS) or you will optimize yourself into unprofitable growth.
- Blended CAC hides everything. Split it by channel and by segment — paid ads at $310 and outbound at $58 average out to a "healthy" $120 that tells you nothing.
- Data cost is a rounding error; wasted send volume is not. A 12% bounce rate on a cold list burns sender reputation, which quietly doubles the CAC of every future campaign from that domain.
- The fastest CAC lever for most B2B teams is contact quality, not ad creative. Fewer, verified, correctly-targeted contacts beat a bigger list every time.
What is cost per user acquisition, exactly?#
Cost per user acquisition is what you spend, in total, to turn a stranger into a paying customer. The formula is boring:
CAC = (Sales spend + Marketing spend) / New customers acquiredThe arguments start immediately, and they are all about what goes inside those parentheses. A CFO's CAC and a growth marketer's CAC are usually different numbers for the same company, because the marketer counts ad spend and the CFO counts ad spend plus the two SDRs, plus the sales engineer's time, plus the $2,400/month of tooling, plus the contractor who edits the demo videos.
The CFO is right. If a cost exists to acquire customers, it belongs in the numerator. Customer acquisition cost is a fully-loaded metric or it is vanity.
The other half of the fight is the denominator. "Users" is the word that ruins this metric. If you have a free tier, a trial, and a paid plan, you have three different acquisition events and three different costs:
- Cost per lead (CPL) — someone gave you an email address. Cheap. Often meaningless.
- Cost per signup / activated user — someone created an account and did the thing. Useful for PLG.
- Cost per paying customer (true CAC) — someone gave you money. This is the one your board cares about.
- Cost per retained customer — someone gave you money and was still here at month 3. This is the one that predicts whether you survive.
Pick one, define it in writing, and never let anyone in the company quietly swap definitions mid-quarter. The number one cause of "our CAC went up 40%" panic meetings is a definition change nobody logged.
How do you calculate CAC without fooling yourself?#
Run this checklist against your current number. If you cannot answer all six, your CAC is fiction.
- Are fully-loaded salaries in? Include the base + commission of every AE, SDR, and marketer, plus the fraction of the RevOps and design headcount that supports acquisition. Not customer success. Not support.
- Are tools in? Ad platforms, CRM seats, sequencing tools, data providers, enrichment, warmup tools, landing page builders. Add them up. It is usually more than people expect.
- Is there a time lag correction? If your sales cycle is 60 days, this month's customers were bought with money you spent two months ago. Lag your spend to match, or your CAC will swing wildly for no real reason.
- Is expansion revenue excluded? Upsells to existing customers are not acquisition. Counting them in the denominator is the oldest way to make CAC look great while new logo growth quietly dies.
- Is it segmented? Self-serve vs sales-assisted. SMB vs mid-market. Inbound vs outbound. Each is a different business with a different CAC.
- Is it paired with payback? CAC ÷ (monthly gross-margin-adjusted revenue per customer) = months to recover. Under 12 months is the common B2B SaaS bar; under 6 is excellent.
A worked example. Say last quarter you spent $180,000 total (ads, salaries, tools, content) and closed 90 new paying accounts. CAC = $2,000. Your ACV is $9,600 with 80% gross margin, so gross-margin revenue per month is $640. Payback = 2000 ÷ 640 = 3.1 months. That is a business you should pour money into. Change nothing except closing 30 accounts instead of 90, and CAC becomes $6,000 and payback stretches to 9.4 months — still acceptable, but the growth math is now fragile.
What is a good cost per user acquisition in 2026?#
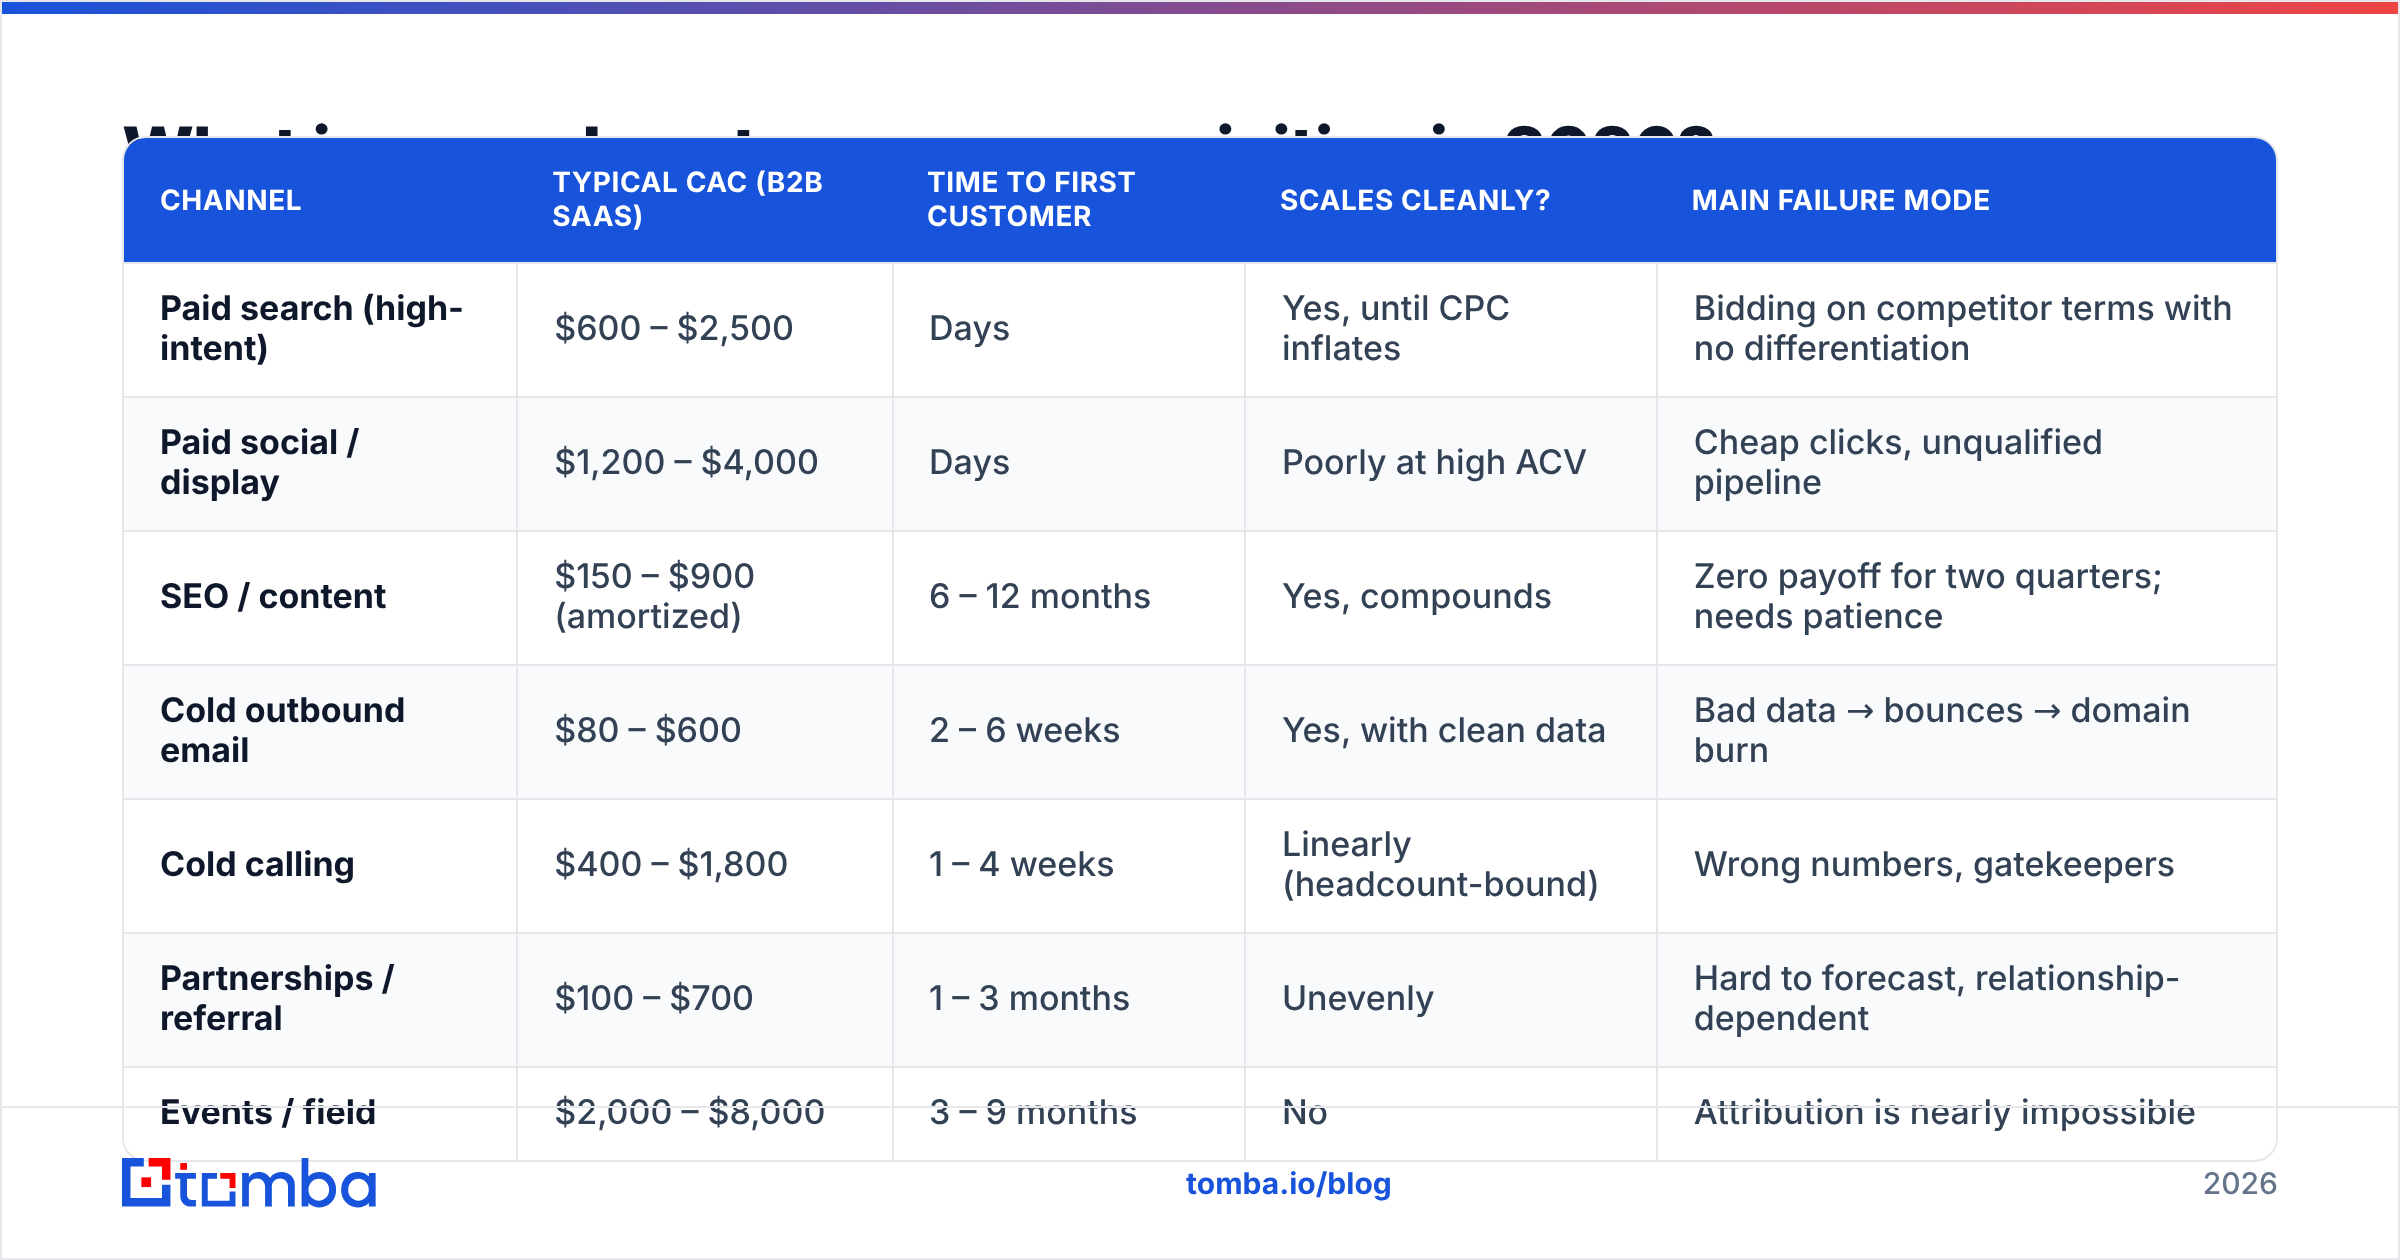
There is no universal "good," but there are defensible ranges. The table below reflects typical blended figures reported across B2B SaaS teams — treat it as a sanity check, not gospel. Your vertical, ACV, and motion move these numbers by 3-5x.
| Channel | Typical CAC (B2B SaaS) | Time to first customer | Scales cleanly? | Main failure mode |
|---|---|---|---|---|
| Paid search (high-intent) | $600 – $2,500 | Days | Yes, until CPC inflates | Bidding on competitor terms with no differentiation |
| Paid social / display | $1,200 – $4,000 | Days | Poorly at high ACV | Cheap clicks, unqualified pipeline |
| SEO / content | $150 – $900 (amortized) | 6 – 12 months | Yes, compounds | Zero payoff for two quarters; needs patience |
| Cold outbound email | $80 – $600 | 2 – 6 weeks | Yes, with clean data | Bad data → bounces → domain burn |
| Cold calling | $400 – $1,800 | 1 – 4 weeks | Linearly (headcount-bound) | Wrong numbers, gatekeepers |
| Partnerships / referral | $100 – $700 | 1 – 3 months | Unevenly | Hard to forecast, relationship-dependent |
| Events / field | $2,000 – $8,000 | 3 – 9 months | No | Attribution is nearly impossible |
Two things jump out. First, outbound and content sit at the bottom of the CAC range — which is why they remain the default for capital-efficient B2B. Second, the spread within a channel is enormous. Two companies both "doing cold email" can sit at $80 and $600 CAC. The difference is almost never the copy. It is the list.
Why does contact data quality drive CAC more than ad creative?#
Because bad data multiplies through the whole funnel.
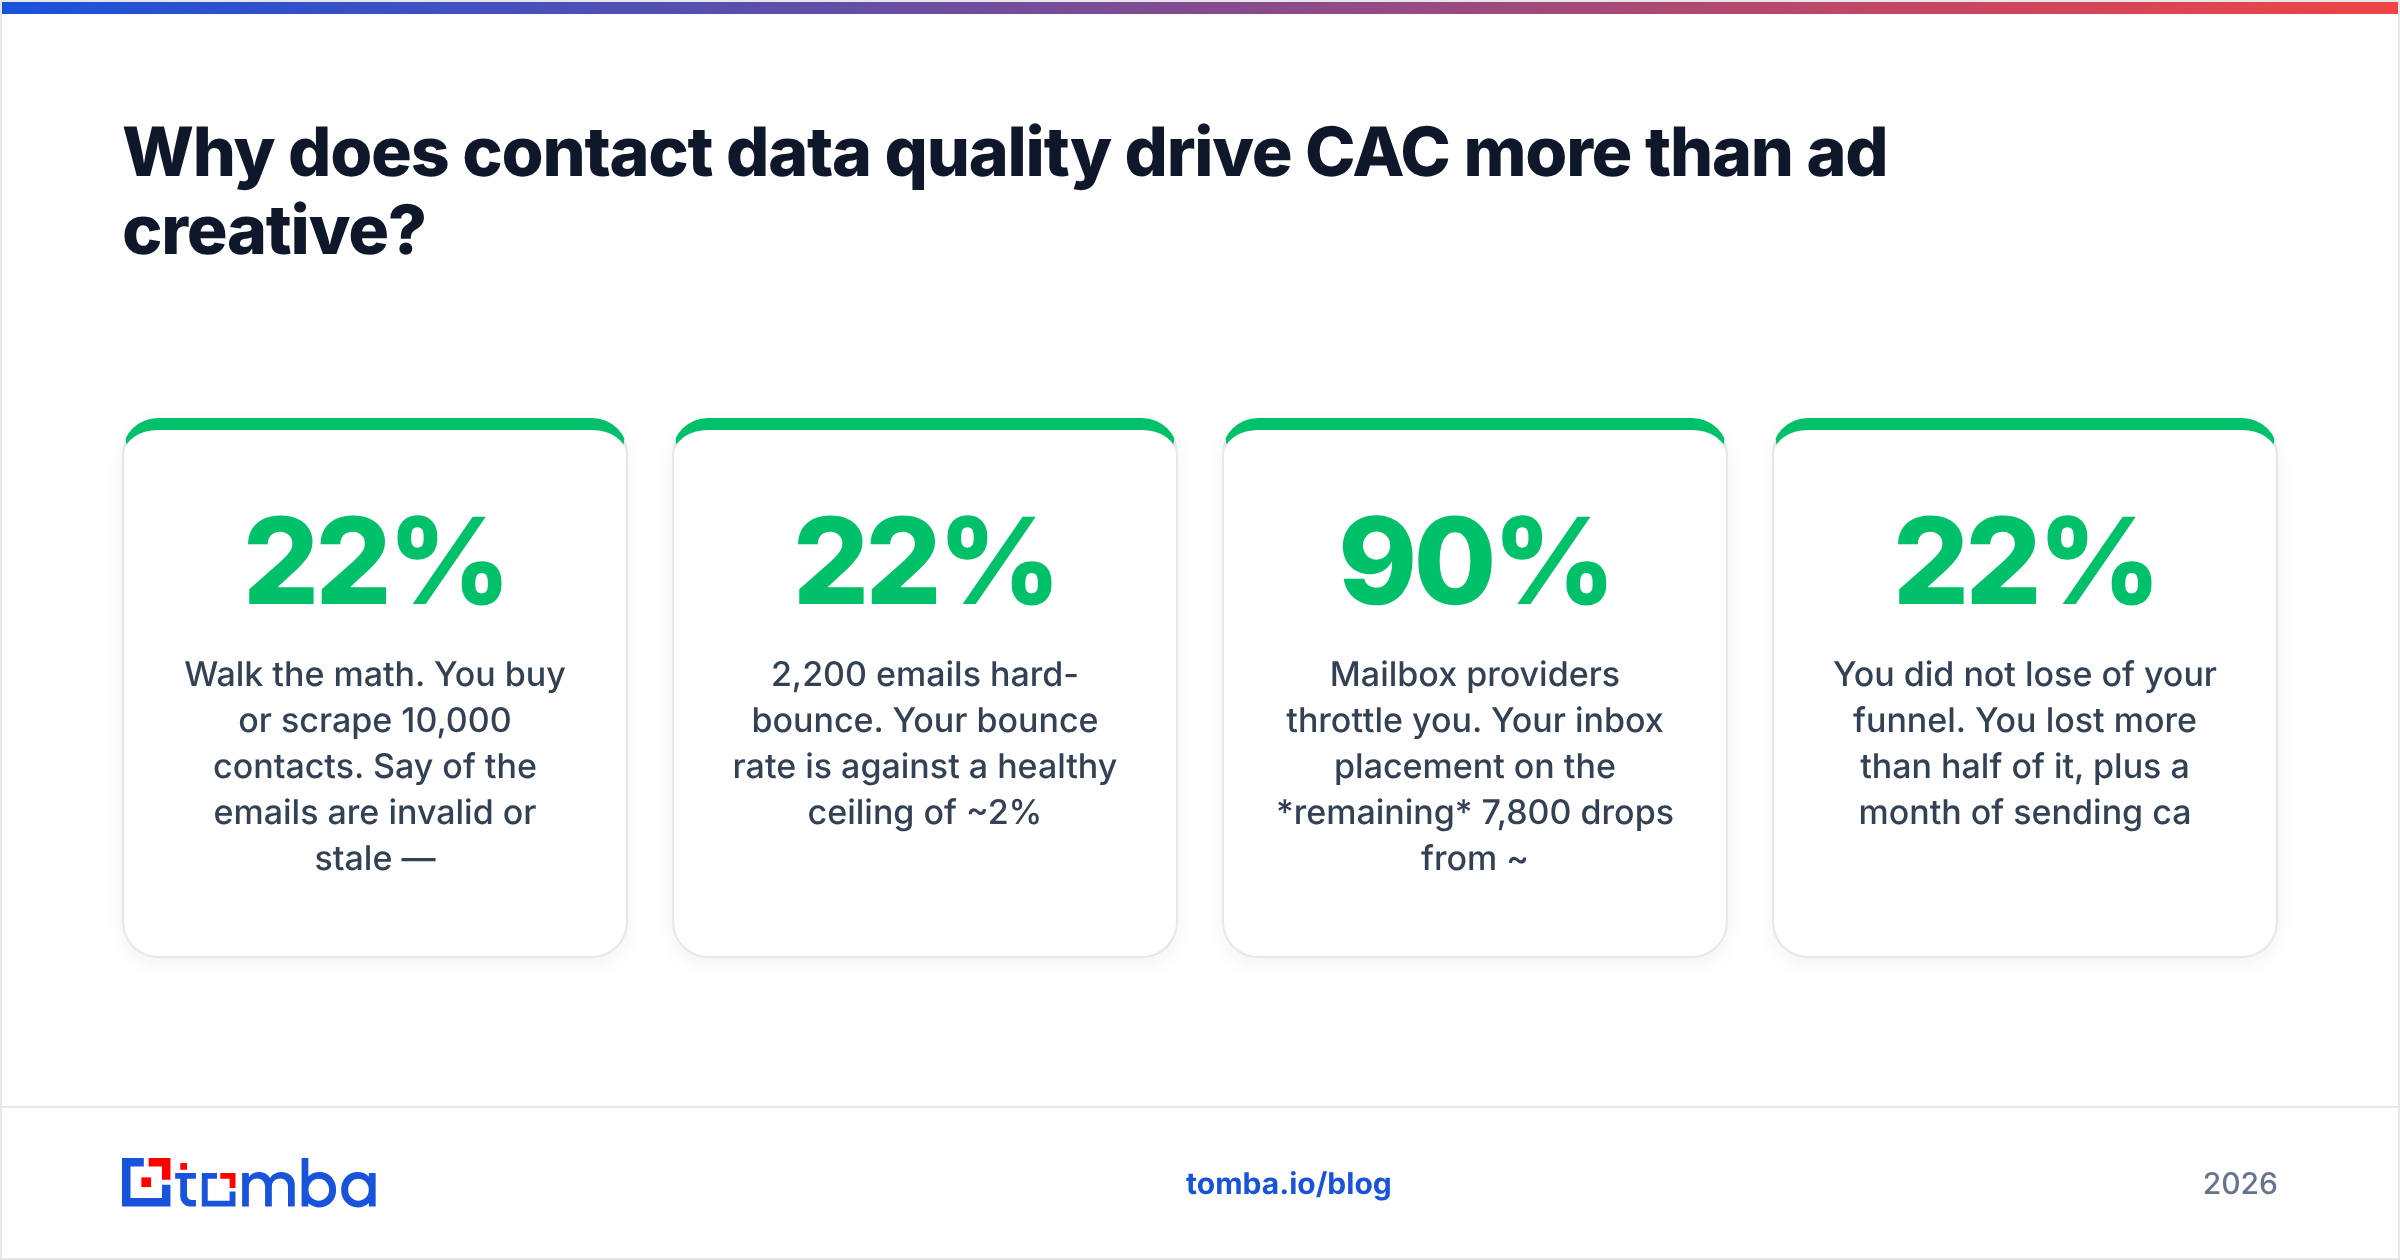
Walk the math. You buy or scrape 10,000 contacts. Say 22% of the emails are invalid or stale — a normal figure for an unverified list. You send anyway.
- 2,200 emails hard-bounce. Your bounce rate is 22% against a healthy ceiling of ~2%.
- Mailbox providers throttle you. Your inbox placement on the remaining 7,800 drops from ~90% to maybe 55%.
- Effectively 4,290 people see your message instead of 9,000. You paid for 10,000.
- Your domain reputation now needs 3-6 weeks to recover, during which every campaign underperforms.
You did not lose 22% of your funnel. You lost more than half of it, plus a month of sending capacity, plus the goodwill of your primary domain. Meanwhile the accountant recorded the data cost as a line item that looked trivial. That is how a $200 data decision becomes a $20,000 CAC problem.
The fix is unglamorous and cheap: verify before you send. Run every address through an email verifier and treat anything below "valid" as suppressed, not "worth a try." Use a catch-all verifier for the domains that refuse to answer honestly, since catch-all servers accept everything at SMTP and then bounce silently later. Google's Postmaster Tools will show you exactly what your reputation looks like after a bad week — check it before you assume the copy was the problem.
The same logic applies upstream at sourcing. A precise email finder that returns 400 confirmed decision-makers at a target account list will outperform a scraper that returns 4,000 names of unknown seniority, because your reply rate is a function of relevance, not volume. Ten times the volume at one-tenth the response rate is not a wash — it is worse, because it costs you deliverability too.

Which levers actually reduce cost per user acquisition?#
Ranked by how much they move the number for a typical B2B team, and how fast.
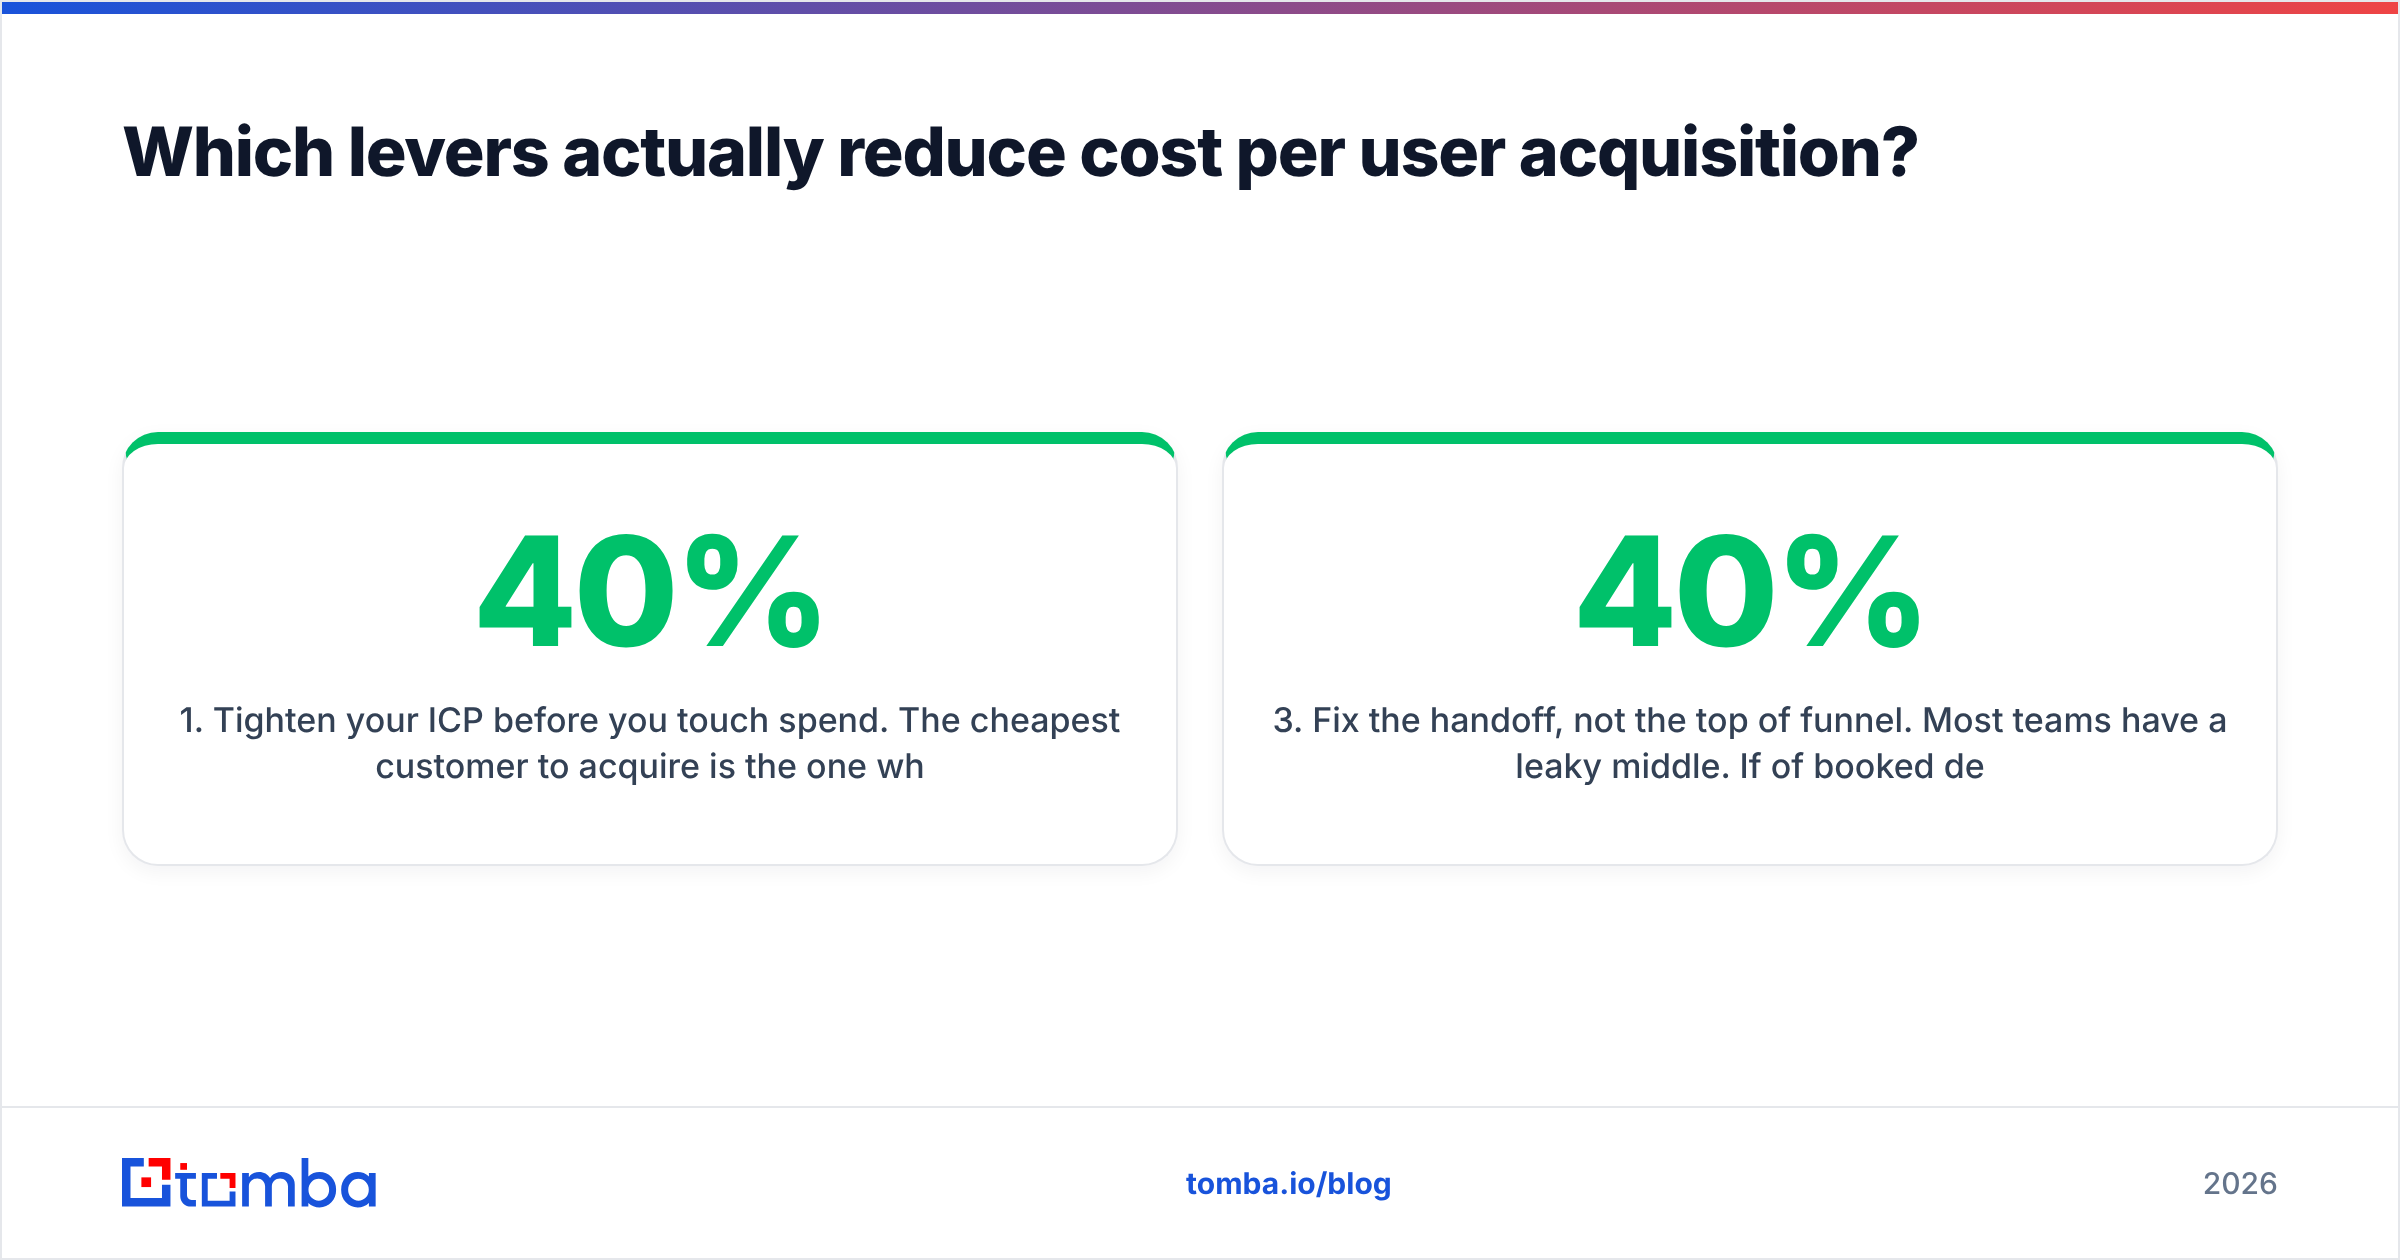
1. Tighten your ICP before you touch spend. The cheapest customer to acquire is the one who was always going to buy. Pull your last 50 closed-won deals, find the three attributes they share (headcount band, tech stack, funding stage, job title of champion), and refuse to prospect outside that box for one quarter. Teams that do this routinely see CAC drop 30-40% with zero change in budget, because the wasted half of the funnel simply stops existing.
2. Verify and enrich before you send. Covered above. The bounce-rate-to-reputation chain is the highest-leverage, lowest-effort fix available. Contact enrichment also lets you personalize at the account level, which is what actually lifts reply rates — not first-name merge tags.
3. Fix the handoff, not the top of funnel. Most teams have a leaky middle. If 40% of booked demos no-show, your effective CAC is 1.67x your nominal CAC. Confirmations, reminders, and a human calendar link fix more CAC than a new ad channel.
4. Shorten the sales cycle. CAC includes the cost of time. An AE working a deal for 90 days costs roughly 1.5x an AE working it for 60. Removing one internal approval step or one redundant call is a direct CAC reduction that nobody puts on a dashboard.
5. Consolidate your tool stack. Not because tools are expensive — because fragmentation causes duplicate spend. Teams routinely pay three vendors for overlapping contact data. Audit it. If your finder, verifier, and enrichment come from one vendor with one credit pool, you stop paying twice for the same record.
6. Only then, optimize the channel. New creative, new landing page, new bidding strategy. This is where most teams start, and it is the lowest-leverage item on the list.
How do the data-sourcing options compare on real cost?#
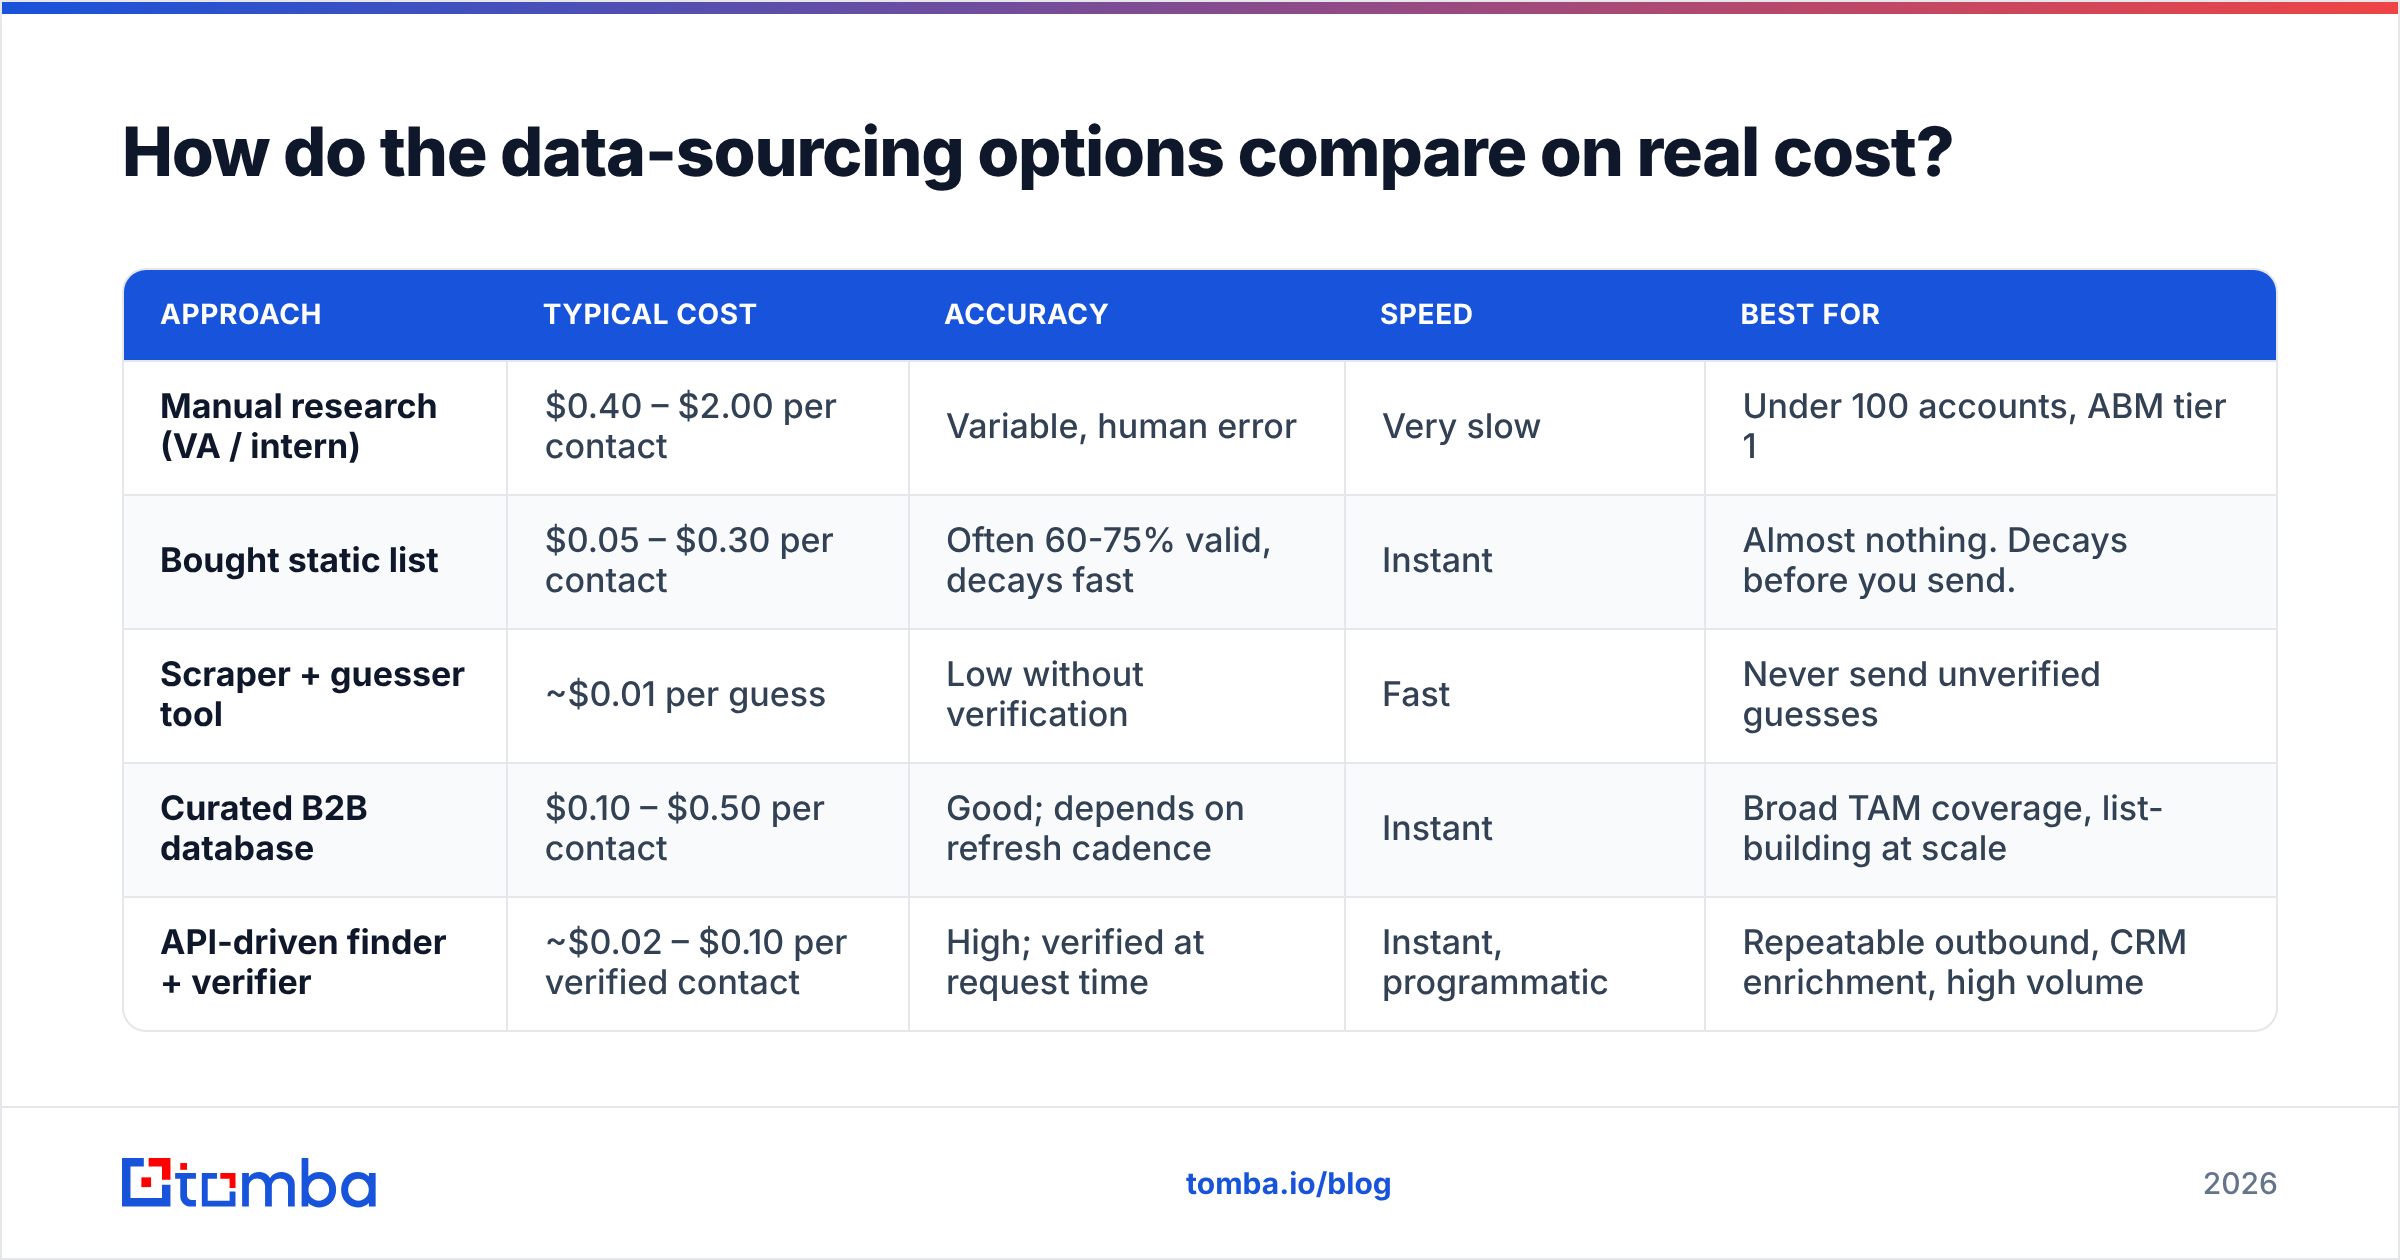
Data is the input to outbound CAC, so its unit economics matter. Here is how the common approaches stack up.
| Approach | Typical cost | Accuracy | Speed | Best for |
|---|---|---|---|---|
| Manual research (VA / intern) | $0.40 – $2.00 per contact | Variable, human error | Very slow | Under 100 accounts, ABM tier 1 |
| Bought static list | $0.05 – $0.30 per contact | Often 60-75% valid, decays fast | Instant | Almost nothing. Decays before you send. |
| Scraper + guesser tool | ~$0.01 per guess | Low without verification | Fast | Never send unverified guesses |
| Curated B2B database | $0.10 – $0.50 per contact | Good; depends on refresh cadence | Instant | Broad TAM coverage, list-building at scale |
| API-driven finder + verifier | ~$0.02 – $0.10 per verified contact | High; verified at request time | Instant, programmatic | Repeatable outbound, CRM enrichment, high volume |
Curated databases like BookYourData do the job well when you want a large, filterable pool up front and are comfortable paying per record. An API-first approach fits differently: you already know the accounts, you need the right person at each one, and you want it wired into your CRM rather than exported to a spreadsheet. Many teams end up running both — a database for TAM discovery, an API for enrichment and verification at the point of use.
For reference, Tomba pricing starts with a free tier at 25 searches/month, then Starter at $49/mo, Growth at $99/mo, and Pro at $249/mo. On the Growth plan, a verified contact lands in the low single-digit cents. Against a $2,000 CAC, the data is roughly 0.3% of the cost of the customer. Which is exactly the point: the cheapest thing in your acquisition stack is the thing that determines the efficiency of everything else.
How do you build a CAC dashboard people actually use?#
Four numbers, updated monthly, split by channel:
- CAC — fully loaded, lagged to your sales cycle.
- LTV:CAC — under 1:1 you are lighting money on fire; 3:1 is the standard target; above 5:1 you are probably underinvesting in growth.
- CAC payback (months) — the cash-flow reality check. A 4:1 LTV:CAC with a 30-month payback will still kill you.
- Marginal CAC — the CAC of the last $10k you spent, not the average. This is the only number that tells you whether to spend more. Average CAC always looks better than marginal CAC in a saturating channel, which is why teams over-invest for a quarter too long.
Add a fifth if you run outbound: bounce rate by sending domain. It is a leading indicator of CAC. When it climbs, your next quarter's CAC climbs with it, and you will find out too late if you are not watching. Analyst coverage from firms like Gartner increasingly frames deliverability as a revenue metric rather than an IT one, and that framing is correct — an email that never arrives has an infinite cost per acquisition.
Finally, resist the urge to report blended CAC to leadership as the headline. Blended CAC is a weighted average that hides your best and worst channels behind each other. Report it segmented. The conversation changes from "why is CAC up" to "paid social CAC tripled, let's move that budget into outbound," which is an actionable sentence rather than an anxious one. HubSpot's sales and marketing benchmark reporting is a reasonable external sanity check when you want to know whether your number is unusual or just uncomfortable.
Where should you start this week?#
Do three things, in order:
- Recalculate CAC with fully-loaded costs and a lag correction. Accept that the real number is higher than the one in the deck.
- Segment it by channel. Find the one channel that is quietly 4x the others and stop feeding it.
- Verify your outbound list before the next send. Measure the bounce rate before and after.
That third step is the one with same-week payback. If you are sourcing prospects for outbound, start with the Tomba Email Finder — find the right person at the right account, get the address verified at the point of request, and push it straight into your sequence or CRM. The free tier gives you 25 searches to test the accuracy against a list you already trust before you spend a cent. Lowering cost per user acquisition rarely starts with a bigger budget. It starts with not paying to email people who do not exist.
Related guides#
Ready to find emails that actually work?
Join 150,000+ professionals who stopped guessing and started sending. Free credits on signup — no credit card required.
Get the Tomba newsletter
Practical outbound tactics and product updates — once every two weeks.
About the author