Cost to Acquire Customer: How to Calculate and Cut CAC
Most teams calculate cost to acquire customer wrong — they leave out salaries, tools, and the leads that never existed. Here's the honest formula, 2026 benchmarks by channel, and the levers that actually move the number.
TL;DR
- Cost to acquire customer (CAC) = all sales and marketing spend in a period ÷ new customers won in that period. If you're excluding salaries, you're not measuring CAC — you're measuring ad spend.
- Blended CAC lies. Split it into paid CAC and organic CAC, then split again by segment. A $600 SMB CAC and a $28,000 enterprise CAC averaged together tell you nothing.
- The healthy benchmark for B2B SaaS in 2026 is LTV:CAC ≥ 3:1 with CAC payback under 12–18 months. Below that, growth is just borrowed money.
- Bad contact data is a silent CAC tax: bounced emails, dead phone numbers, and duplicate records inflate cost per meeting long before anyone notices.
- The fastest CAC levers are usually data quality, ICP tightening, and pipeline conversion — not cutting ad budget.
What is cost to acquire customer, exactly?#
Cost to acquire customer is the total amount you spend to turn a stranger into a paying customer. Think of it like a restaurant's cost per plate: it's not just the ingredients (ad spend) — it's the chef's wages, the gas bill, the wasted produce that spoiled in the walk-in. Leave any of those out and you'll happily sell every plate at a loss.
The formula is simple. Applying it honestly is not.
CAC = (Total Sales Spend + Total Marketing Spend) / New Customers AcquiredBoth numbers are measured over the same period. "Total spend" means fully loaded:
- Salaries and commissions — SDRs, AEs, marketers, sales engineers, and the fraction of a RevOps person who keeps the machine running.
- Paid media — Google, LinkedIn, retargeting, sponsorships, review-site placements.
- Tools and data — CRM seats, sequencers, intent data, contact databases, enrichment.
- Content and creative — freelancers, design, video, agency retainers.
- Overhead attributable to GTM — events, travel, swag, that conference booth nobody measured.
What does not belong in CAC: customer success salaries tied to existing accounts, product engineering, and expansion revenue costs. Those are retention and expansion costs. Mixing them in makes CAC look worse and makes your unit economics unreadable. The standard definition — the one investors and analysts use — is narrow on purpose. Wikipedia's entry on customer acquisition cost is a fine sanity check if your finance team wants a neutral reference.
Why is the CAC number on your dashboard wrong?#
Because it's almost always one of these three things pretending to be CAC.
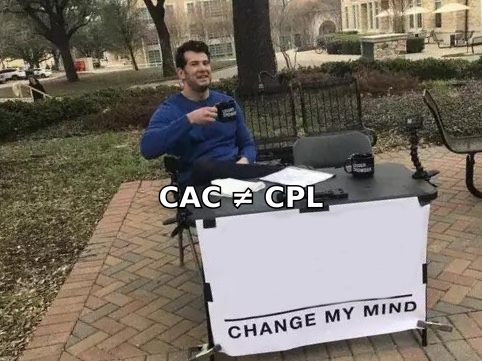
It's actually cost per lead. Cost per lead divides spend by form fills. CAC divides spend by customers. If your MQL-to-customer rate is 3%, your CAC is roughly 33× your cost per lead — and no, you cannot use the smaller number in a board deck. If your funnel definitions are fuzzy, start by pinning down what actually counts as a marketing qualified lead before you divide anything.
It's ad-spend-only. Divide $50,000 of Google Ads by 40 customers and you get a very comforting $1,250. Add the two SDRs, the AE, the marketer, and the tool stack, and the real number is often 3–5× higher. Payroll is usually 60–70% of GTM spend in B2B. Excluding it isn't a rounding error — it's the whole number.
It's blended across segments. Your self-serve customers might cost $180. Your mid-market deals might cost $9,000. Your enterprise logos might cost $40,000 and take 11 months. The blended average describes a customer who doesn't exist. Segment it or don't bother.
There's a fourth quiet distortion: time lag. If your sales cycle is 90 days, this month's customers were paid for last quarter. Compare Q1 spend to Q1 customers and you're comparing two unrelated things. Lag your spend by roughly one sales cycle, or measure by cohort.
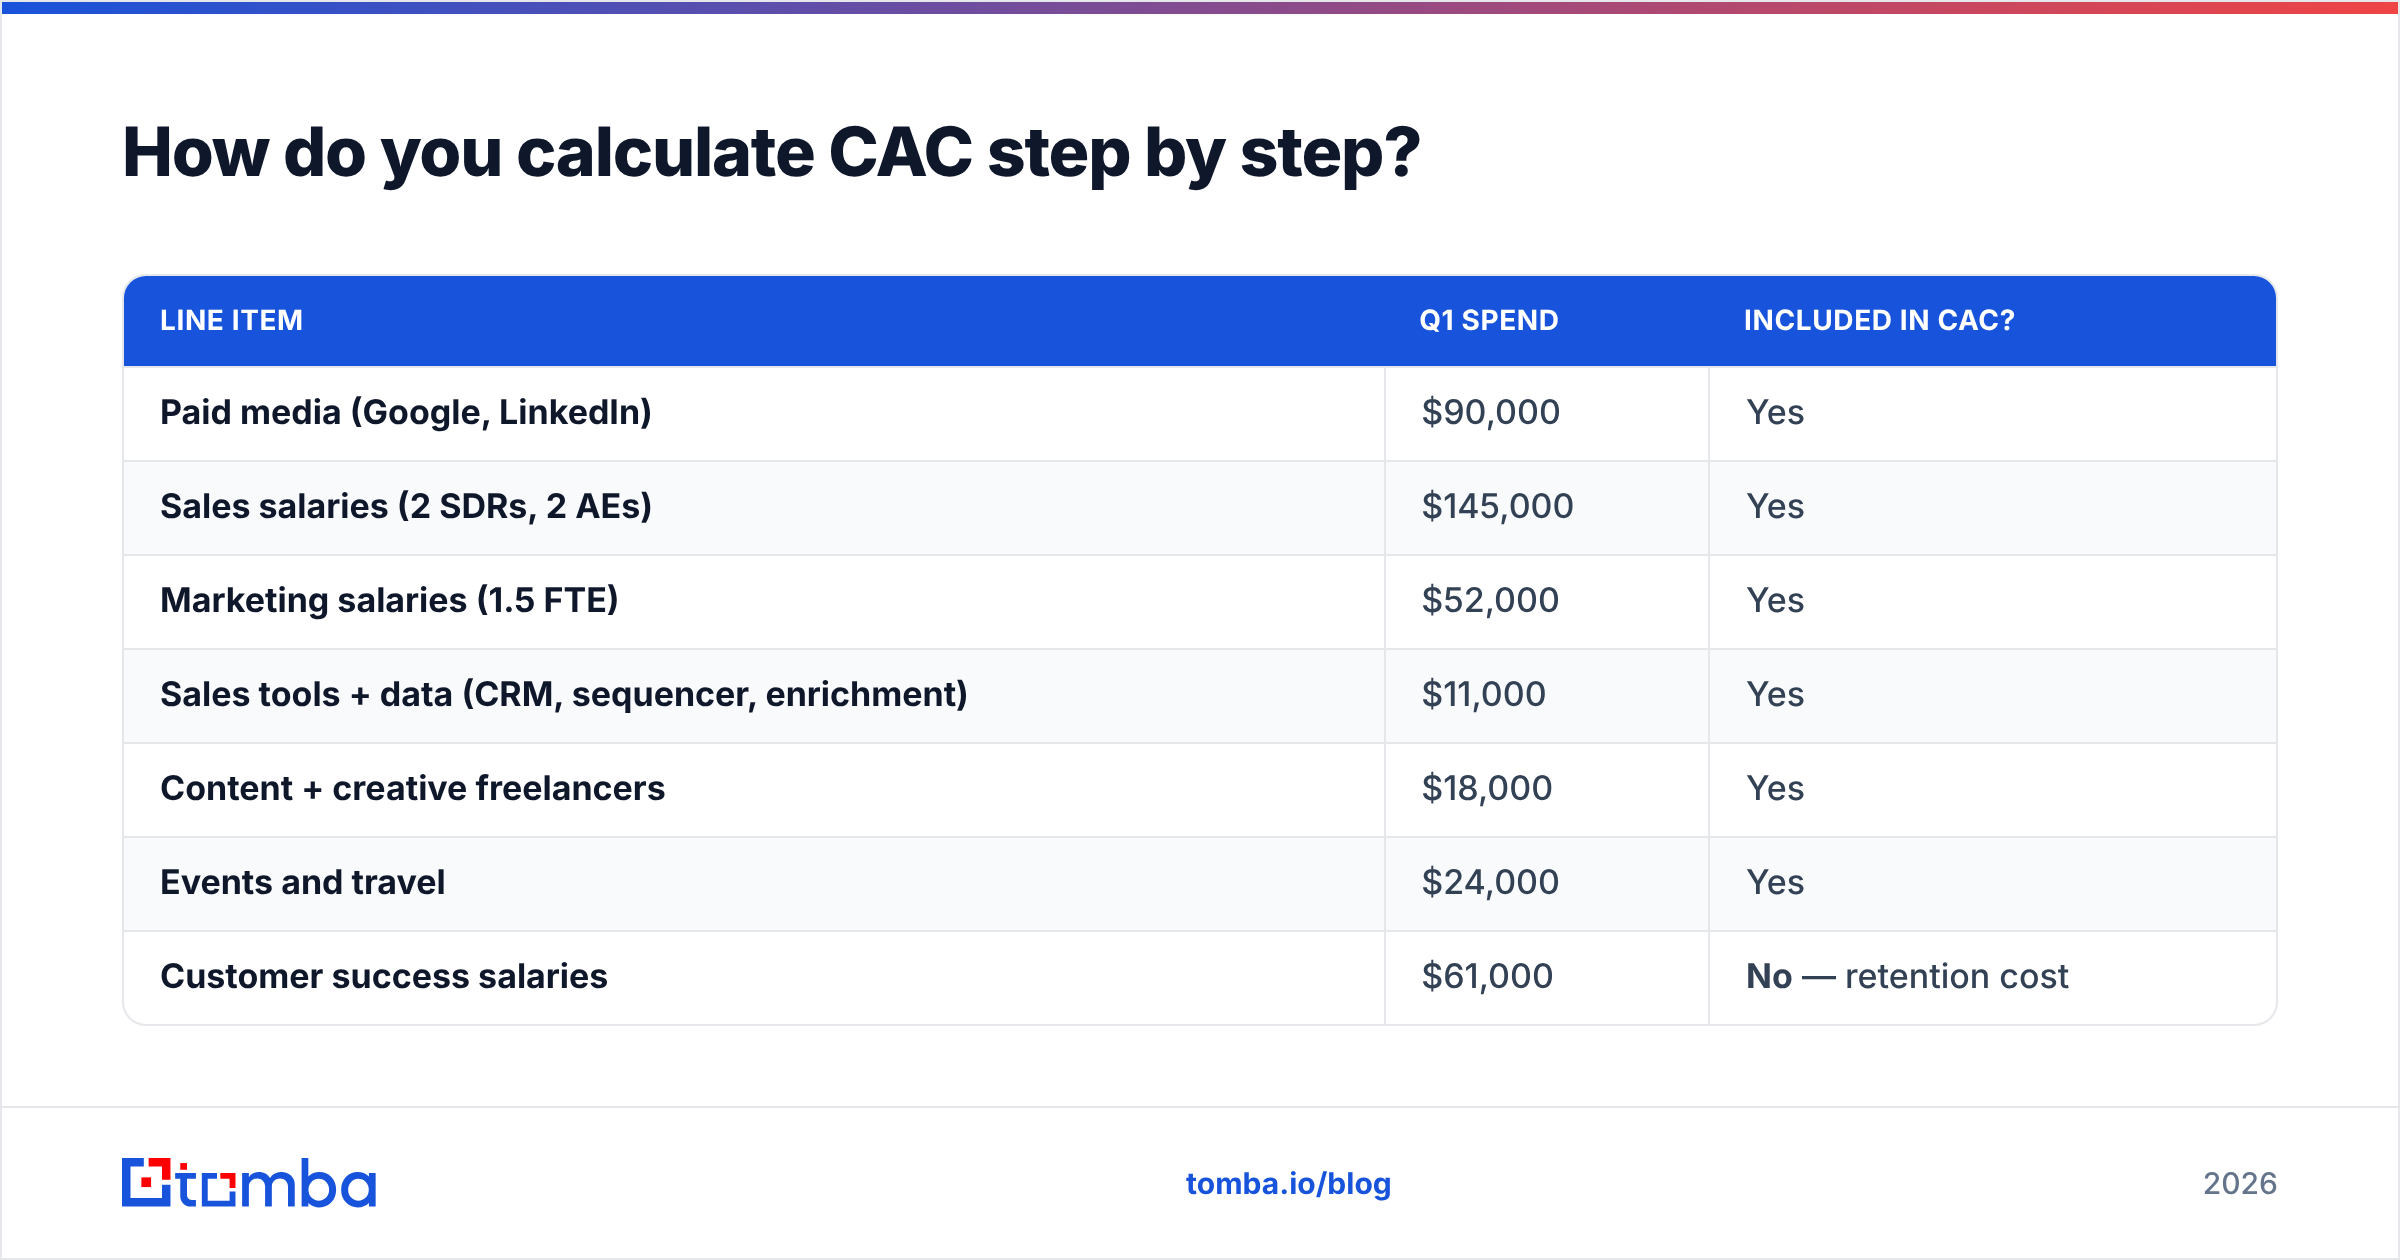
How do you calculate CAC step by step?#
Here's a worked example for a fictional B2B SaaS company over one quarter.
| Line item | Q1 spend | Included in CAC? |
|---|---|---|
| Paid media (Google, LinkedIn) | $90,000 | Yes |
| Sales salaries (2 SDRs, 2 AEs) | $145,000 | Yes |
| Marketing salaries (1.5 FTE) | $52,000 | Yes |
| Sales tools + data (CRM, sequencer, enrichment) | $11,000 | Yes |
| Content + creative freelancers | $18,000 | Yes |
| Events and travel | $24,000 | Yes |
| Customer success salaries | $61,000 | No — retention cost |
| Product engineering | $220,000 | No — not GTM |
| Total CAC-eligible spend | $340,000 | — |
New customers won in Q1: 38.
CAC = $340,000 ÷ 38 = $8,947.
Now split it. If 26 of those customers came from outbound at $250,000 of attributed spend and 12 came from organic/inbound at $90,000:
- Outbound CAC: $9,615
- Inbound CAC: $7,500
That difference is a decision. The blended $8,947 is not.
What is a good cost to acquire customer in 2026?#
CAC in isolation is meaningless. A $30,000 CAC is excellent if the contract is worth $200,000 a year and churn is 5%. A $400 CAC is a disaster if the customer pays $29/month and leaves in four months.
Judge it against three ratios:
- LTV:CAC — lifetime value divided by CAC. 3:1 is the working floor. Below 3:1, you're buying revenue at a discount to its cost. Above 5:1, you're probably under-investing and leaving growth on the table.
- CAC payback period — months of gross-margin-adjusted revenue needed to repay CAC. Under 12 months is strong for SMB; 18–24 months is tolerable for enterprise with high net retention.
- CAC ratio by channel — the same $1 does not perform equally across paid, outbound, partner, and organic. Rank them and reallocate.
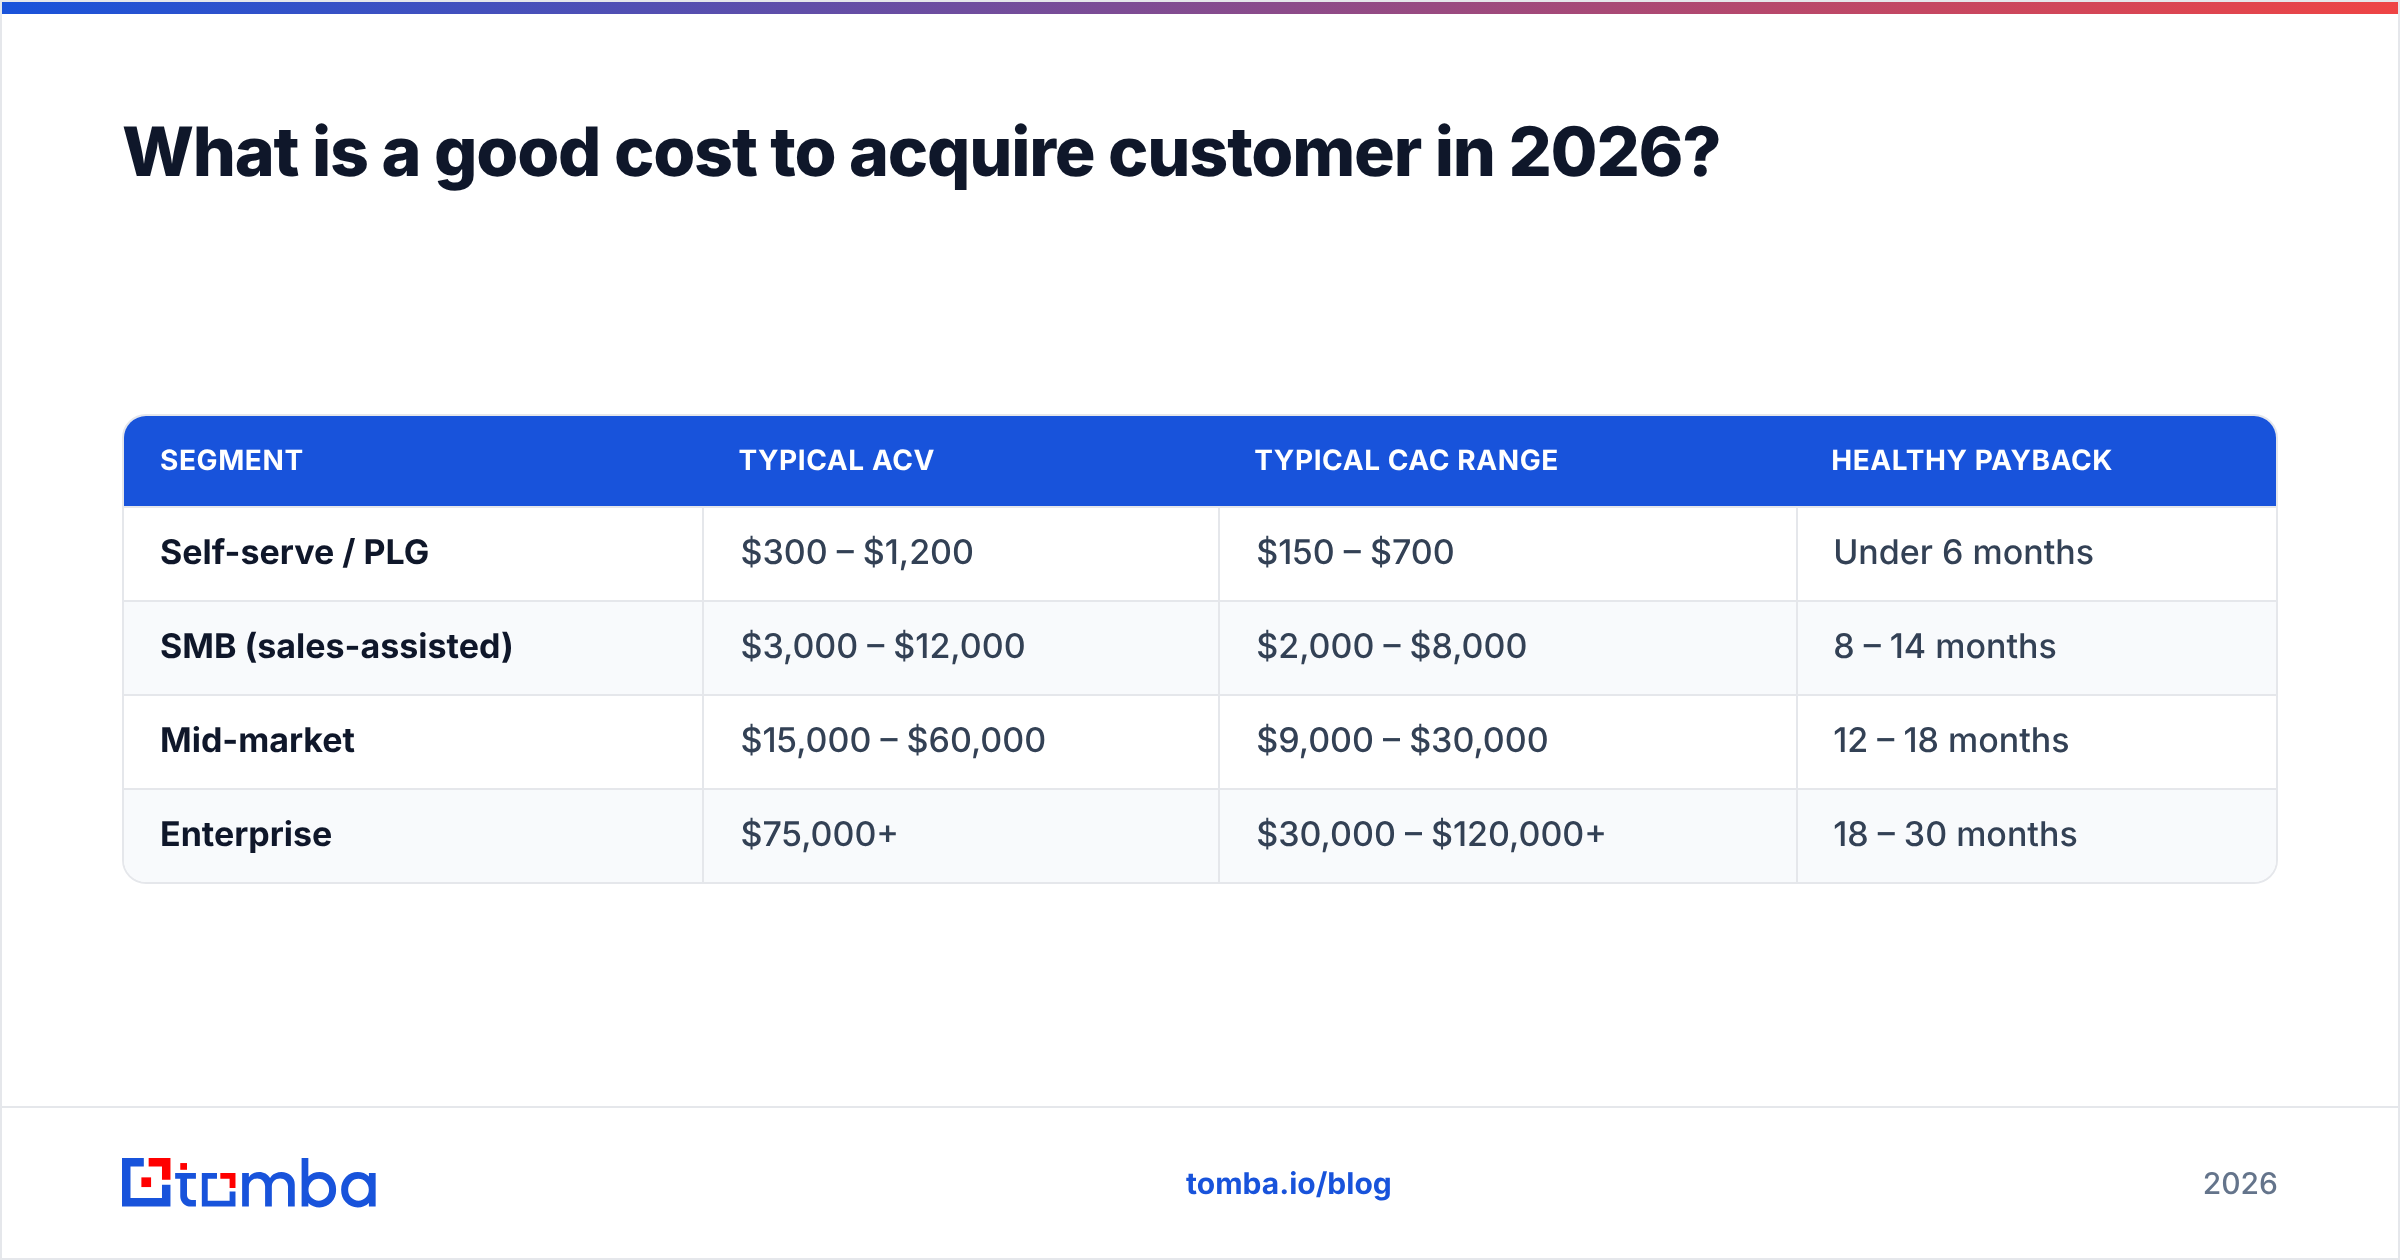
Rough 2026 directional benchmarks for B2B software, useful only as a starting point:
| Segment | Typical ACV | Typical CAC range | Healthy payback |
|---|---|---|---|
| Self-serve / PLG | $300 – $1,200 | $150 – $700 | Under 6 months |
| SMB (sales-assisted) | $3,000 – $12,000 | $2,000 – $8,000 | 8 – 14 months |
| Mid-market | $15,000 – $60,000 | $9,000 – $30,000 | 12 – 18 months |
| Enterprise | $75,000+ | $30,000 – $120,000+ | 18 – 30 months |
Treat these as guardrails, not targets. Your own trailing 12-month numbers, segmented, beat any industry table — including this one. Analyst shops like Gartner and peer-review data on G2 can help you sanity-check where you sit, but the honest comparison is against your own last four quarters.
Which levers actually reduce cost to acquire customer?#
Most teams reach for the wrong lever first: cutting ad spend. That usually reduces customers faster than it reduces cost, and CAC goes up. Here are the levers ranked roughly by impact-per-effort.
1. Fix contact data quality. This is the least glamorous and most reliable win. Every bounced email, wrong phone number, and duplicate record costs you sequence slots, sender reputation, and rep hours — with zero chance of a meeting. If 22% of your list is bad, you're paying 22% more per meeting than you should be, permanently. Running lists through an email verifier before they hit a sequence is a one-afternoon change that shows up in cost-per-meeting within two weeks.
2. Tighten the ICP. Wide targeting inflates volume and destroys conversion. Cut the bottom two firmographic segments by win rate and watch CAC fall without touching spend. This is subtraction, not optimization.
3. Improve mid-funnel conversion. CAC is a division problem — you can shrink the numerator or grow the denominator. A 15% lift in demo-to-close does more for CAC than a 15% cut to media budget, and it doesn't shrink pipeline. Look hard at your response rate at each stage; the worst-converting step is your cheapest fix.
4. Shorten the sales cycle. Every extra week of cycle time is more rep hours loaded into the same deal. Multi-threading earlier — getting a second and third contact into the conversation from day one — is the most consistent cycle-shortener in B2B. That requires knowing who else works there, which is a data problem, not a persuasion problem.
5. Rebalance channels quarterly. Track CAC per channel, not blended. Kill the bottom decile. Reinvest into whatever produced the cheapest closed-won, not the cheapest click. HubSpot's research on B2B marketing performance is a decent starting reference for channel-level expectations if you have no internal history.
How does bad data quietly inflate CAC?#
Run the arithmetic and it stops being abstract.
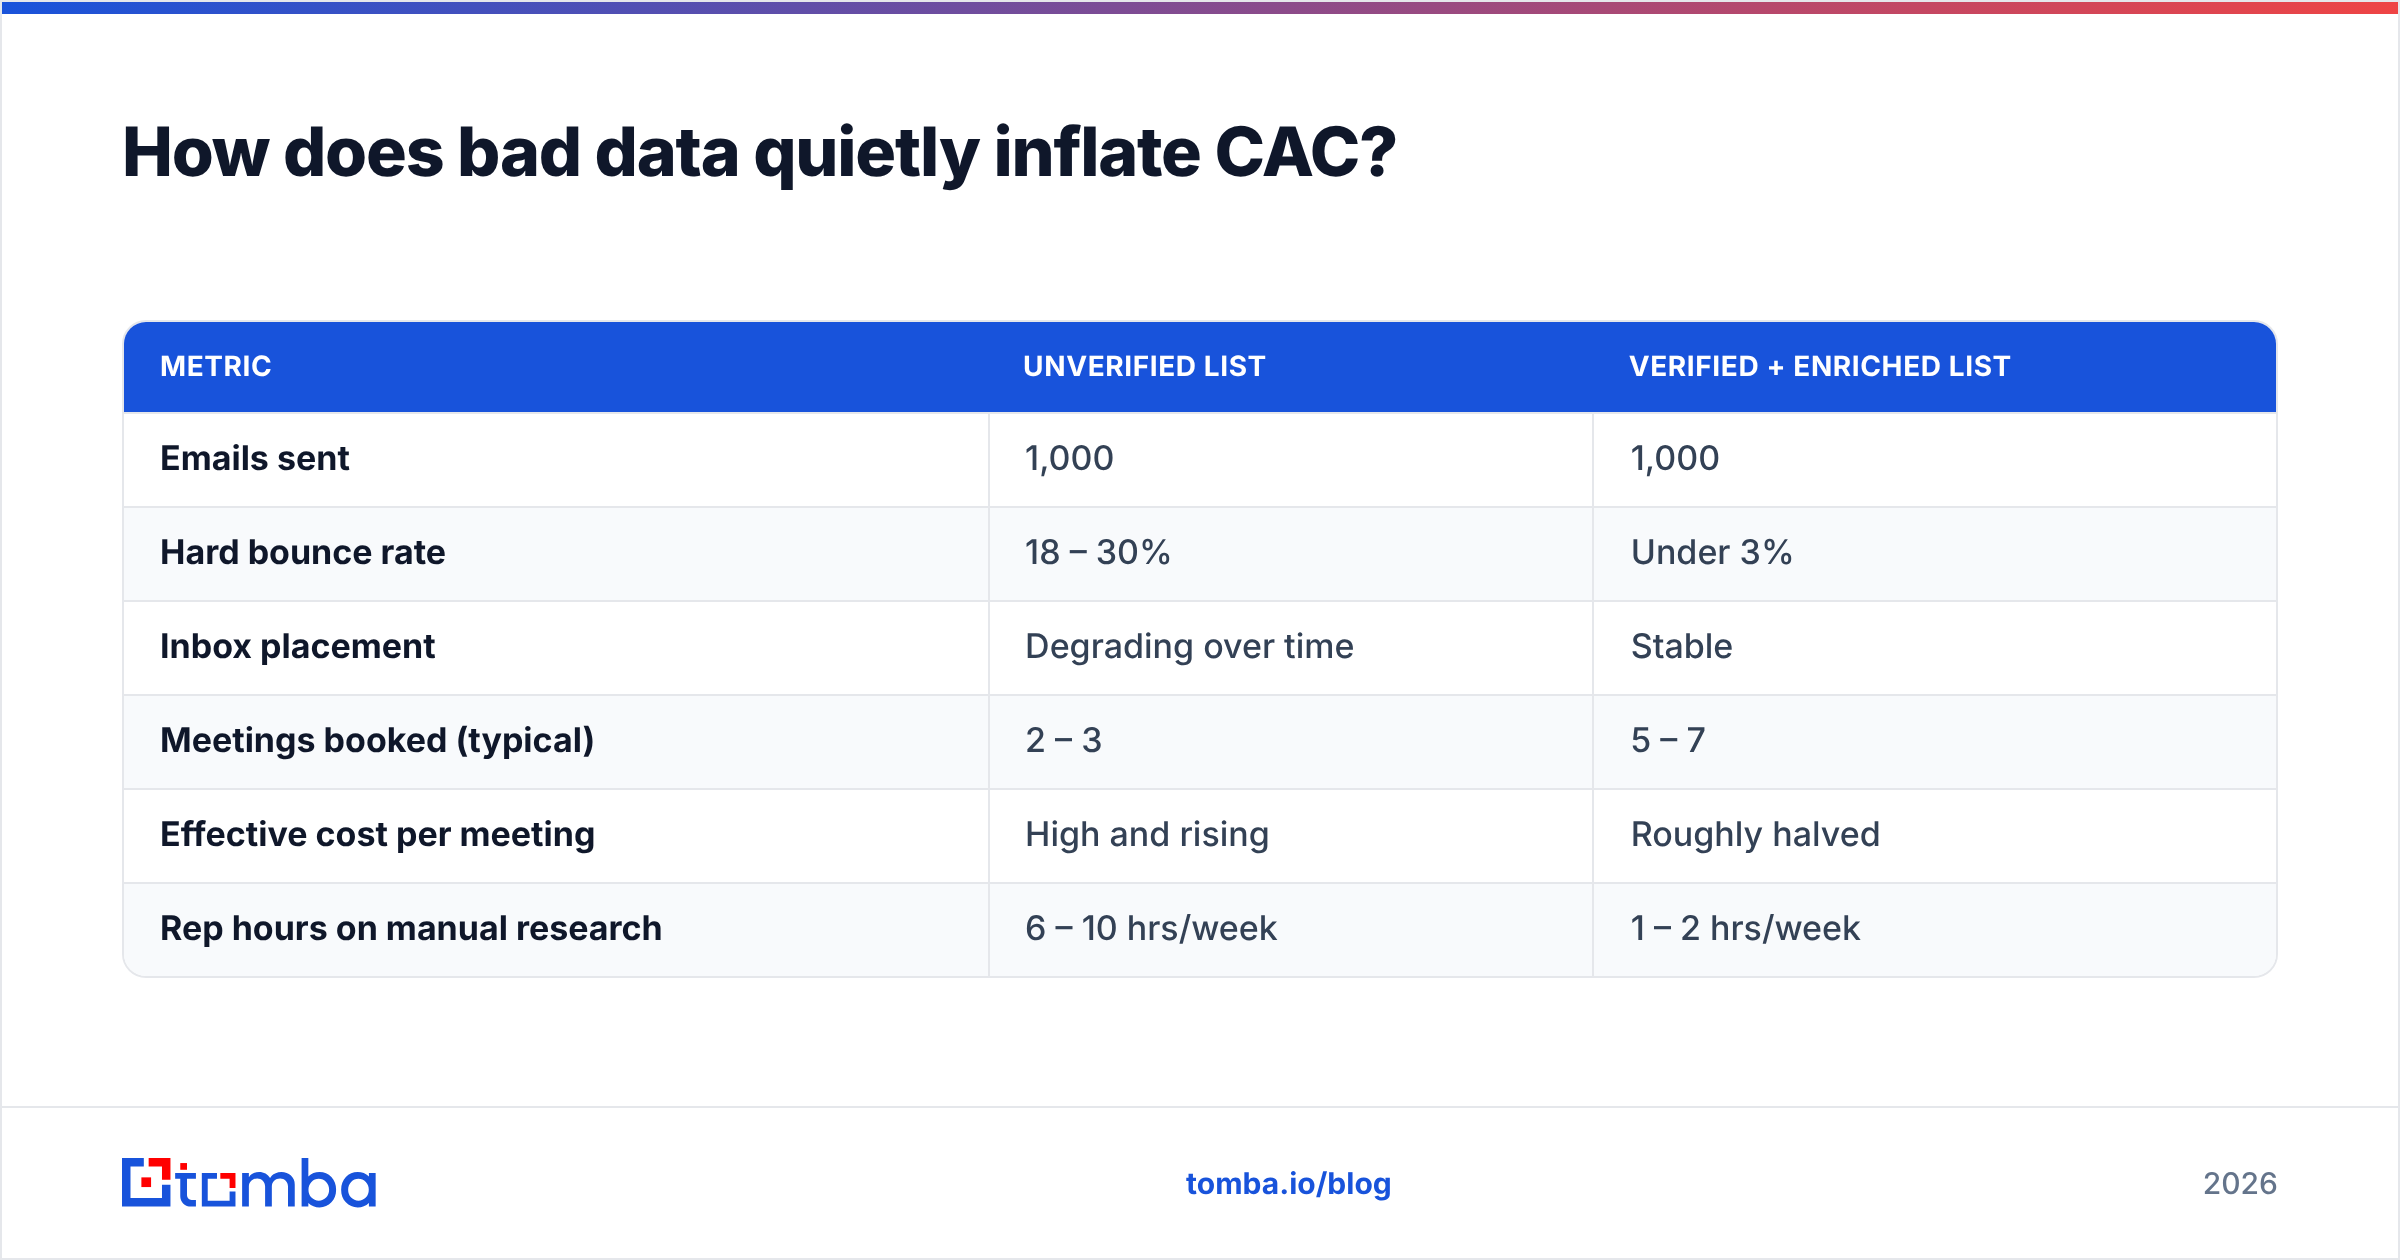
Say an SDR sends 1,000 emails a month, and your list is 25% invalid. That's 250 sends into the void. If your reply-to-meeting math needs 400 valid sends per meeting, those 250 dead sends represent more than half a meeting lost — every month, per rep. Multiply by team size and cost per rep and the number gets ugly fast.
It's worse than the arithmetic suggests, because bounces don't just fail — they damage the channel. High bounce rates degrade sender reputation, which suppresses inbox placement for the valid addresses too. You end up paying full price for a list that's only partially deliverable and only partially seen.
Here's how the two approaches compare on the same underlying list:
| Metric | Unverified list | Verified + enriched list |
|---|---|---|
| Emails sent | 1,000 | 1,000 |
| Hard bounce rate | 18 – 30% | Under 3% |
| Inbox placement | Degrading over time | Stable |
| Meetings booked (typical) | 2 – 3 | 5 – 7 |
| Effective cost per meeting | High and rising | Roughly halved |
| Rep hours on manual research | 6 – 10 hrs/week | 1 – 2 hrs/week |
The reason data quality is the highest-ROI CAC lever is that it improves the numerator and the denominator at the same time: fewer wasted tool credits and rep hours (less spend), more meetings from the same volume (more customers).
Where do the main data tools sit on cost?#
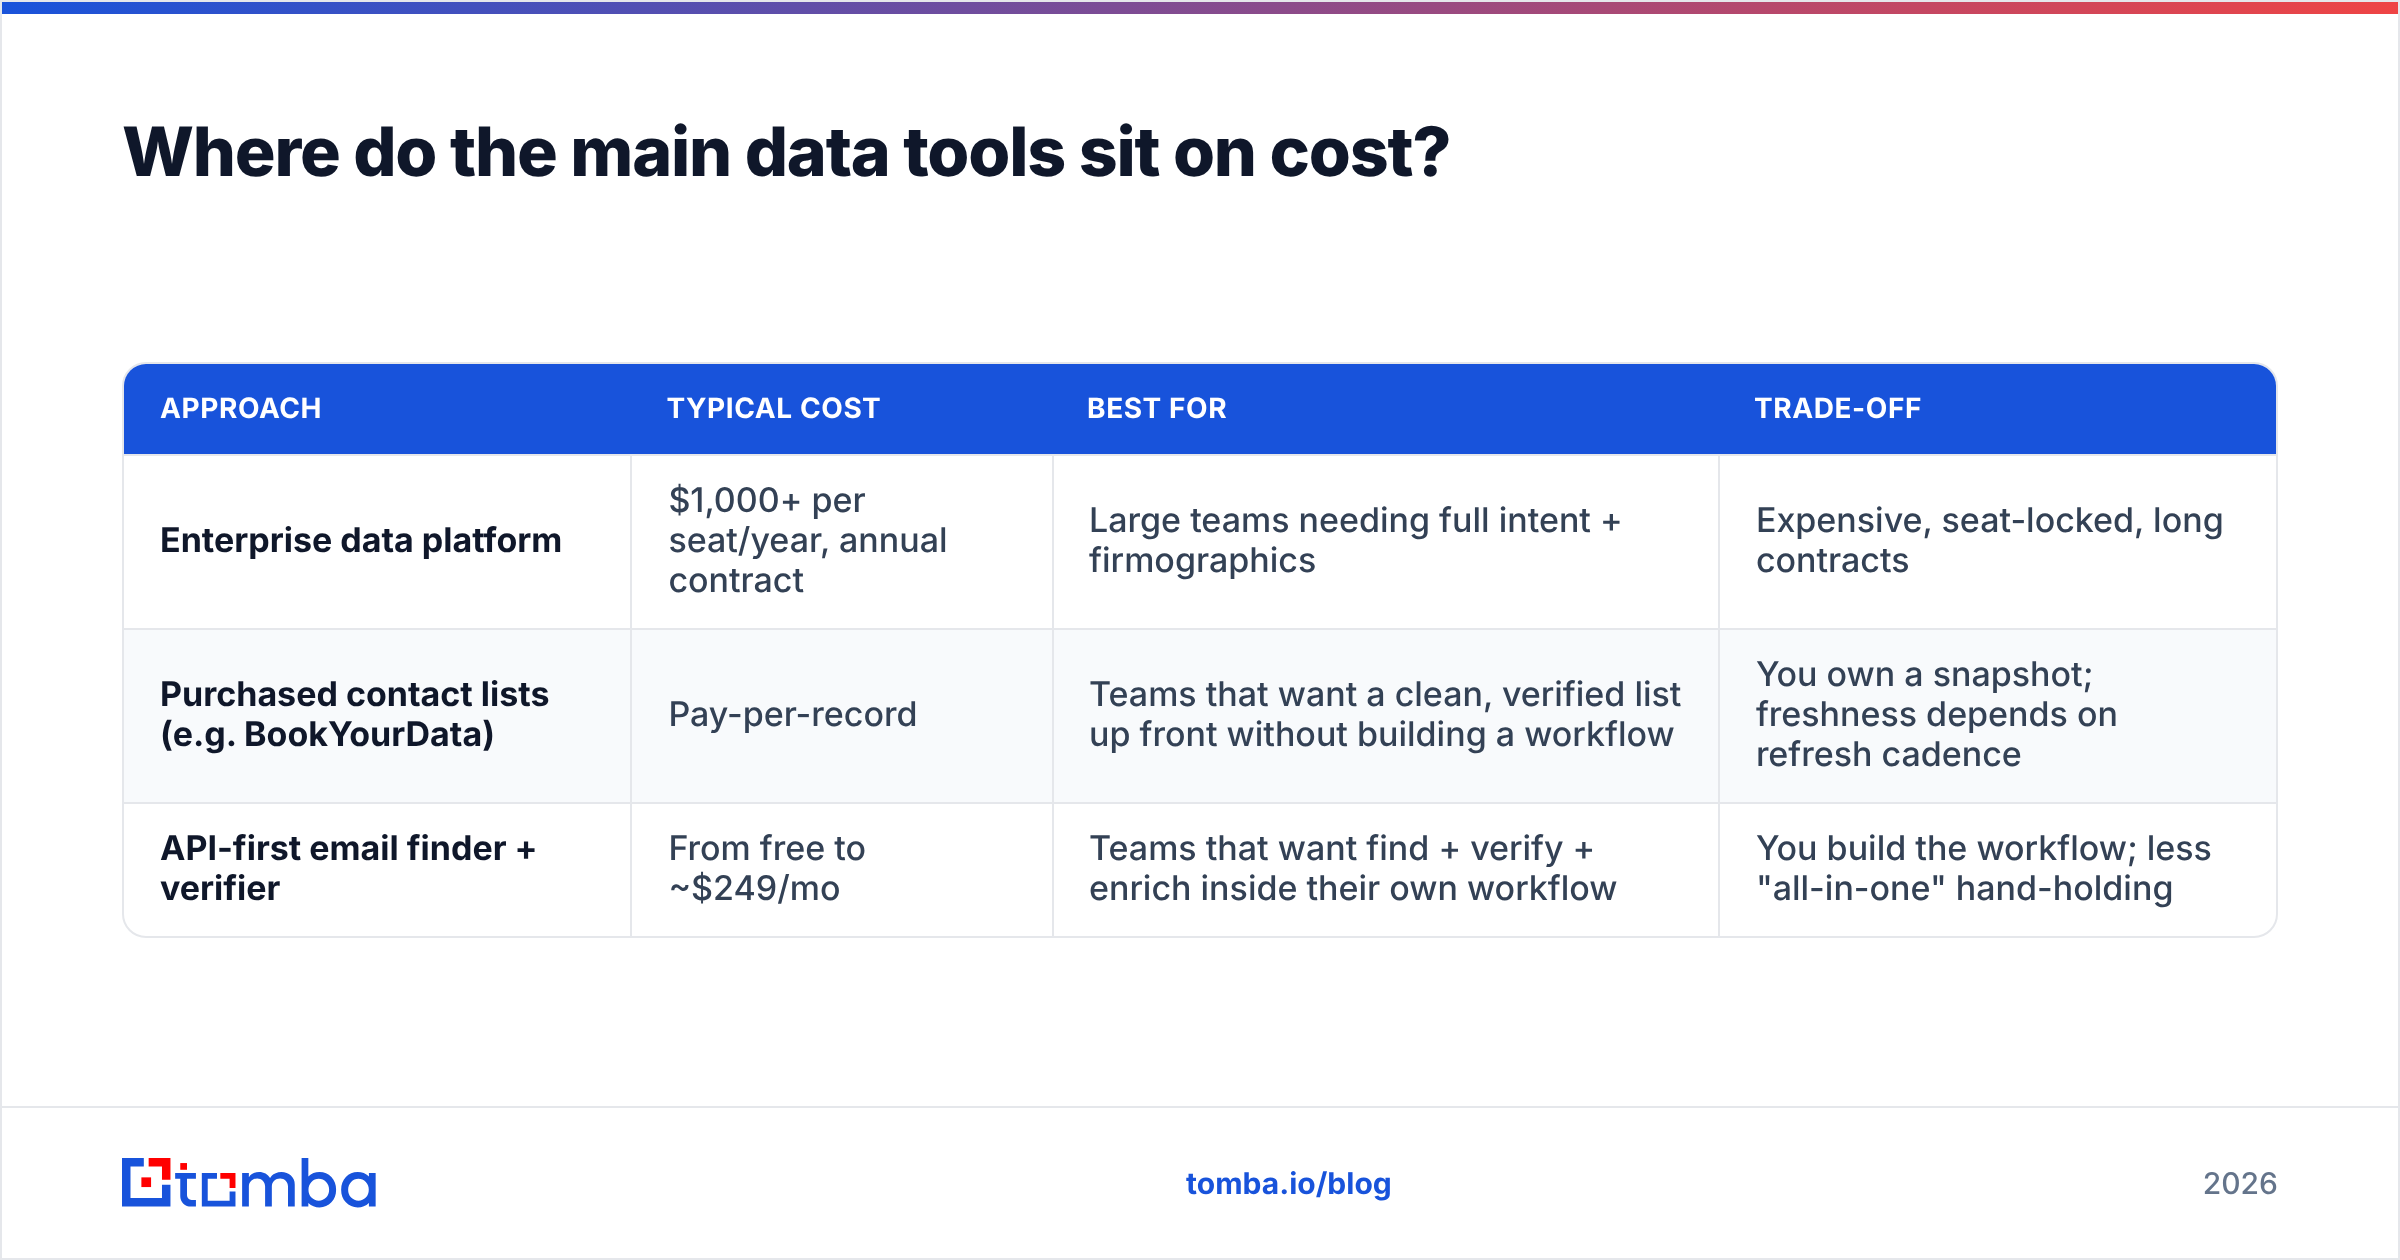
Since data spend is a CAC input, the price of your data stack matters directly. The market splits into three rough shapes:
| Approach | Typical cost | Best for | Trade-off |
|---|---|---|---|
| Enterprise data platform | $1,000+ per seat/year, annual contract | Large teams needing full intent + firmographics | Expensive, seat-locked, long contracts |
| Purchased contact lists (e.g. BookYourData) | Pay-per-record | Teams that want a clean, verified list up front without building a workflow | You own a snapshot; freshness depends on refresh cadence |
| API-first email finder + verifier | From free to ~$249/mo | Teams that want find + verify + enrich inside their own workflow | You build the workflow; less "all-in-one" hand-holding |
Tomba sits in the third bucket. Tomba pricing starts with a free tier at 25 searches/month, then Starter at $49/mo, Growth at $99/mo, Pro at $249/mo, and custom Enterprise. Because it's API- and credit-based rather than seat-based, you don't pay $1,000+ per rep for a tool that some of them use twice a week — which is exactly the kind of quiet overspend that shows up in CAC and nowhere else.
How should you report CAC to a board or exec team?#
Four rules keep the conversation honest:
- Show CAC segmented, always. One blended number invites the wrong conclusion. Show SMB / mid-market / enterprise side by side.
- Pair CAC with payback and LTV:CAC. CAC alone tells you cost. The pair tells you whether growth is compounding or leaking.
- Lag the spend. Match spend to the cohort it actually produced, using your median sales cycle as the offset.
- Name the inputs. State exactly what's in and out of the numerator. If you change the definition mid-year, restate history — otherwise you've manufactured a trend.
If you want the number to actually change behavior, put it in the same review as pipeline conversion and cycle time. CAC is a downstream symptom of those two. Treating it as a standalone target is how teams end up cutting the budget that was working. Sound revenue operations practice is to instrument the inputs, not just report the output.
What's the fastest thing you can do this week?#
Pull your last 90 days of GTM spend — including payroll — divide by closed-won, and compare that number to what your dashboard has been showing. If the gap is more than 2×, your CAC has been fiction, and every downstream decision built on it is suspect.
Then look at the cheapest lever: your list. Export a sample of the contacts your reps sequenced last month and check what percentage were actually deliverable. If more than one in ten bounced, you've found spend you can recover without cutting a single line item.
That's where a clean top of funnel pays for itself. Tomba's Email Finder gives you verified professional emails by domain, name, or company — with a free tier to test the accuracy on your own list before you commit, and a $49/mo Starter plan that costs less than a fraction of one wasted SDR week. Find the right person, verify the address, and stop paying for meetings that were never going to happen.
Related guides#
Ready to find emails that actually work?
Join 150,000+ professionals who stopped guessing and started sending. Free credits on signup — no credit card required.
Get the Tomba newsletter
Practical outbound tactics and product updates — once every two weeks.
About the author