CRM Sales Pipeline Report: The 2026 Guide to Building One
A CRM sales pipeline report only helps if it predicts revenue instead of flattering it. Here are the metrics, stages, and blind spots that separate a report your team trusts from a dashboard everyone ignores.
Most sales leaders open their CRM sales pipeline report every Monday, nod at a big number, and close it. That number is usually wrong. Not because the CRM is broken, but because the report measures activity the team logged instead of revenue the business will actually collect.
This guide shows you how to build a pipeline report that survives contact with a real forecast — which metrics matter, how to structure stages, and the blind spots that quietly inflate every dashboard.
TL;DR#
- A CRM sales pipeline report visualizes every open deal by stage, value, age, and probability so you can forecast revenue and spot where deals stall.
- The four metrics that actually predict revenue are stage conversion rate, average deal age, pipeline coverage ratio, and slippage — not total pipeline value.
- Garbage in, garbage out: reports are only as good as the contact and account data feeding your CRM, which is why enrichment and verification sit upstream of every dashboard.
- Weighted pipeline beats raw pipeline for forecasting, but only if your stage probabilities come from historical win rates, not gut feel.
- Build the report once as a repeatable template, then automate the data hygiene so it stays trustworthy week over week.
What is a CRM sales pipeline report?#
A CRM sales pipeline report is a structured view of every open opportunity in your CRM, grouped by deal stage, showing value, age, owner, and probability to close. Think of it like an X-ray of your revenue: the summary dashboard tells you the patient looks healthy, but the report shows you the actual bones — where deals are dense, where they're thinning out, and where something is quietly broken.
It answers three questions a raw "total pipeline" number never can:
- Will we hit the number this quarter? (coverage and weighted value)
- Where are deals dying? (stage conversion and drop-off)
- Which reps or segments need help now? (age, slippage, and owner breakdown)
The report is not a vanity dashboard. A good one changes what you do on Tuesday morning.
Why do most pipeline reports lie to you?#
Because they report what was entered, not what is true. Reps are optimists by profession. Deals sit in "Negotiation" for 90 days because nobody wants to move them backward. Close dates get pushed a week at a time until a $50k deal has "slipped" for two quarters while still counting as this-quarter pipeline.
The three most common distortions:
- Stale data. A deal tied to a contact who left the company three months ago is not a real deal. If your CRM contacts aren't verified, your pipeline is fiction dressed as a forecast.
- Zombie deals. Opportunities that haven't had an activity in 30+ days but still count at full value.
- Sandbagging and happy-ears. Reps under-report to protect quota or over-report to look busy. Both wreck the aggregate.

The fix isn't a fancier chart. It's clean inputs plus a small set of metrics that are hard to fake.
Which metrics belong in a CRM sales pipeline report?#
Four metrics carry most of the predictive weight. Everything else is context.
- Stage conversion rate — the percentage of deals that advance from each stage to the next. This is your leak detector. If 60% of deals move from Discovery to Demo but only 20% move from Demo to Proposal, your demo isn't landing.
- Average deal age (by stage) — how long deals sit before advancing. Rising age is the earliest warning sign of a stalling quarter, weeks before revenue misses show up.
- Pipeline coverage ratio — total open pipeline divided by your quota for the period. Most B2B teams need 3x–4x coverage because win rates rarely exceed 25–30%.
- Slippage rate — the share of deals whose close date moved out of the period. High slippage means your close dates (and therefore your forecast) are unreliable.
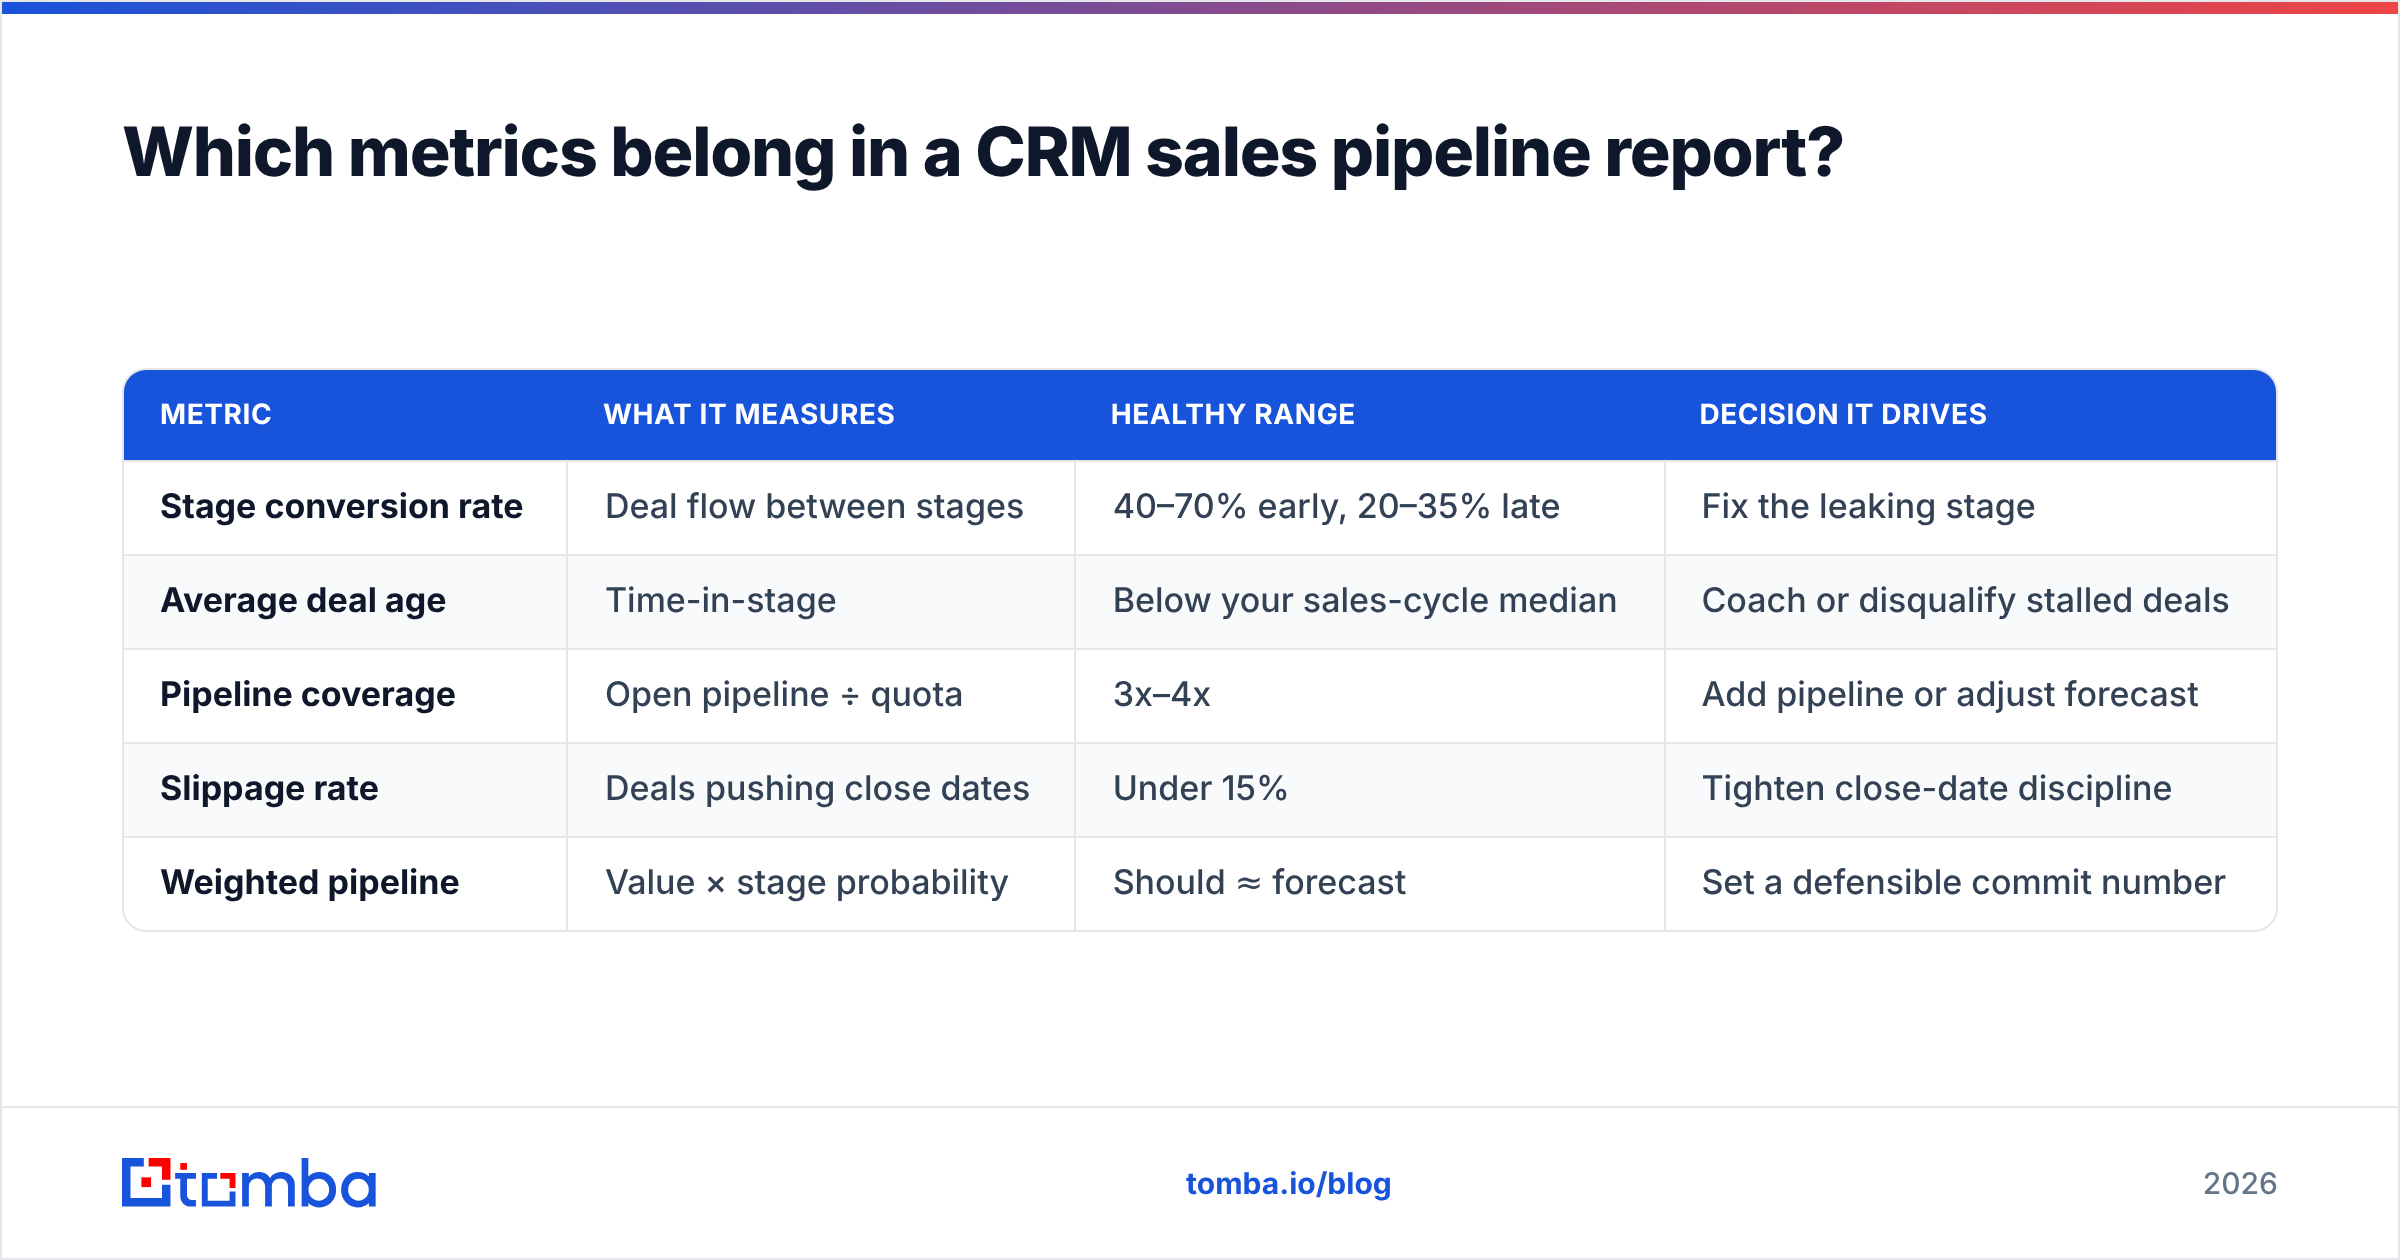
Here's how they map to the decision each one drives:
| Metric | What it measures | Healthy range | Decision it drives |
|---|---|---|---|
| Stage conversion rate | Deal flow between stages | 40–70% early, 20–35% late | Fix the leaking stage |
| Average deal age | Time-in-stage | Below your sales-cycle median | Coach or disqualify stalled deals |
| Pipeline coverage | Open pipeline ÷ quota | 3x–4x | Add pipeline or adjust forecast |
| Slippage rate | Deals pushing close dates | Under 15% | Tighten close-date discipline |
| Weighted pipeline | Value × stage probability | Should ≈ forecast | Set a defensible commit number |
Notice what's missing: raw total pipeline value. It's the number everyone quotes and the one that predicts revenue worst, because it treats a brand-new lead and a signed-verbal deal as equal.
How do you structure pipeline stages that report cleanly?#
Stages should map to buyer actions, not seller hopes. "Interested" is not a stage — it's a feeling. "Demo completed" is a stage, because it either happened or it didn't.
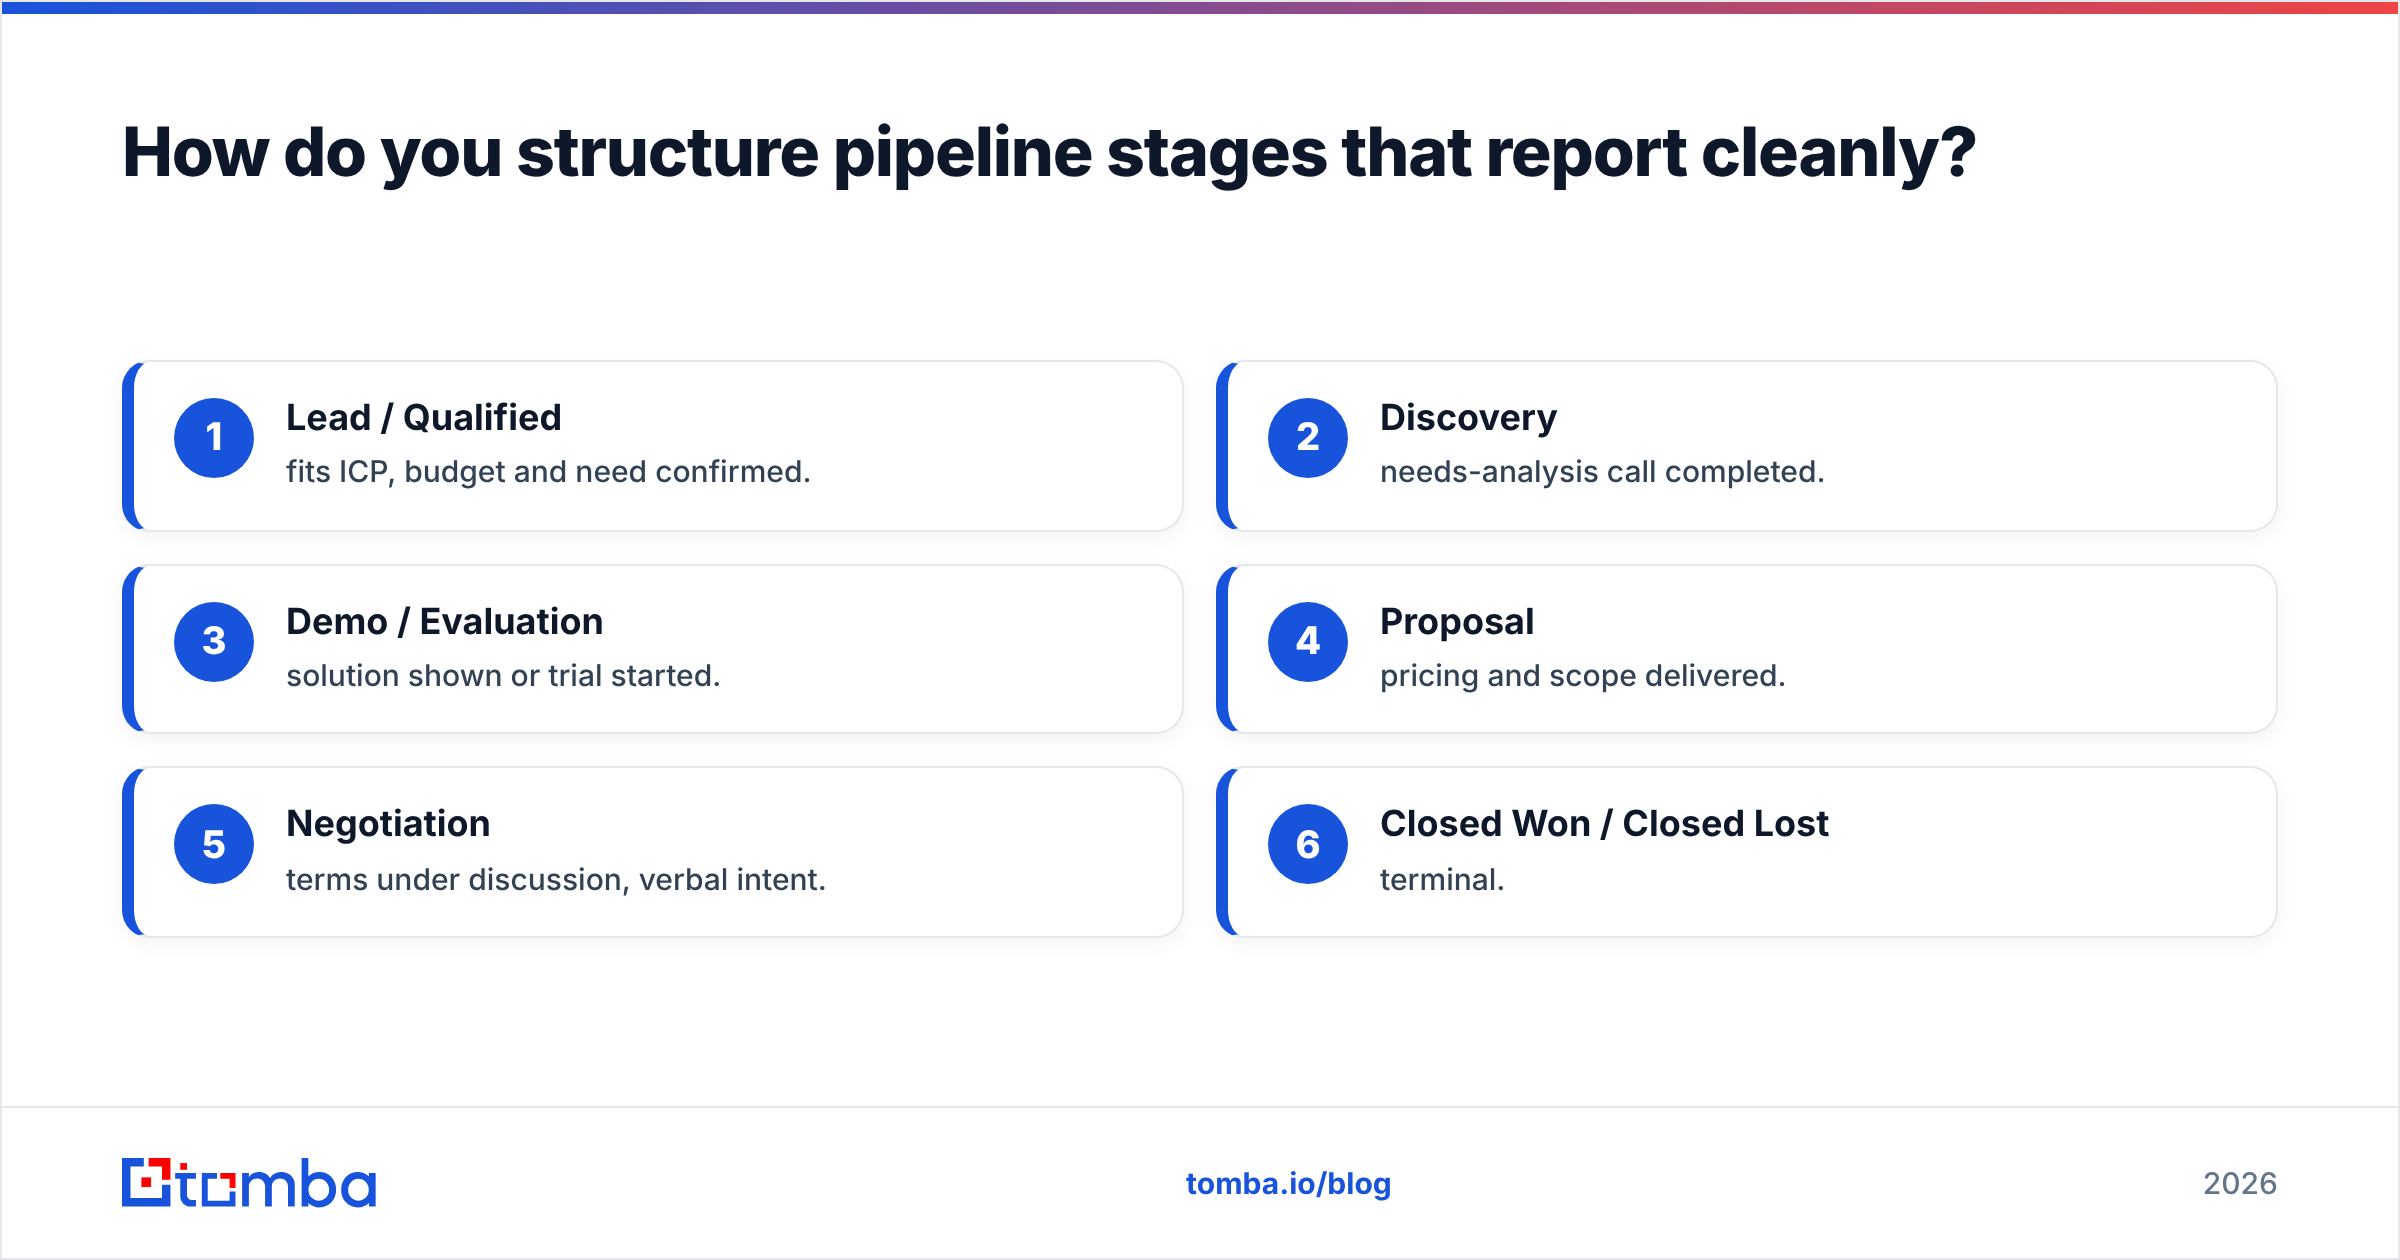
A clean B2B structure that reports well:
- Lead / Qualified — fits ICP, budget and need confirmed.
- Discovery — needs-analysis call completed.
- Demo / Evaluation — solution shown or trial started.
- Proposal — pricing and scope delivered.
- Negotiation — terms under discussion, verbal intent.
- Closed Won / Closed Lost — terminal.
Assign each stage a probability derived from your own historical conversion data, not a default template. If deals in Proposal have historically closed 45% of the time, that stage is 45% — full stop. This is what turns a pipeline report into a sales forecast you can defend to a board.
Weighted vs. raw pipeline: which should you forecast on?#
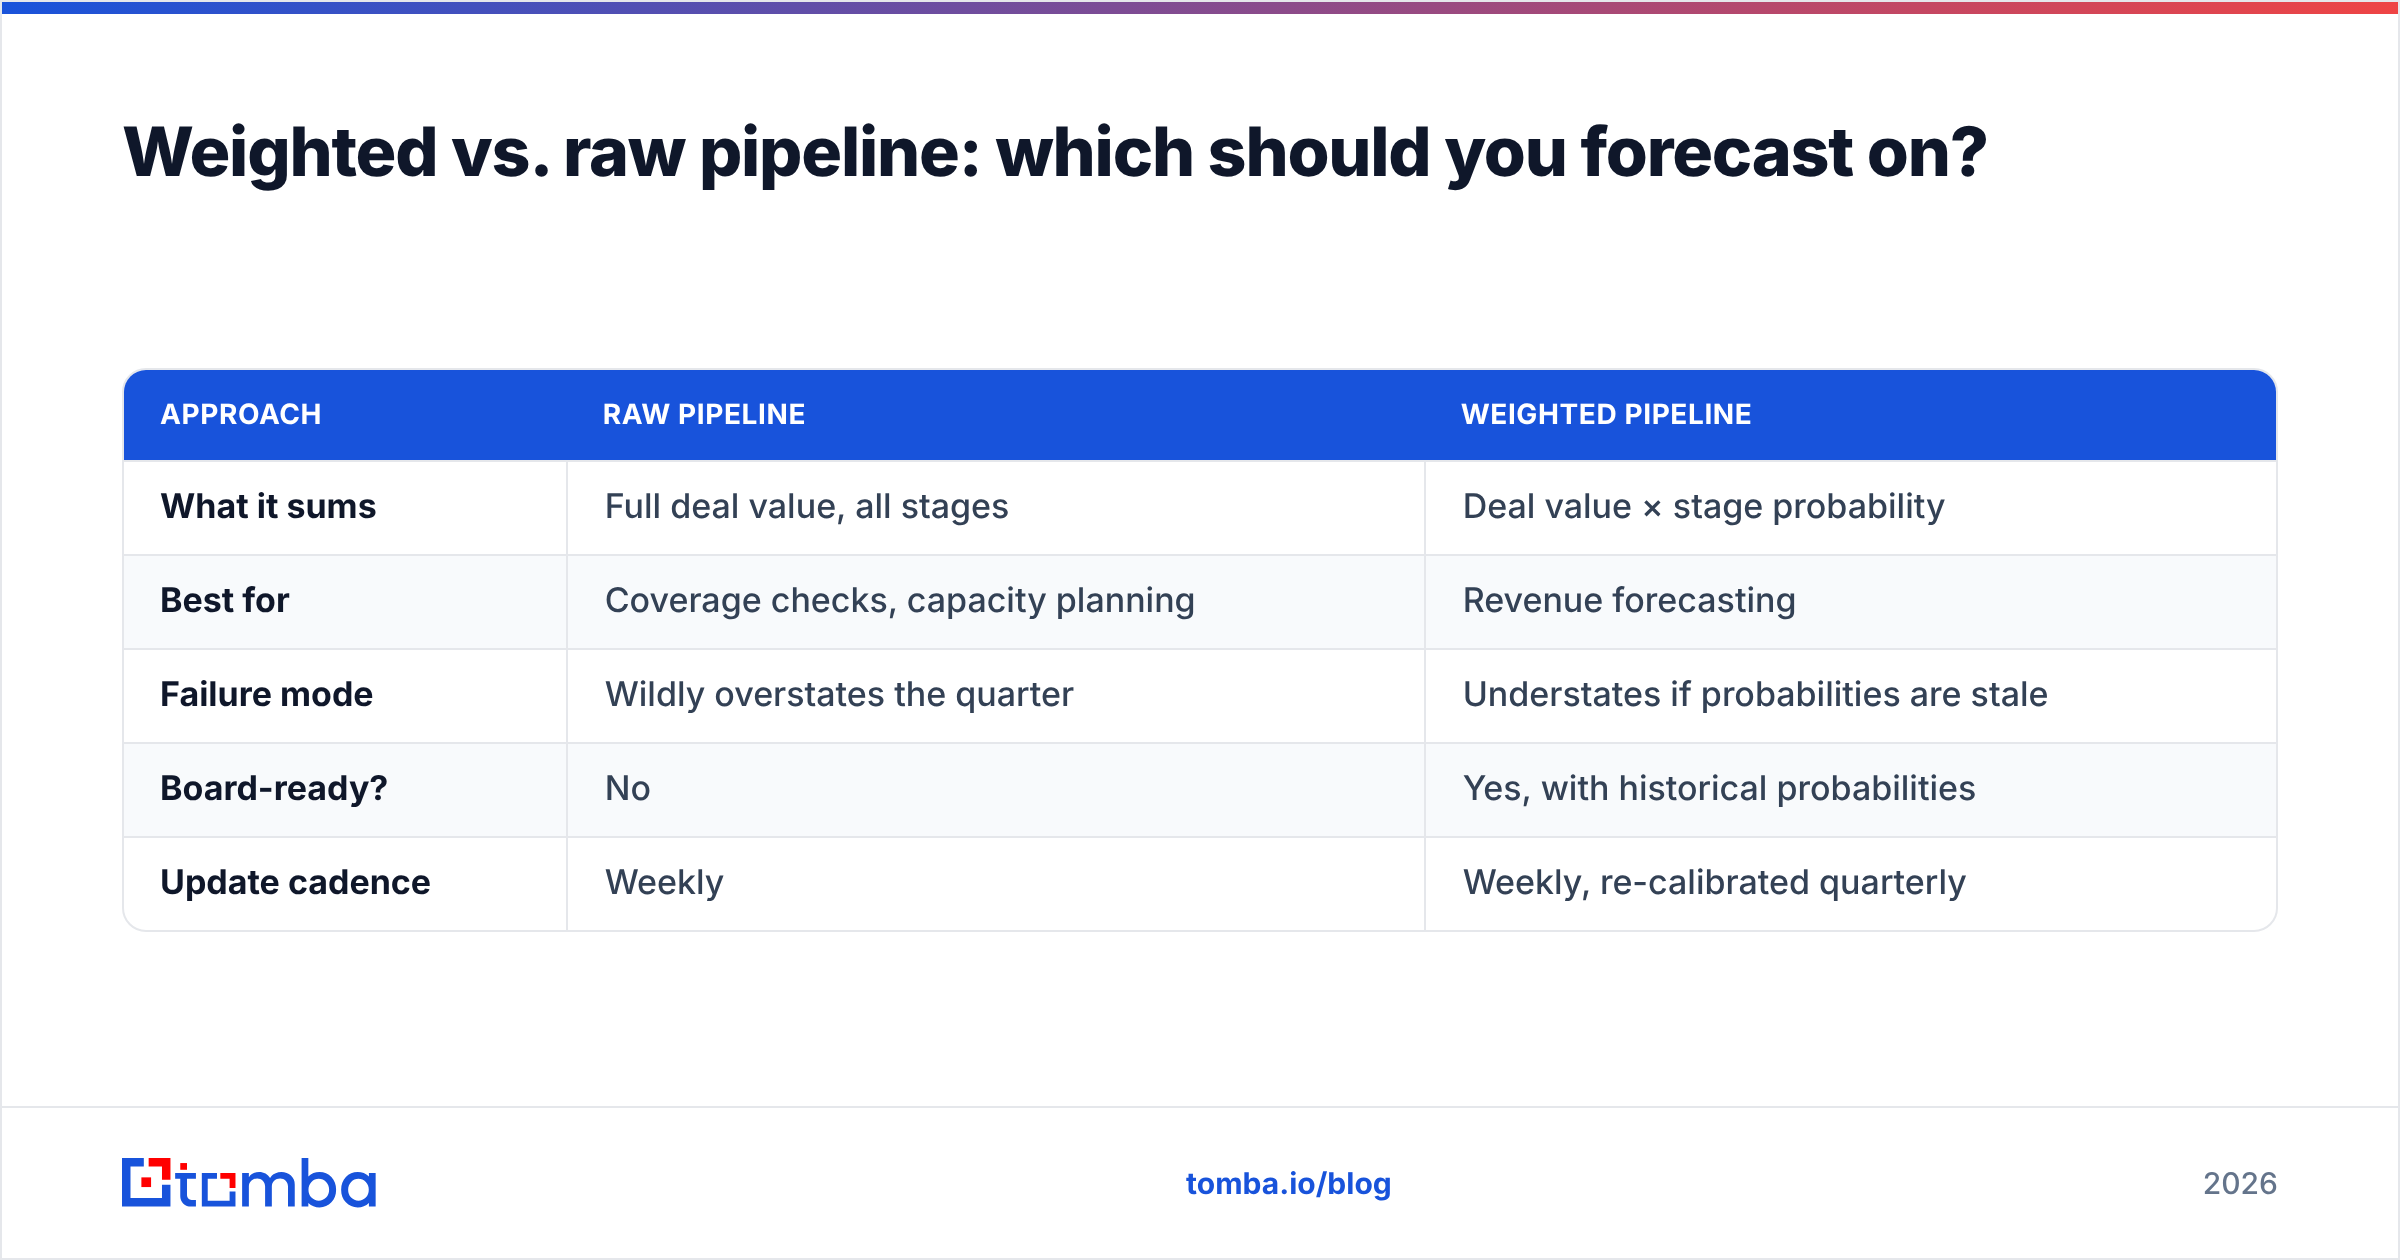
Forecast on weighted pipeline; monitor raw pipeline for capacity. Raw pipeline tells you whether you have enough at-bats. Weighted pipeline tells you what those at-bats are actually worth.
| Approach | Raw pipeline | Weighted pipeline |
|---|---|---|
| What it sums | Full deal value, all stages | Deal value × stage probability |
| Best for | Coverage checks, capacity planning | Revenue forecasting |
| Failure mode | Wildly overstates the quarter | Understates if probabilities are stale |
| Board-ready? | No | Yes, with historical probabilities |
| Update cadence | Weekly | Weekly, re-calibrated quarterly |
A team with $2M raw pipeline and honest stage probabilities might carry $520k weighted. Reporting the $2M to leadership feels great in March and gets you fired in April. The weighted number, tied to real conversion history, is the one that keeps its promises.
Why does data quality decide whether the report is worth reading?#
Your pipeline report is a mirror of your CRM data, and most CRM data decays fast — B2B contact records go stale at roughly 22–30% per year as people change jobs, per widely cited industry benchmarks from firms like Gartner and validated across sales-ops surveys. A report built on decayed data doesn't just mislead; it does so confidently.
Two hygiene layers keep the report honest:
- Verification — every contact tied to an open deal should have a deliverable, verified email. Bouncing contacts are a signal the account has changed. Run open-deal contacts through an email verifier on a schedule so dead accounts surface before they poison the forecast.
- Enrichment — missing firmographic fields (company size, industry, revenue band) make segmentation impossible. You can't report conversion by segment if half your accounts have no segment. Data enrichment fills those gaps automatically.
This is the unglamorous work that decides everything downstream. A gorgeous dashboard on top of unverified contacts is a liability with good lighting. If your pipeline keeps getting polluted by contacts who left months ago, the fix starts upstream — with how you find email addresses and confirm they're still valid before a deal ever enters the report.
How do you build the report step by step?#
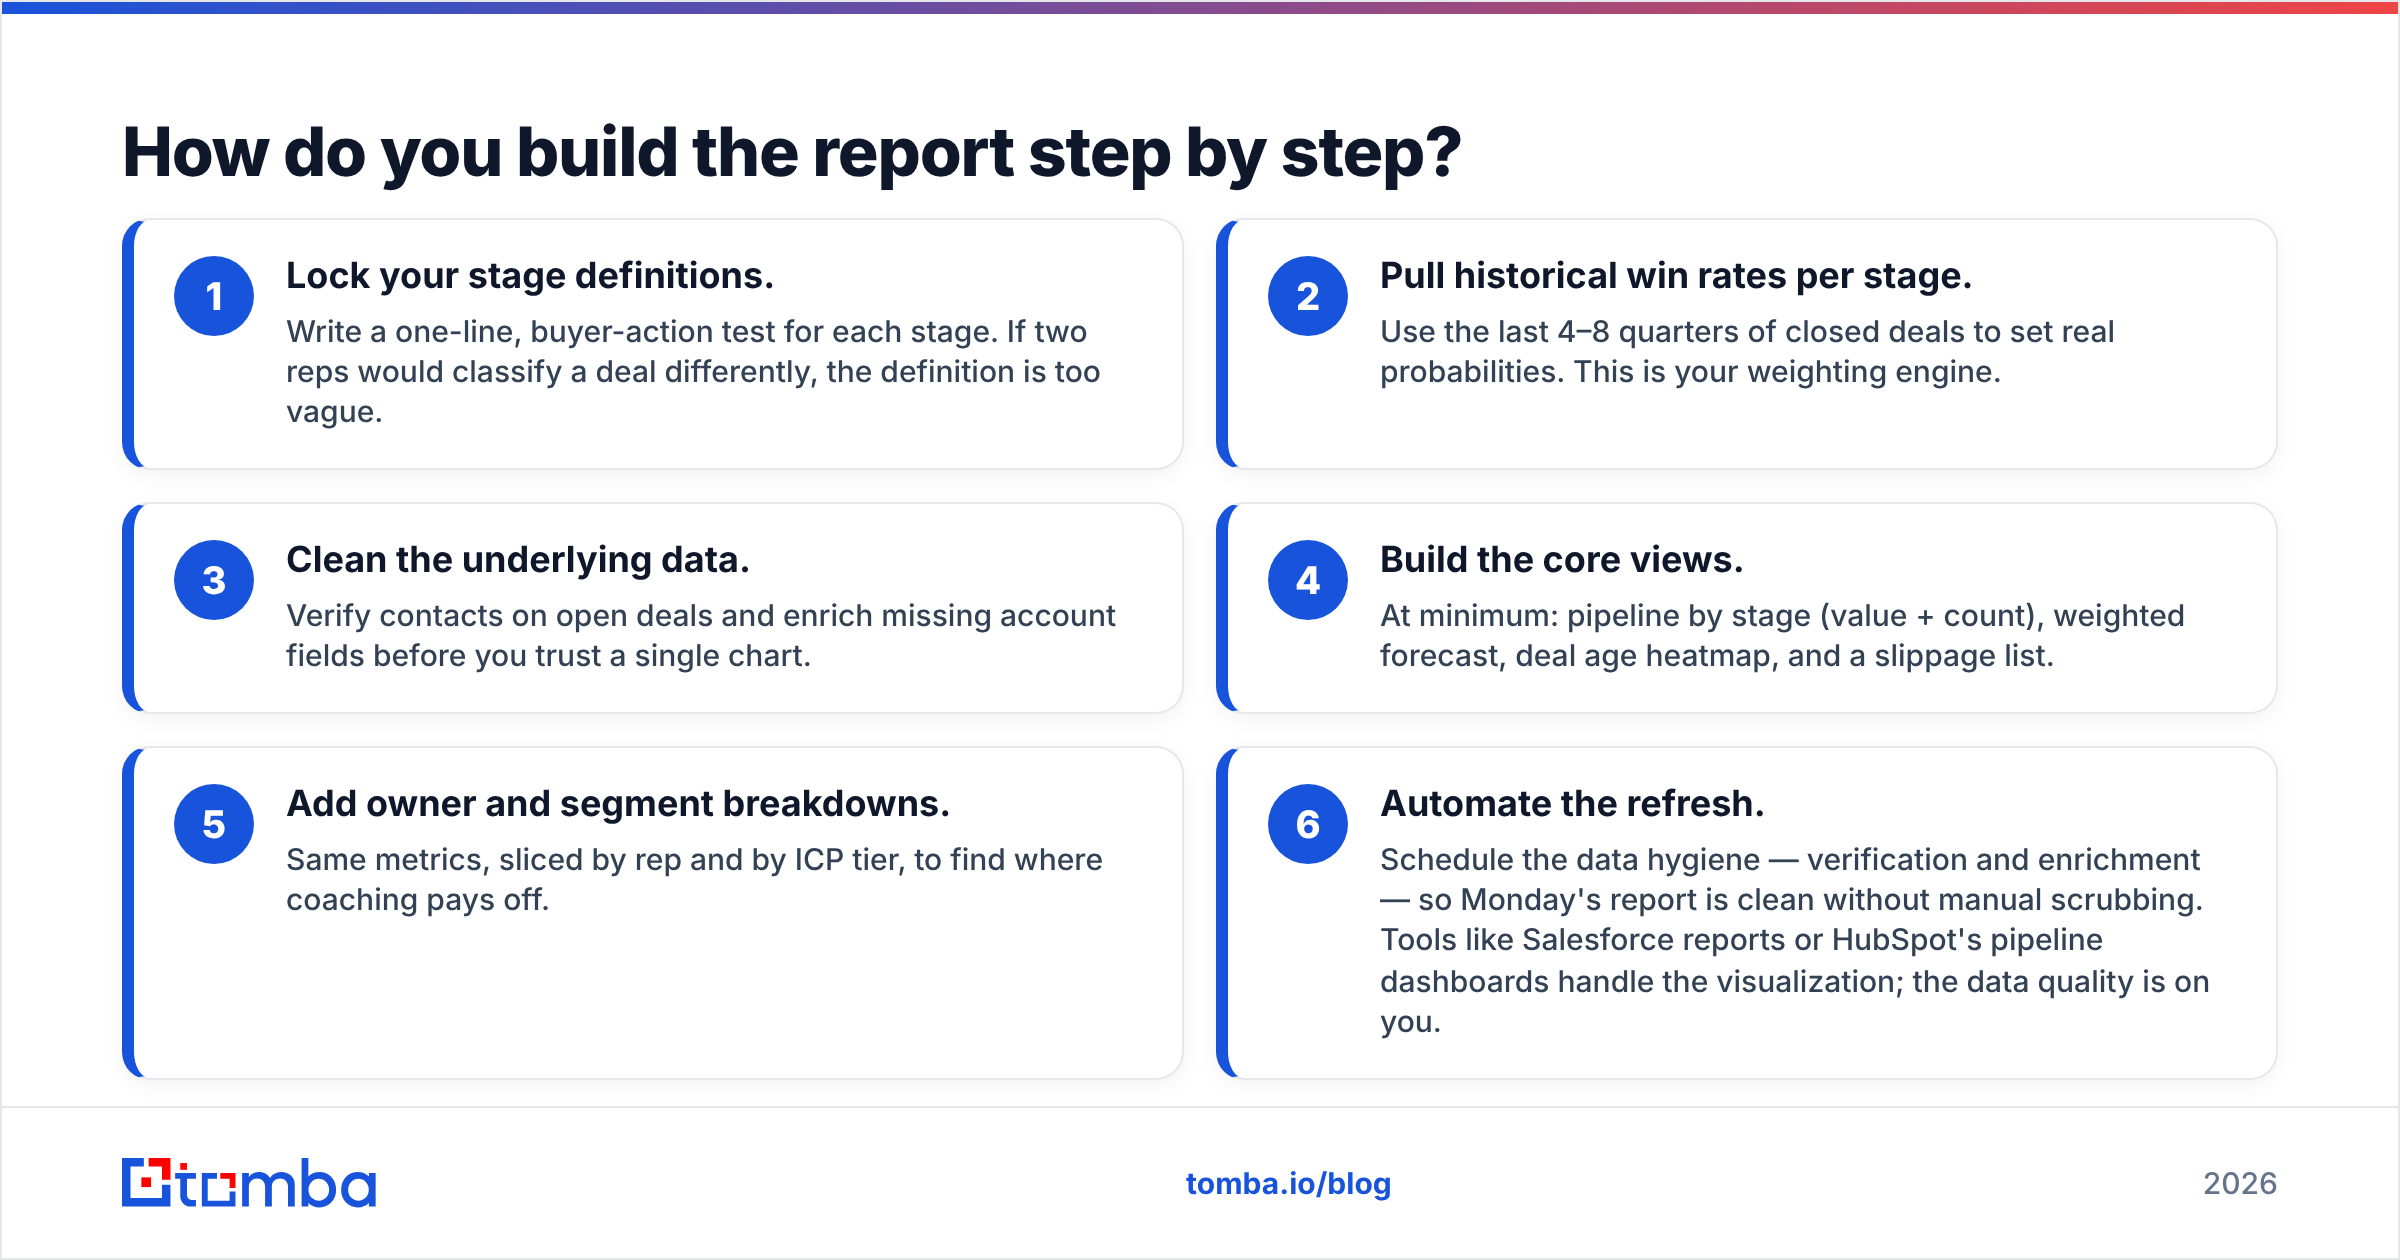
You can build a durable CRM sales pipeline report in an afternoon. Keeping it accurate is the ongoing part.
- Lock your stage definitions. Write a one-line, buyer-action test for each stage. If two reps would classify a deal differently, the definition is too vague.
- Pull historical win rates per stage. Use the last 4–8 quarters of closed deals to set real probabilities. This is your weighting engine.
- Clean the underlying data. Verify contacts on open deals and enrich missing account fields before you trust a single chart.
- Build the core views. At minimum: pipeline by stage (value + count), weighted forecast, deal age heatmap, and a slippage list.
- Add owner and segment breakdowns. Same metrics, sliced by rep and by ICP tier, to find where coaching pays off.
- Automate the refresh. Schedule the data hygiene — verification and enrichment — so Monday's report is clean without manual scrubbing. Tools like Salesforce reports or HubSpot's pipeline dashboards handle the visualization; the data quality is on you.
The teams whose forecasts land aren't the ones with the prettiest dashboards. They're the ones whose inputs are clean enough that the dashboard tells the truth.
What are the most common pipeline reporting mistakes?#
- Reporting on total pipeline value. It's the easiest number to grow and the worst predictor of revenue.
- Never disqualifying. A pipeline that only grows is a pipeline full of zombies. Set an age threshold and force decisions.
- Static stage probabilities. Copying a template's "20/40/60/80" instead of using your own win rates guarantees a wrong forecast.
- Ignoring data decay. Unverified contacts make every downstream metric soft.
- One report for everyone. A rep needs deal age; a CFO needs weighted forecast. Same data, different cuts.
Avoid those five and your report jumps from decoration to decision-making tool.
Build reports on data you can trust#
A CRM sales pipeline report is only as honest as the contacts and accounts feeding it. Before you obsess over chart types and stage probabilities, make sure the people in your pipeline still work where your CRM says they do and can actually be reached.
That's where Tomba's Email Finder earns its place in your stack — it finds and verifies professional email addresses by name, company, or domain so every deal in your report is anchored to a real, reachable contact. Start on the free tier (25 searches/month), and when your pipeline outgrows it, the Starter plan is $49/month. See full Tomba pricing to match a plan to your team. Clean inputs, honest reports, forecasts that hold. Everything downstream depends on getting that first step right.
Related guides#
Ready to find emails that actually work?
Join 150,000+ professionals who stopped guessing and started sending. Free credits on signup — no credit card required.
Get the Tomba newsletter
Practical outbound tactics and product updates — once every two weeks.
About the author