Customer Acquisition Cost Example: A Real-World CAC Breakdown for 2026
A no-fluff customer acquisition cost example with the real formula, a full worked calculation, benchmarks by channel, and the hidden costs that quietly wreck your CAC math.
Most teams can recite the customer acquisition cost formula and still get the number wrong. They divide spend by customers, land on a tidy figure, and never notice that half their real acquisition costs were sitting in payroll, tooling, and wasted data. This guide fixes that with a concrete customer acquisition cost example you can copy — the full math, the channel breakdown, and the line items people forget.
TL;DR#
- CAC = total sales and marketing spend ÷ new customers acquired in the same period. Sounds simple; the "total spend" part is where teams go wrong.
- A realistic customer acquisition cost example includes salaries, tools, ad spend, agency fees, and bad-data waste — not just your ad bill.
- Blended CAC hides your worst channels. Always calculate CAC per channel too.
- Healthy SaaS benchmarks sit around a 3:1 LTV:CAC ratio with a payback period under 12 months.
- The fastest lever most teams ignore: cleaner prospect data. Bounced emails and dead leads inflate CAC without adding a single customer.
What is customer acquisition cost (CAC)?#
Customer acquisition cost is the total amount you spend to win one new paying customer. Think of it like the true cost of catching one fish: not just the bait, but the boat, the fuel, the rod, and the hours you spent waiting. Count only the bait and you'll swear fishing is cheap — right up until the fuel bill arrives.
Formally, CAC ties directly to revenue operations health. It tells you whether your growth engine is profitable or quietly burning cash. Pair it with lifetime value (LTV) and you get the single most important ratio in B2B growth: how much a customer is worth versus what they cost to acquire.
The basic formula:
CAC = (Total Sales Spend + Total Marketing Spend) ÷ Number of New Customers Acquired
The trap is the word "total." Most teams count ad spend and stop. A defensible CAC includes every dollar that touched acquisition during the period.
What actually belongs in "total spend"#
Here's the checklist people skip. Use it near every CAC calculation:
- Paid media — Google, LinkedIn, Meta, retargeting, sponsorships.
- Salaries and commissions — the loaded cost of SDRs, AEs, marketers, and their managers (base + commission + benefits).
- Software and tools — CRM, sales engagement, data providers, analytics, ad platforms.
- Agencies and contractors — freelancers, media buyers, content shops, design.
- Creative and content production — landing pages, video, collateral.
- Data and list costs — enrichment credits, database subscriptions, and the silent tax of bad data (bounces, wrong numbers, dead accounts).
Miss items 2 through 6 and your CAC looks 40–60% cheaper than reality. That fake number is how "profitable" campaigns quietly lose money.
What does a real customer acquisition cost example look like?#
Let's run the numbers for a mid-market B2B SaaS company over one quarter. This is the worked customer acquisition cost example most articles skip.
Assume Q1 2026 spend:
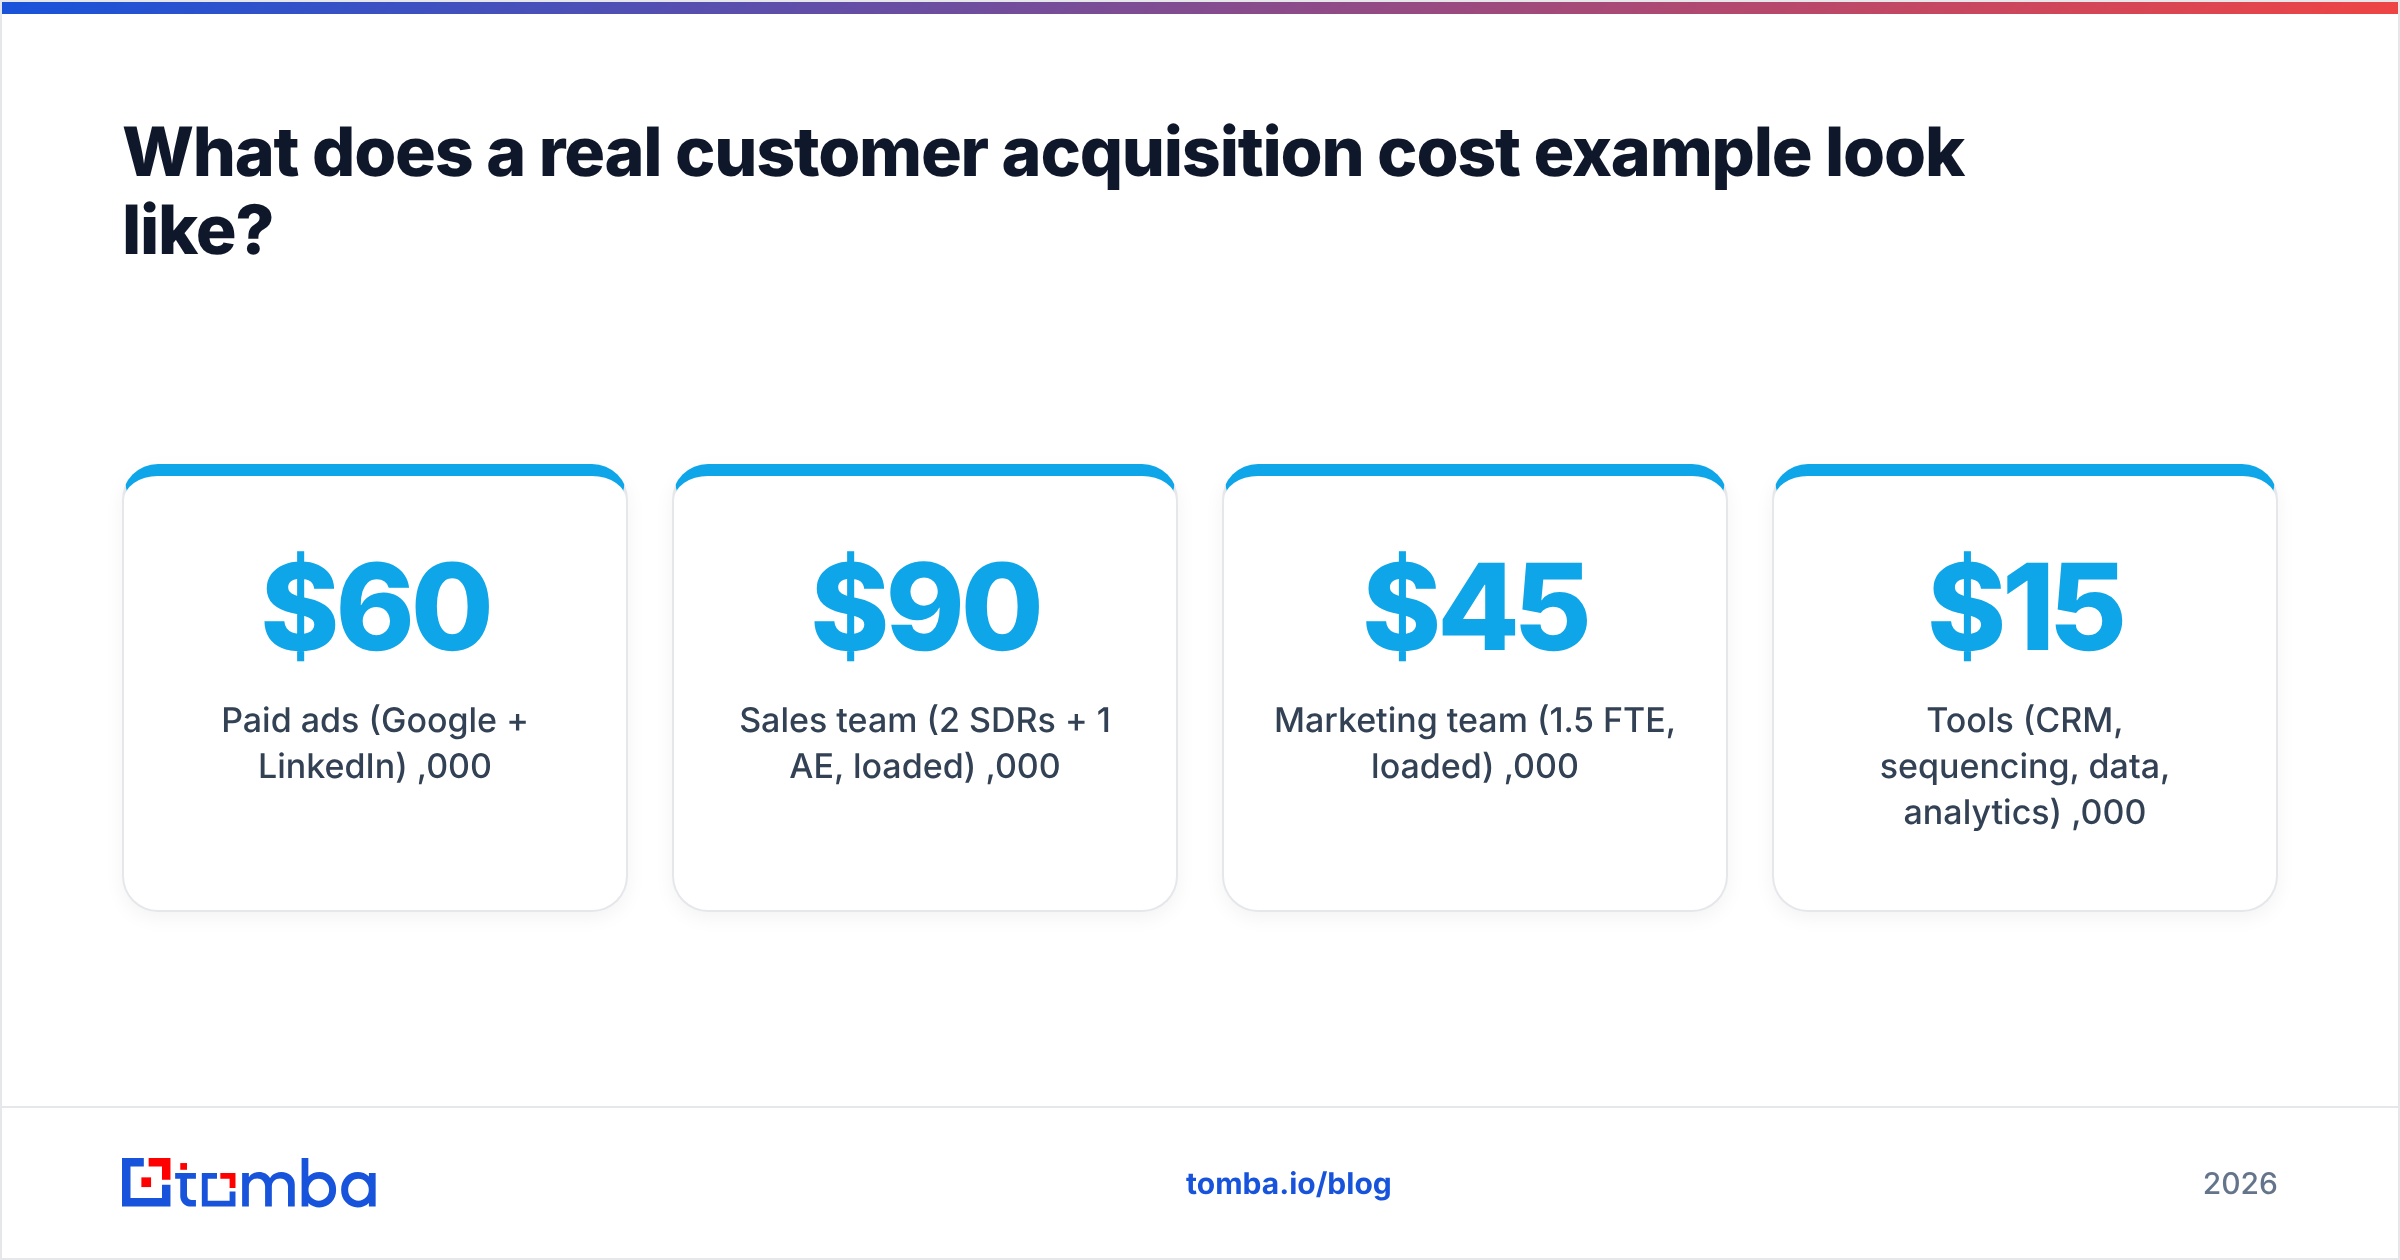
| Cost category | Quarterly spend |
|---|---|
| Paid ads (Google + LinkedIn) | $60,000 |
| Sales team (2 SDRs + 1 AE, loaded) | $90,000 |
| Marketing team (1.5 FTE, loaded) | $45,000 |
| Tools (CRM, sequencing, data, analytics) | $15,000 |
| Agency + content production | $20,000 |
| Data/enrichment + bad-data waste | $10,000 |
| Total acquisition spend | $240,000 |
New customers acquired that quarter: 80.
CAC = $240,000 ÷ 80 = $3,000 per customer.
Now watch what happens if you only counted ad spend, the way lazy dashboards do:
Fake CAC = $60,000 ÷ 80 = $750 per customer.
Same business, same quarter, and a 4x difference. The $750 number would greenlight aggressive scaling. The real $3,000 number forces a harder question: is each customer worth more than $3,000 over their lifetime? If your average customer pays $200/month and stays 24 months, LTV is roughly $4,800 (before margin). That's a 1.6:1 LTV:CAC ratio — below the 3:1 many investors want to see. Suddenly "scale it" becomes "fix it first."
How do you calculate CAC per channel, not just blended?#
Blended CAC is the average across everything. It's useful for board slides and dangerous for decisions, because it hides your best and worst performers behind one comfortable number.
Split the same quarter by channel:
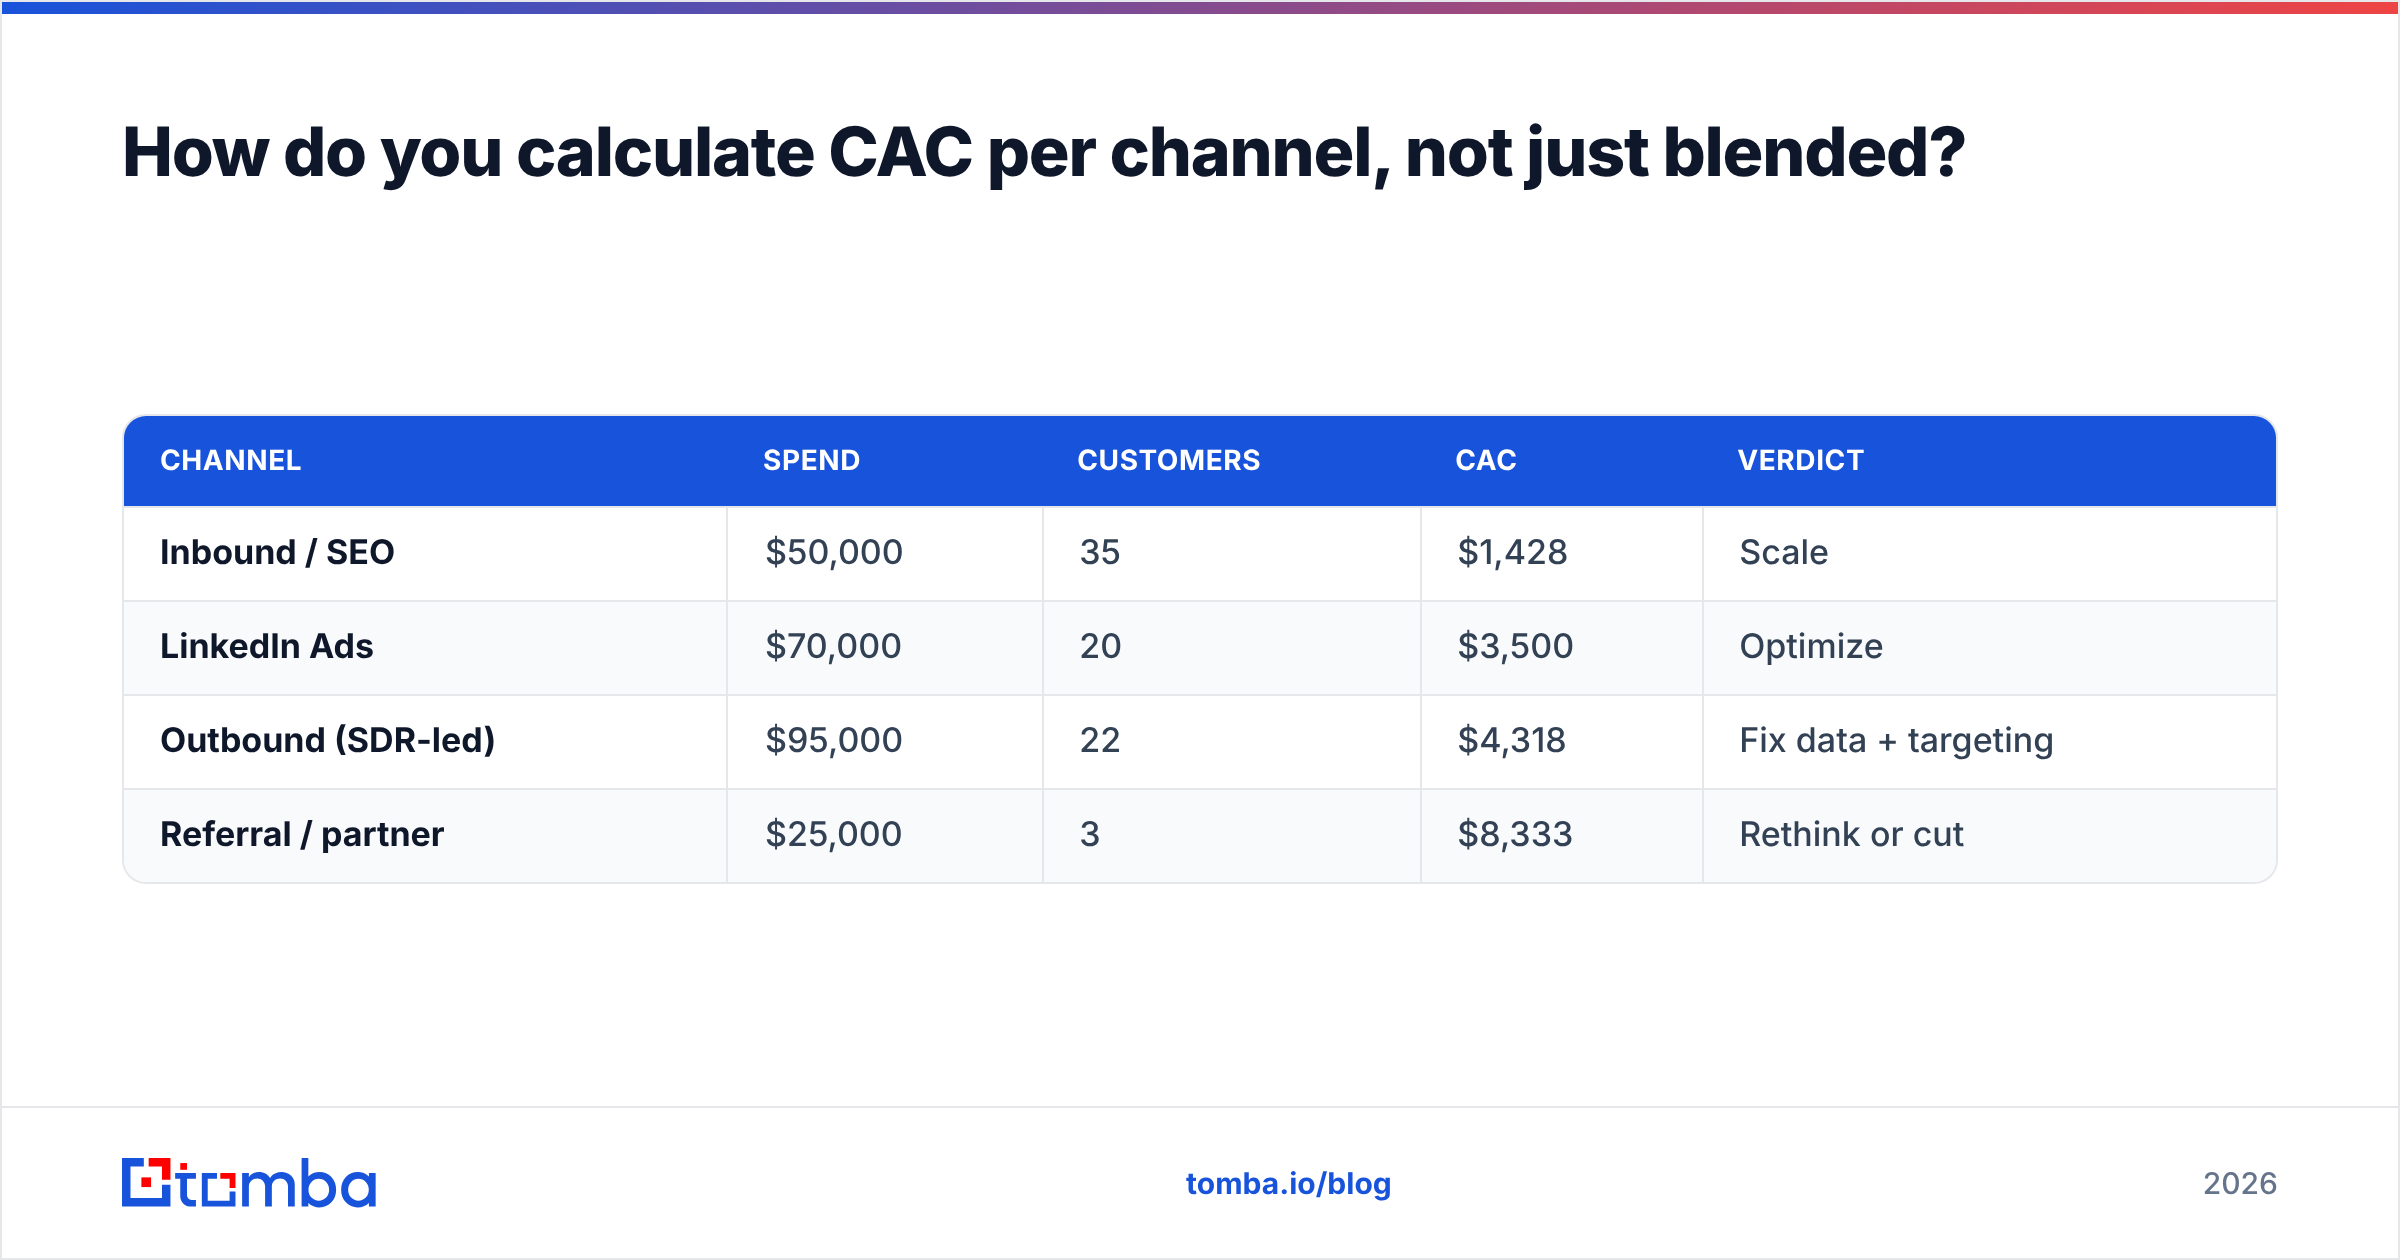
| Channel | Spend | Customers | CAC | Verdict |
|---|---|---|---|---|
| Inbound / SEO | $50,000 | 35 | $1,428 | Scale |
| LinkedIn Ads | $70,000 | 20 | $3,500 | Optimize |
| Outbound (SDR-led) | $95,000 | 22 | $4,318 | Fix data + targeting |
| Referral / partner | $25,000 | 3 | $8,333 | Rethink or cut |
The blended CAC ($3,000) told you nothing actionable. The per-channel view tells you exactly where to move budget: pour into inbound, tighten LinkedIn, and audit why outbound costs so much per win. Nine times out of ten, expensive outbound is a data problem — reps burning hours on bounced emails, wrong titles, and accounts that were never a fit.
This is where your B2B database and data enrichment quality show up directly in the CAC line. Cleaner inputs mean fewer wasted touches per closed deal.
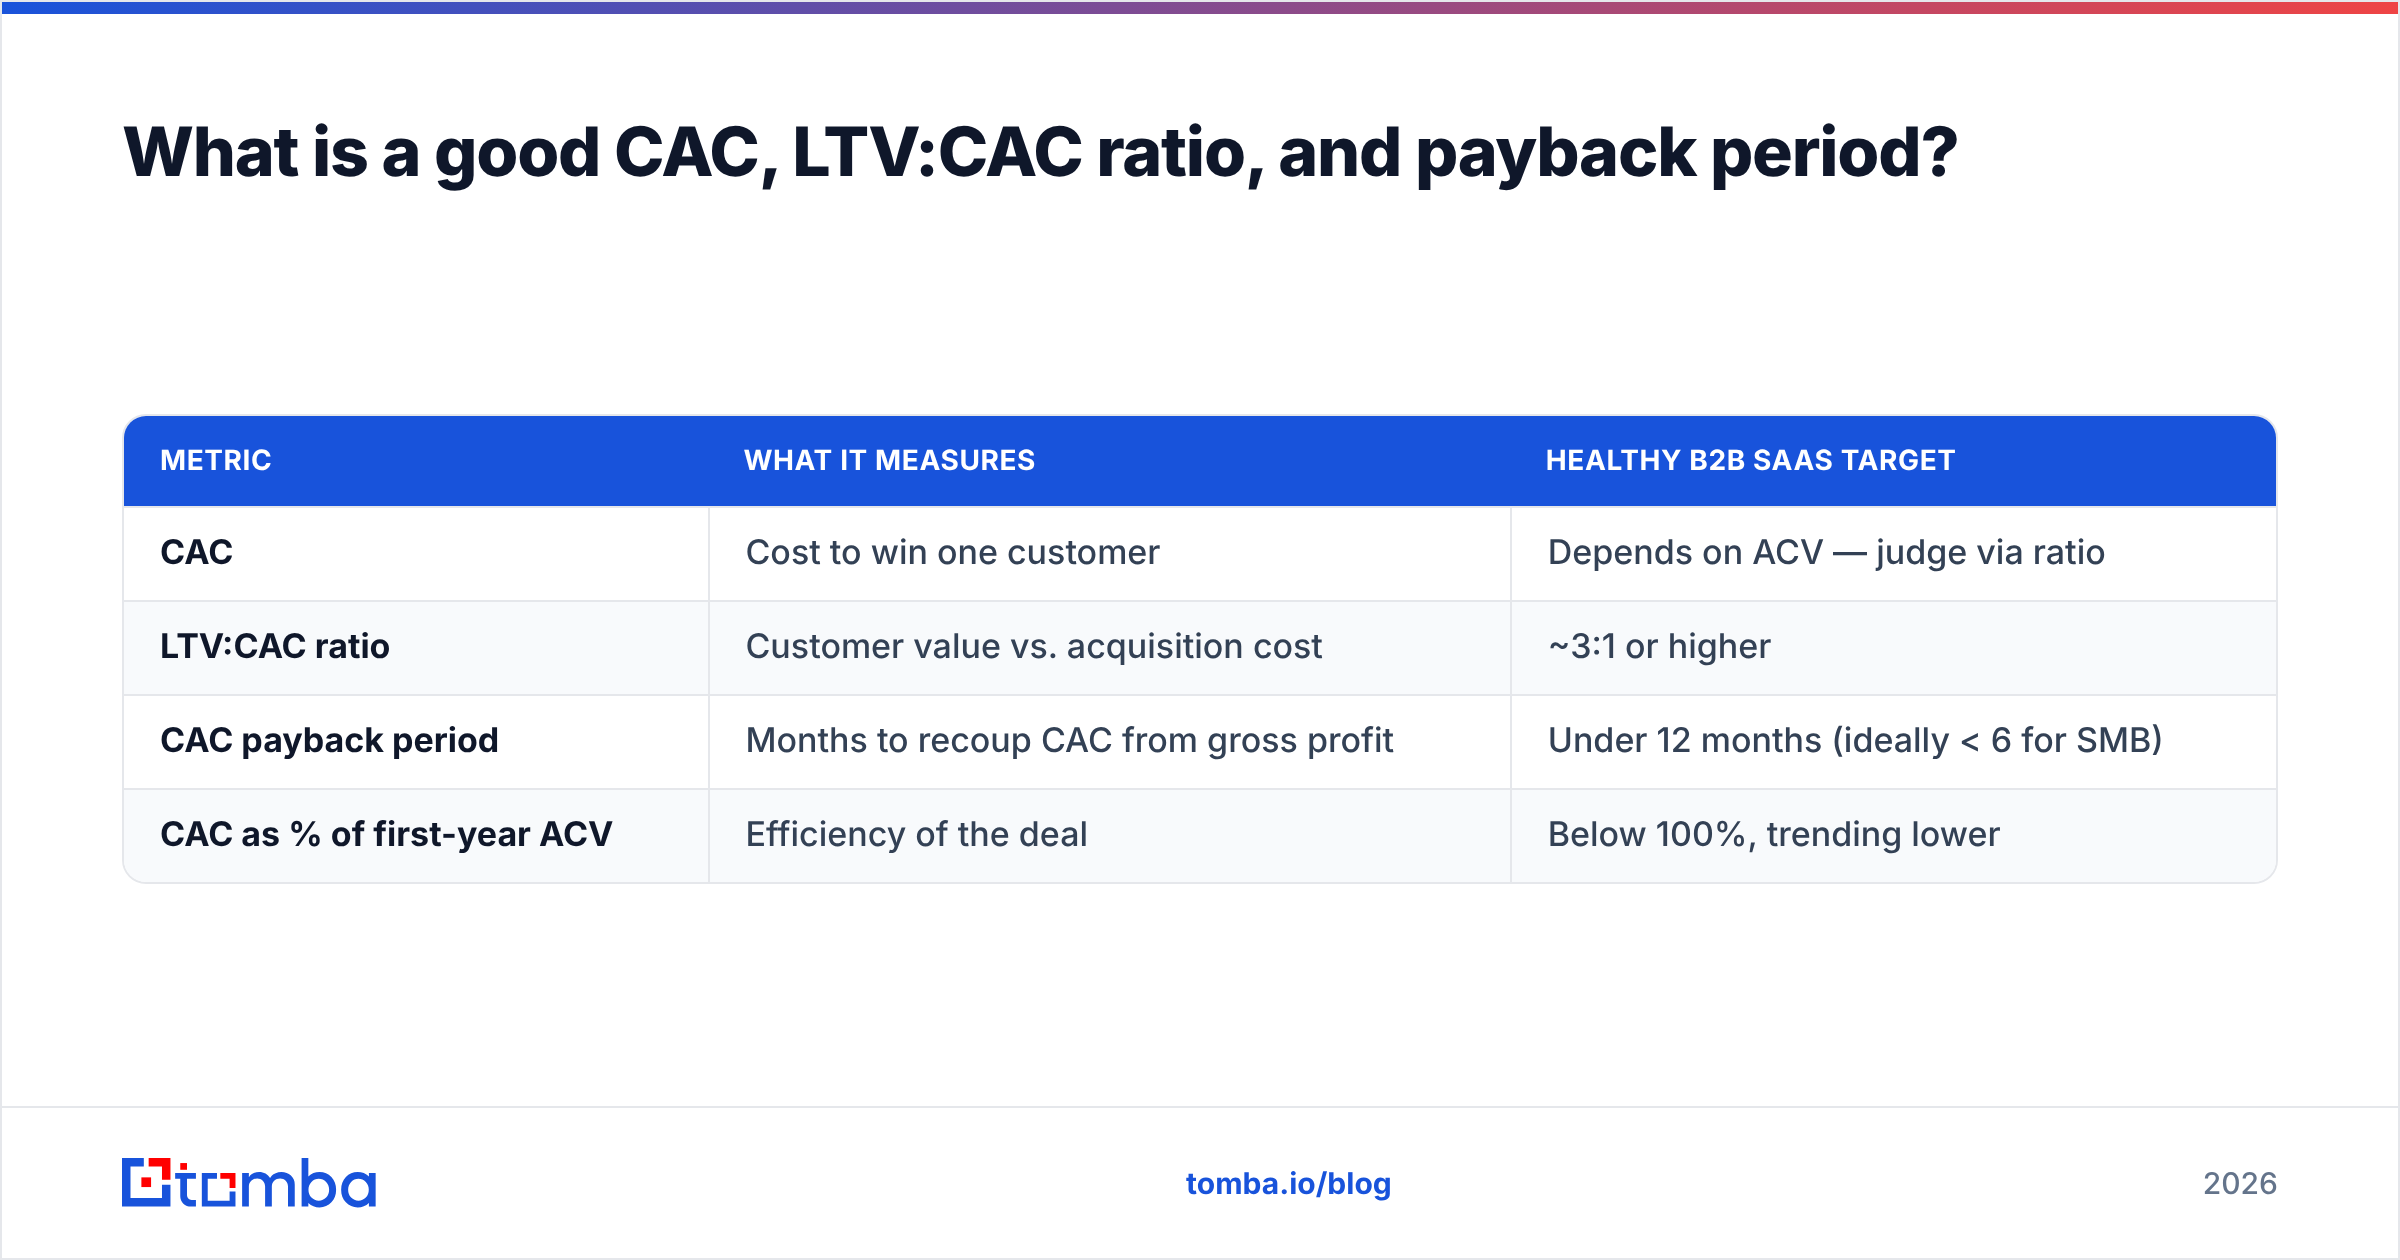
What is a good CAC, LTV:CAC ratio, and payback period?#
CAC alone means nothing without context. A $3,000 CAC is fantastic for a $50,000 ACV enterprise deal and catastrophic for a $300/year subscription. Three numbers put it in context.
| Metric | What it measures | Healthy B2B SaaS target |
|---|---|---|
| CAC | Cost to win one customer | Depends on ACV — judge via ratio |
| LTV:CAC ratio | Customer value vs. acquisition cost | ~3:1 or higher |
| CAC payback period | Months to recoup CAC from gross profit | Under 12 months (ideally < 6 for SMB) |
| CAC as % of first-year ACV | Efficiency of the deal | Below 100%, trending lower |
A widely cited benchmark, echoed by growth advisors and firms like HubSpot, is the 3:1 LTV:CAC ratio: for every dollar spent acquiring a customer, you want roughly three dollars of lifetime value back. Below 1:1 you're losing money on every deal. Above 5:1 you might be underinvesting in growth and leaving market share on the table.
For payback, the rule of thumb from SaaS investors and analysts like those at Gartner is to recover CAC within a year. Our example company at $3,000 CAC with ~$120/month gross profit per customer recovers in 25 months — too slow. That single insight reframes the whole quarter.
What hidden costs quietly inflate your CAC?#
The gap between fake CAC and real CAC almost always lives in costs nobody assigned to acquisition. These are the usual suspects:
- Bad data waste. Reps average a chunk of every week emailing addresses that bounce and dialing numbers that ring nowhere. That's paid time producing zero pipeline. It's a real acquisition cost even though no invoice says "wasted effort."
- Tool sprawl. Overlapping data vendors, an unused sales-engagement seat, a forgotten intent tool. All of it loads onto CAC.
- Long sales cycles with junk leads. An AE spending three weeks on a lead that was never qualified is CAC you'll never recover.
- Manual list building. Hours spent copy-pasting contacts from LinkedIn into spreadsheets is labor cost hiding as "prospecting."
The pattern is obvious once you see it: most CAC bloat is data and time waste, not media spend. You don't fix a $4,300 outbound CAC by cutting ad budget — there is none. You fix it by making sure every hour a rep spends is aimed at a real, reachable, qualified contact.

How do you actually lower your customer acquisition cost?#
Cutting CAC is not about spending less everywhere. It's about removing waste and raising conversion at each stage. Here's the priority order that works for most B2B teams.
- Fix your data first. Verify contacts before your reps touch them. A verified email finder means fewer bounces, better deliverability, and more replies per hour worked. Bounces don't just waste time — they damage sender reputation, which drags down every future campaign's efficiency.
- Reallocate to your lowest-CAC channels. Use the per-channel table above. Move budget from $8,000 referrals to $1,400 inbound until the marginal cost climbs.
- Tighten targeting. Fewer, better-fit accounts beat spray-and-pray volume. Enrich leads so reps only chase MQLs that match your ICP.
- Shorten the sales cycle. Faster qualification and better contact data (direct dials via a phone finder, verified emails) compress time-to-close, which lowers the loaded labor cost per deal.
- Automate list building. Replace manual copy-paste prospecting with bulk lead generation so your team spends time selling, not scraping.
Notice that four of the five levers are data and efficiency plays, not ad-budget cuts. That's the real lesson of any honest customer acquisition cost example: your biggest savings are hiding in wasted effort, and clean data is the cheapest way to reclaim it.
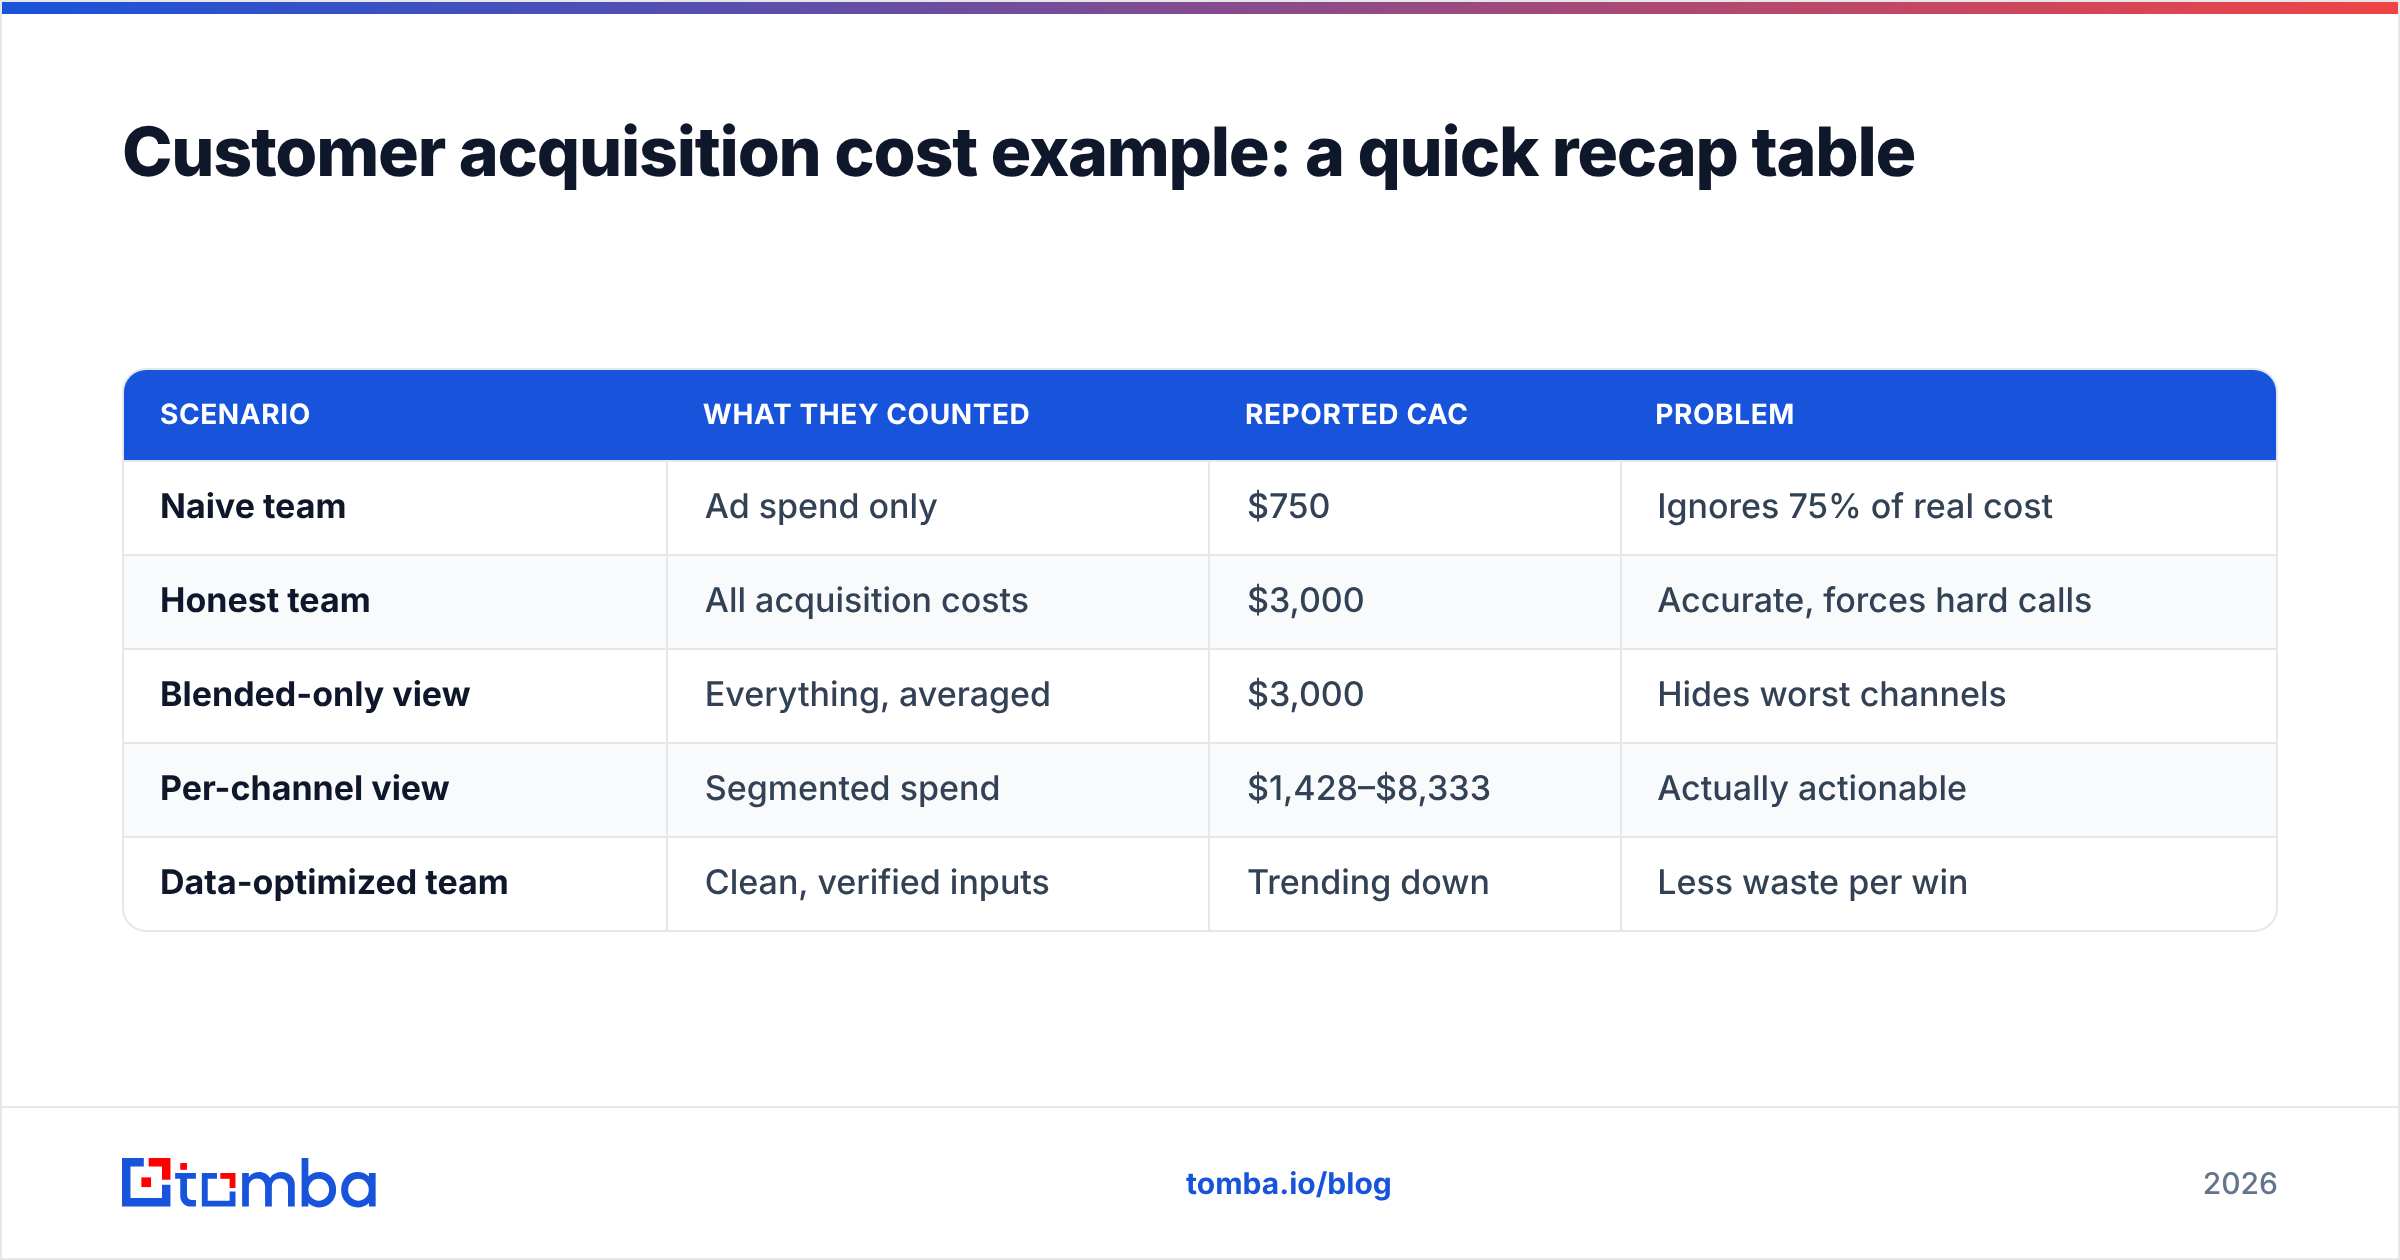
Customer acquisition cost example: a quick recap table#
| Scenario | What they counted | Reported CAC | Problem |
|---|---|---|---|
| Naive team | Ad spend only | $750 | Ignores 75% of real cost |
| Honest team | All acquisition costs | $3,000 | Accurate, forces hard calls |
| Blended-only view | Everything, averaged | $3,000 | Hides worst channels |
| Per-channel view | Segmented spend | $1,428–$8,333 | Actually actionable |
| Data-optimized team | Clean, verified inputs | Trending down | Less waste per win |
If you take one thing from this: the number itself matters less than how honestly you build it and how finely you segment it. A precise, ugly CAC beats a flattering, fake one every time.
Where does data quality fit into CAC?#
Directly on the cost side and the customer side at once. Bad data raises spend (wasted hours, bounced sends, damaged deliverability) and lowers output (fewer connects, fewer meetings, fewer closed deals). It's the rare lever that hits both the numerator and denominator of the CAC formula.
You can compare vendor approaches on independent marketplaces like G2 before committing, but the principle holds regardless of tool: reps working from verified, enriched contact data close more per dollar than reps working from stale lists. That efficiency shows up as a lower CAC and a healthier payback period — the two numbers your CFO actually cares about.
The bottom line#
A customer acquisition cost example is only useful if it's honest. Count every dollar, segment by channel, and compare against LTV and payback — not against a comforting blended average. Then attack the waste, and in most B2B teams that waste is bad data and wasted rep hours far more than overspending on ads.
If you want to cut the single biggest source of hidden CAC, start where the waste is: your contact data. Tomba's Email Finder helps your team reach real, verified prospects by domain, name, or company — so every hour and every send is aimed at someone who can actually become a customer. Fewer bounces, more replies, and a CAC that trends the right way. Check the Tomba pricing plans (a free tier gives you 25 searches to test it) and give your reps clean data before your next quarter starts.
Related guides#
Ready to find emails that actually work?
Join 150,000+ professionals who stopped guessing and started sending. Free credits on signup — no credit card required.
Get the Tomba newsletter
Practical outbound tactics and product updates — once every two weeks.
About the author