Customer Acquisition Metrics: The 2026 Guide That Matters
Most teams track a dozen customer acquisition metrics and act on none of them. Here are the numbers that actually predict profitable growth in 2026 — with formulas, benchmarks, and the traps that quietly kill your budget.
Customer Acquisition Metrics: The 2026 Guide That Matters
You can drown in dashboards and still not know whether your growth is profitable. Most teams report a dozen customer acquisition metrics every Monday, then make decisions on gut feel because none of the numbers connect to cash. This guide fixes that. It walks through the metrics that actually predict whether you can scale, how to calculate each one without fooling yourself, and the places where good-looking numbers quietly hide bad economics.
TL;DR#
- The four that matter most: Customer Acquisition Cost (CAC), Lifetime Value (LTV), the LTV:CAC ratio, and CAC payback period. Everything else is supporting cast.
- A healthy B2B SaaS target is an LTV:CAC ratio near 3:1 and a payback period under 12 months. Higher isn't always better — a 6:1 ratio often means you're underspending on growth.
- Blended CAC lies. Separate paid from organic, and new-logo from expansion, or you'll scale the wrong channel.
- Data quality is an acquisition metric. Bad contact data inflates CAC before a single ad runs; verified, accurate prospect data is the cheapest lever you have.
- Track cohorts, not averages. A single blended number hides the channels that are bleeding you dry.
What are customer acquisition metrics?#
Customer acquisition metrics are the numbers that tell you how much it costs to win a customer, how much that customer is worth, and how quickly you get your money back. Think of them as the unit economics of growth: if selling one more customer costs more than that customer will ever pay you, no amount of volume saves you — you just lose money faster.
They fall into three buckets:
- Cost metrics — what you spend to acquire (CAC, cost per lead, cost per opportunity).
- Value metrics — what you get back (LTV, average revenue per account, gross margin).
- Efficiency metrics — how the two relate over time (LTV:CAC ratio, payback period, magic number).
The mistake most teams make is obsessing over the first bucket in isolation. A $40 cost per lead means nothing until you know how many of those leads convert and what they're worth. The metrics only become useful when you connect the full chain from spend to revenue.

Which customer acquisition metrics actually matter in 2026?#
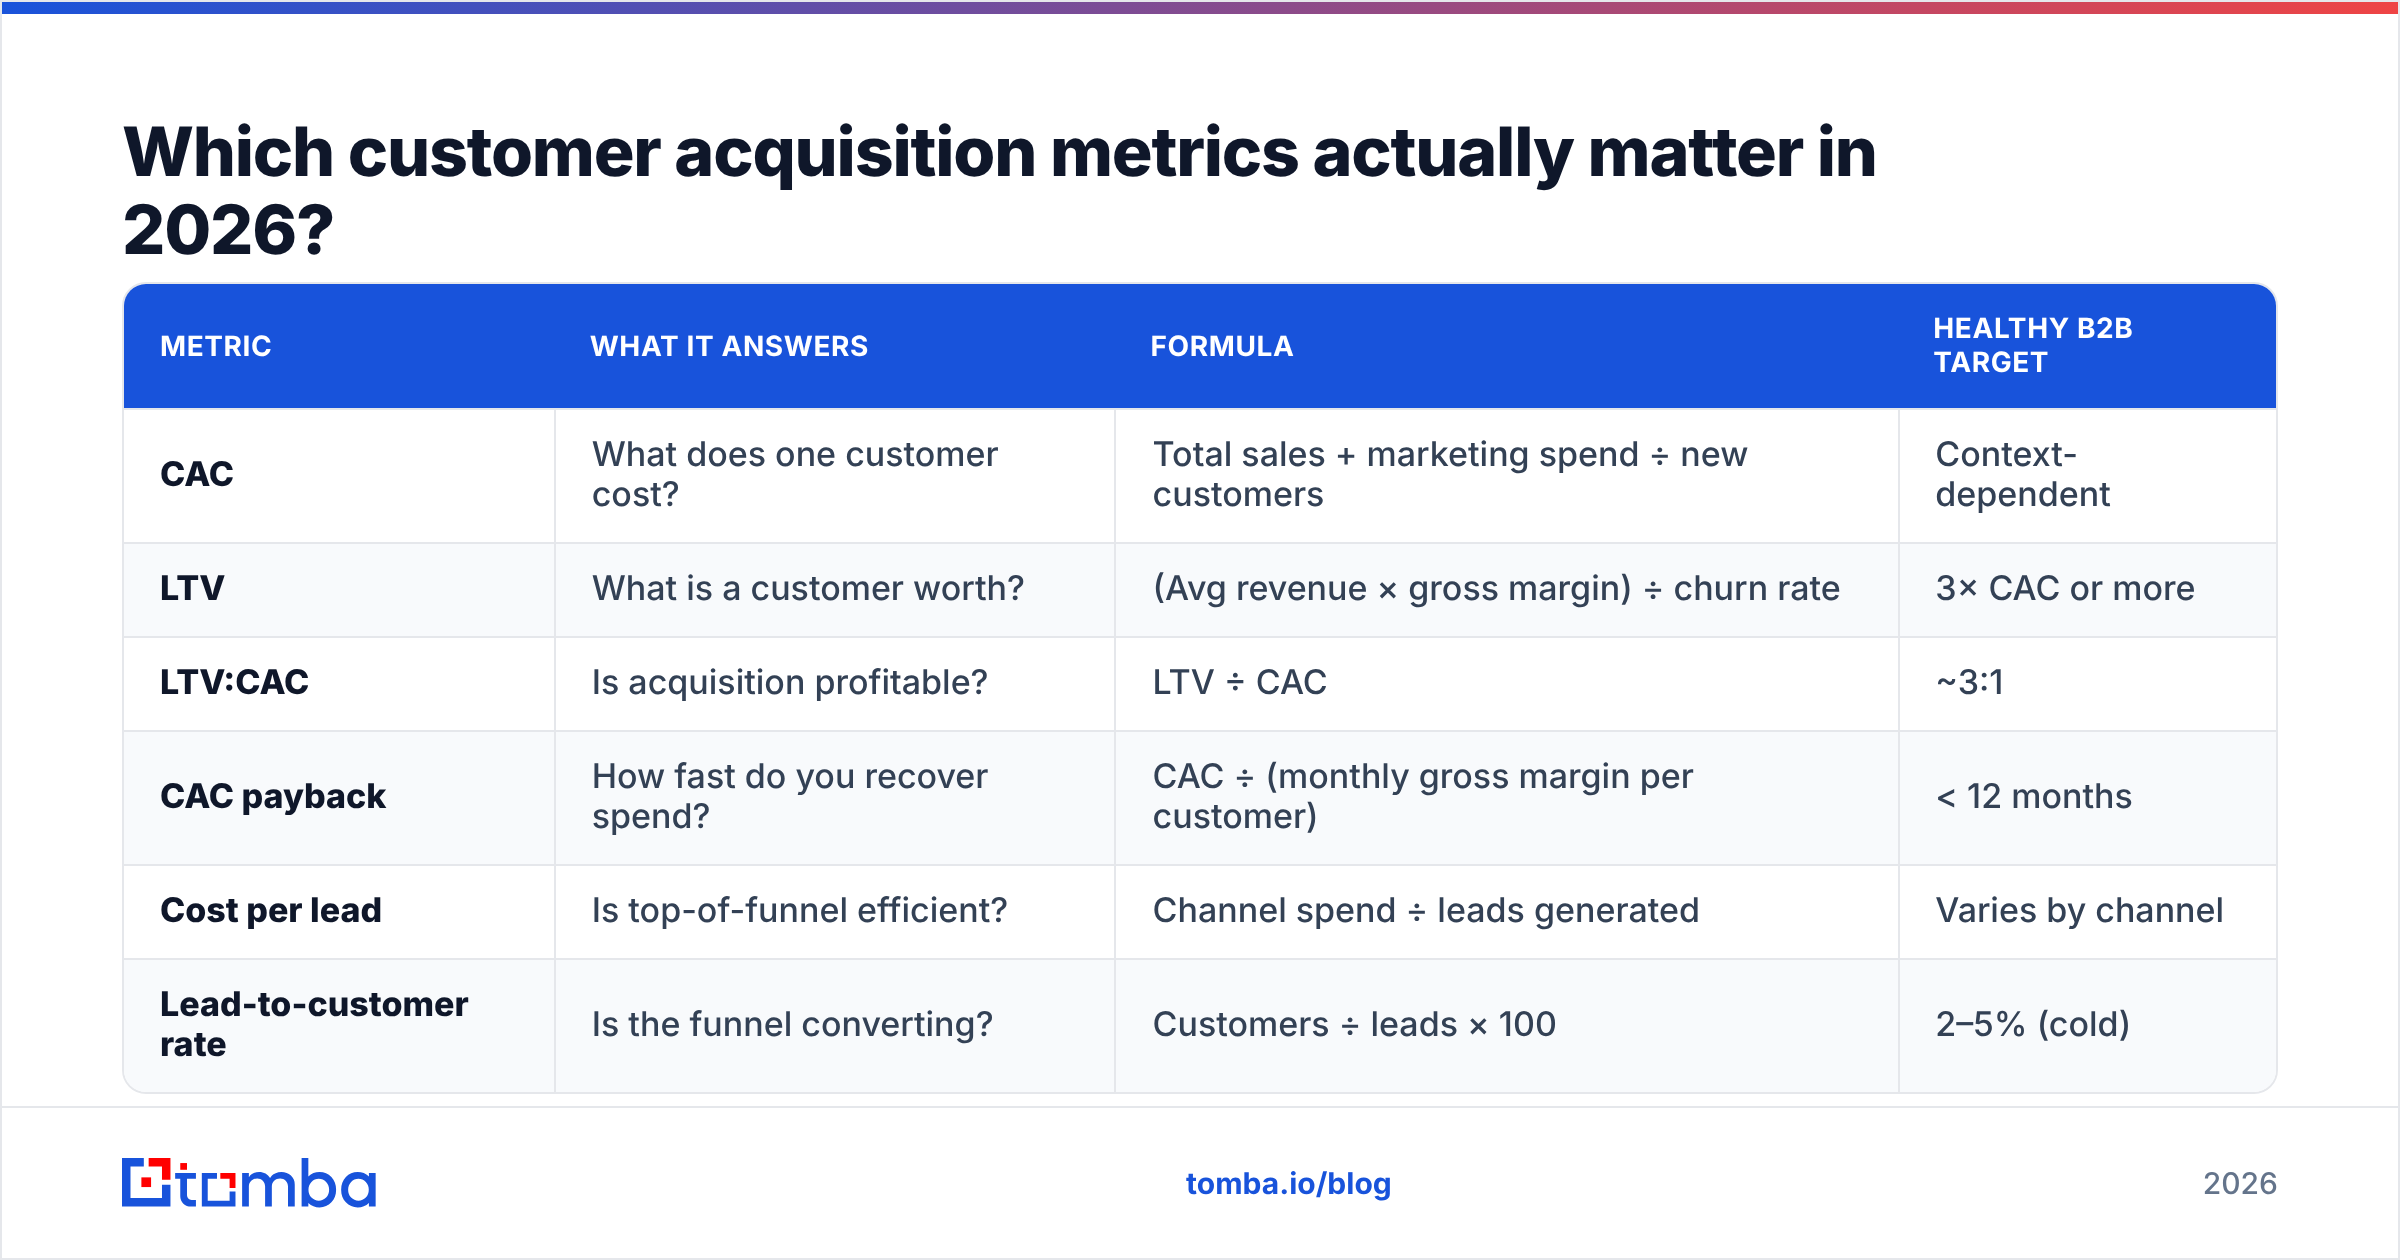
Here's the short list, what each one answers, and a realistic B2B target to benchmark against.
| Metric | What it answers | Formula | Healthy B2B target |
|---|---|---|---|
| CAC | What does one customer cost? | Total sales + marketing spend ÷ new customers | Context-dependent |
| LTV | What is a customer worth? | (Avg revenue × gross margin) ÷ churn rate | 3× CAC or more |
| LTV:CAC | Is acquisition profitable? | LTV ÷ CAC | ~3:1 |
| CAC payback | How fast do you recover spend? | CAC ÷ (monthly gross margin per customer) | < 12 months |
| Cost per lead | Is top-of-funnel efficient? | Channel spend ÷ leads generated | Varies by channel |
| Lead-to-customer rate | Is the funnel converting? | Customers ÷ leads × 100 | 2–5% (cold) |
If you only instrument four things this quarter, make them CAC, LTV, the ratio between them, and payback period. The rest are diagnostics you pull when one of those four moves the wrong way.
Customer Acquisition Cost (CAC)#
CAC is total sales and marketing spend divided by the number of new customers acquired in the same period. The trap is what you leave out. A "real" CAC includes ad spend, salaries, tooling, agency fees, and content costs — not just the media bill. Teams that report media-only CAC are flattering themselves by 40–60%.
Calculate it over a window long enough to match your sales cycle. If deals take 90 days to close, dividing this month's spend by this month's new customers compares spend against customers who were sold last quarter. Align the numerator and denominator or the number is fiction.
Lifetime Value (LTV)#
LTV estimates the total gross profit a customer generates before they churn. A simple version: average monthly revenue per account, multiplied by gross margin, divided by your monthly churn rate. The gross-margin step matters — revenue you spend on servicing the account isn't value you keep.
For a deeper primer on the operating discipline behind these numbers, revenue operations is where CAC, LTV, and pipeline data get stitched into one accountable view.
The LTV:CAC ratio#
Divide LTV by CAC. The widely cited benchmark is 3:1 — for every dollar spent acquiring a customer, you get three back in gross profit. Below 3:1 and your economics are thin; below 1:1 and you're paying customers to leave. But higher isn't automatically better. A 6:1 ratio usually means you're leaving growth on the table by underinvesting in acquisition. If your economics are that good, spend more.

How do you calculate CAC payback period?#
CAC payback period is CAC divided by the monthly gross-margin revenue a customer generates. If it costs $6,000 to acquire a customer who delivers $600 in gross margin per month, your payback is 10 months. It answers the question your CFO actually cares about: how long until this customer stops being a loss?
Payback matters more than the LTV:CAC ratio for cash-constrained teams. You can have a beautiful 4:1 ratio and still go broke if it takes 30 months to recover each acquisition — because you're funding 30 months of spend before the money comes back. As a rule:
- Under 12 months — healthy, you can reinvest quickly.
- 12–18 months — workable with financing or strong retention.
- Over 18 months — dangerous unless you have deep pockets and low churn.
The lever most teams ignore is speed of qualification. Every day a rep spends chasing a lead that will never convert extends payback for the whole cohort. Faster, cleaner targeting compresses the timeline directly.
Why does data quality change your acquisition metrics?#
Because bad data inflates every cost metric before you run a single campaign. This is the least glamorous and most underrated driver of CAC.
Walk the chain. You buy or build a list of 10,000 contacts. If 25% of the emails are invalid — a conservative figure for aged B2B lists — you've paid for 2,500 dead records. Your emails bounce, your sender reputation drops, and your deliverability craters, which means even the valid contacts stop seeing your messages. Now your cost per lead doubles, your cost per opportunity triples, and CAC balloons — all from data you never verified.

Cleaning the front of the funnel is the cheapest CAC reduction available. Verifying contacts with an email verifier before you send protects deliverability. Sourcing accurate contacts in the first place with an email finder means fewer wasted touches per closed deal. Neither shows up on a media report, but both move CAC more reliably than ad optimization.
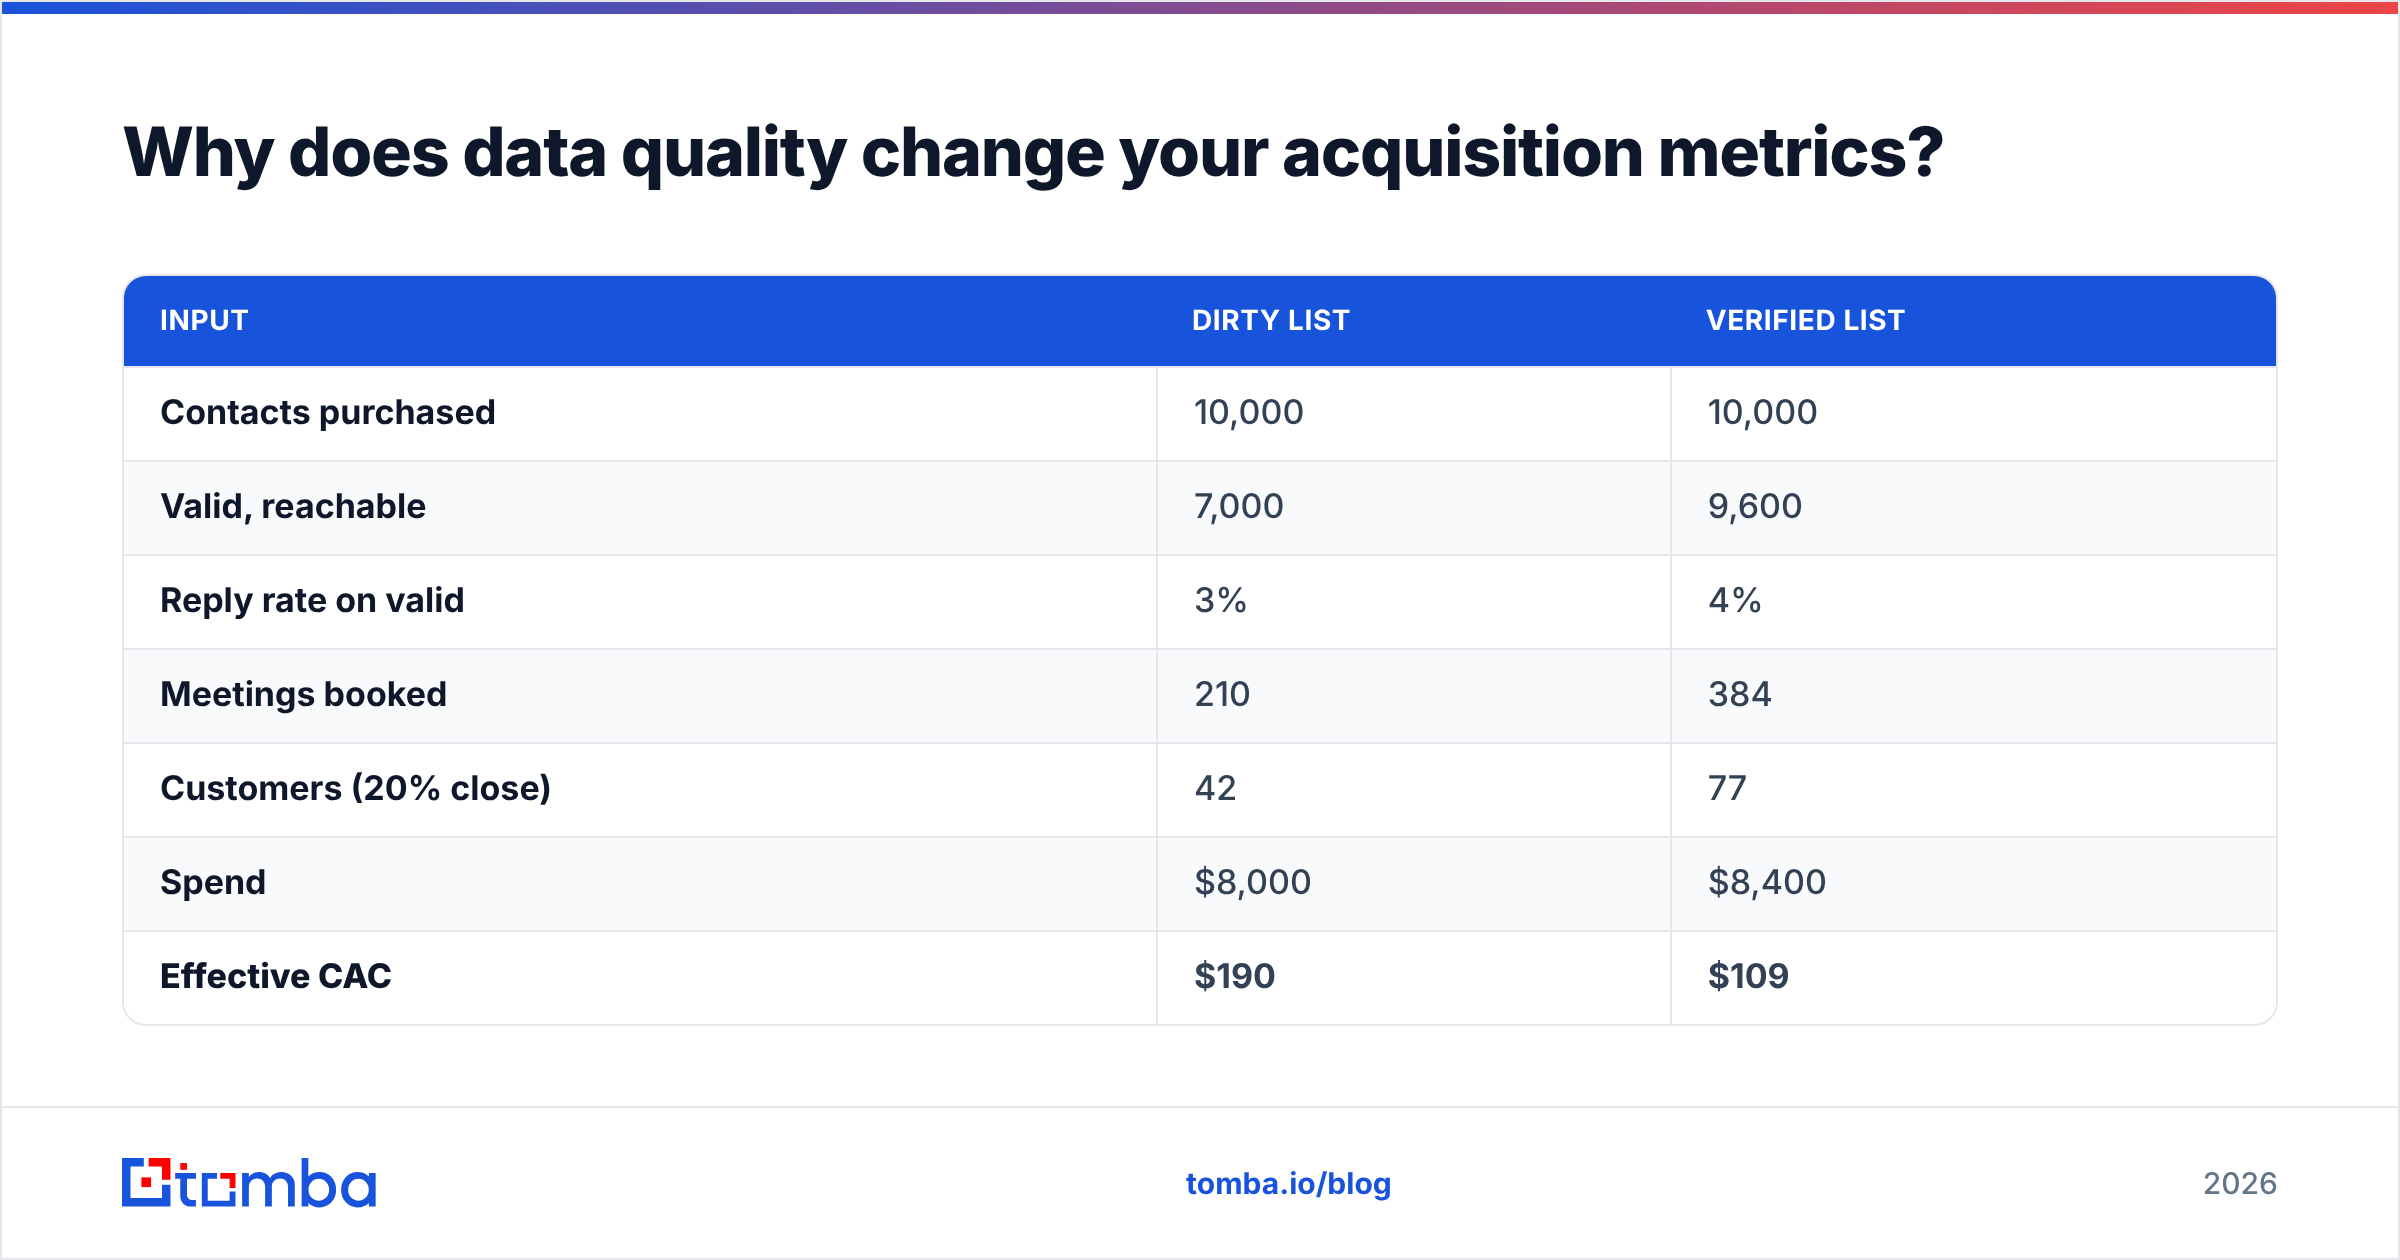
Consider the difference in a simple model:
| Input | Dirty list | Verified list |
|---|---|---|
| Contacts purchased | 10,000 | 10,000 |
| Valid, reachable | 7,000 | 9,600 |
| Reply rate on valid | 3% | 4% |
| Meetings booked | 210 | 384 |
| Customers (20% close) | 42 | 77 |
| Spend | $8,000 | $8,400 |
| Effective CAC | $190 | $109 |
Same channel, same effort, nearly half the CAC — purely from data hygiene and better deliverability. According to HubSpot's research on data decay, B2B contact data degrades by roughly 22–30% per year, so this isn't a one-time cleanup; it's ongoing maintenance.
What's the difference between blended CAC and paid CAC?#
Blended CAC divides all acquisition spend by all new customers, including the ones who found you organically. Paid CAC isolates the customers who came from paid channels and divides by paid spend alone. The gap between them is where most budget mistakes live.
- Blended CAC flatters you. Organic and word-of-mouth customers are "free," so they drag your average down and make paid channels look more efficient than they are.
- Paid CAC tells the truth about scalability. When you pour more money into growth, you're buying paid customers — so paid CAC is the number that predicts what scaling actually costs.
Segment further wherever you can: new-logo CAC versus expansion CAC, and CAC by channel. Expansion revenue from existing customers is dramatically cheaper to win than net-new logos, so blending them hides how expensive real acquisition is. A dashboard that shows one blended number is a dashboard designed to make you feel good, not to help you decide.
For teams building out this segmentation, Salesforce's guidance on sales metrics is a solid reference on which cuts of the data drive decisions versus which just fill reports.
Which metrics mislead you — and how to avoid the traps?#
Some of the most-reported acquisition metrics are actively dangerous when read alone.
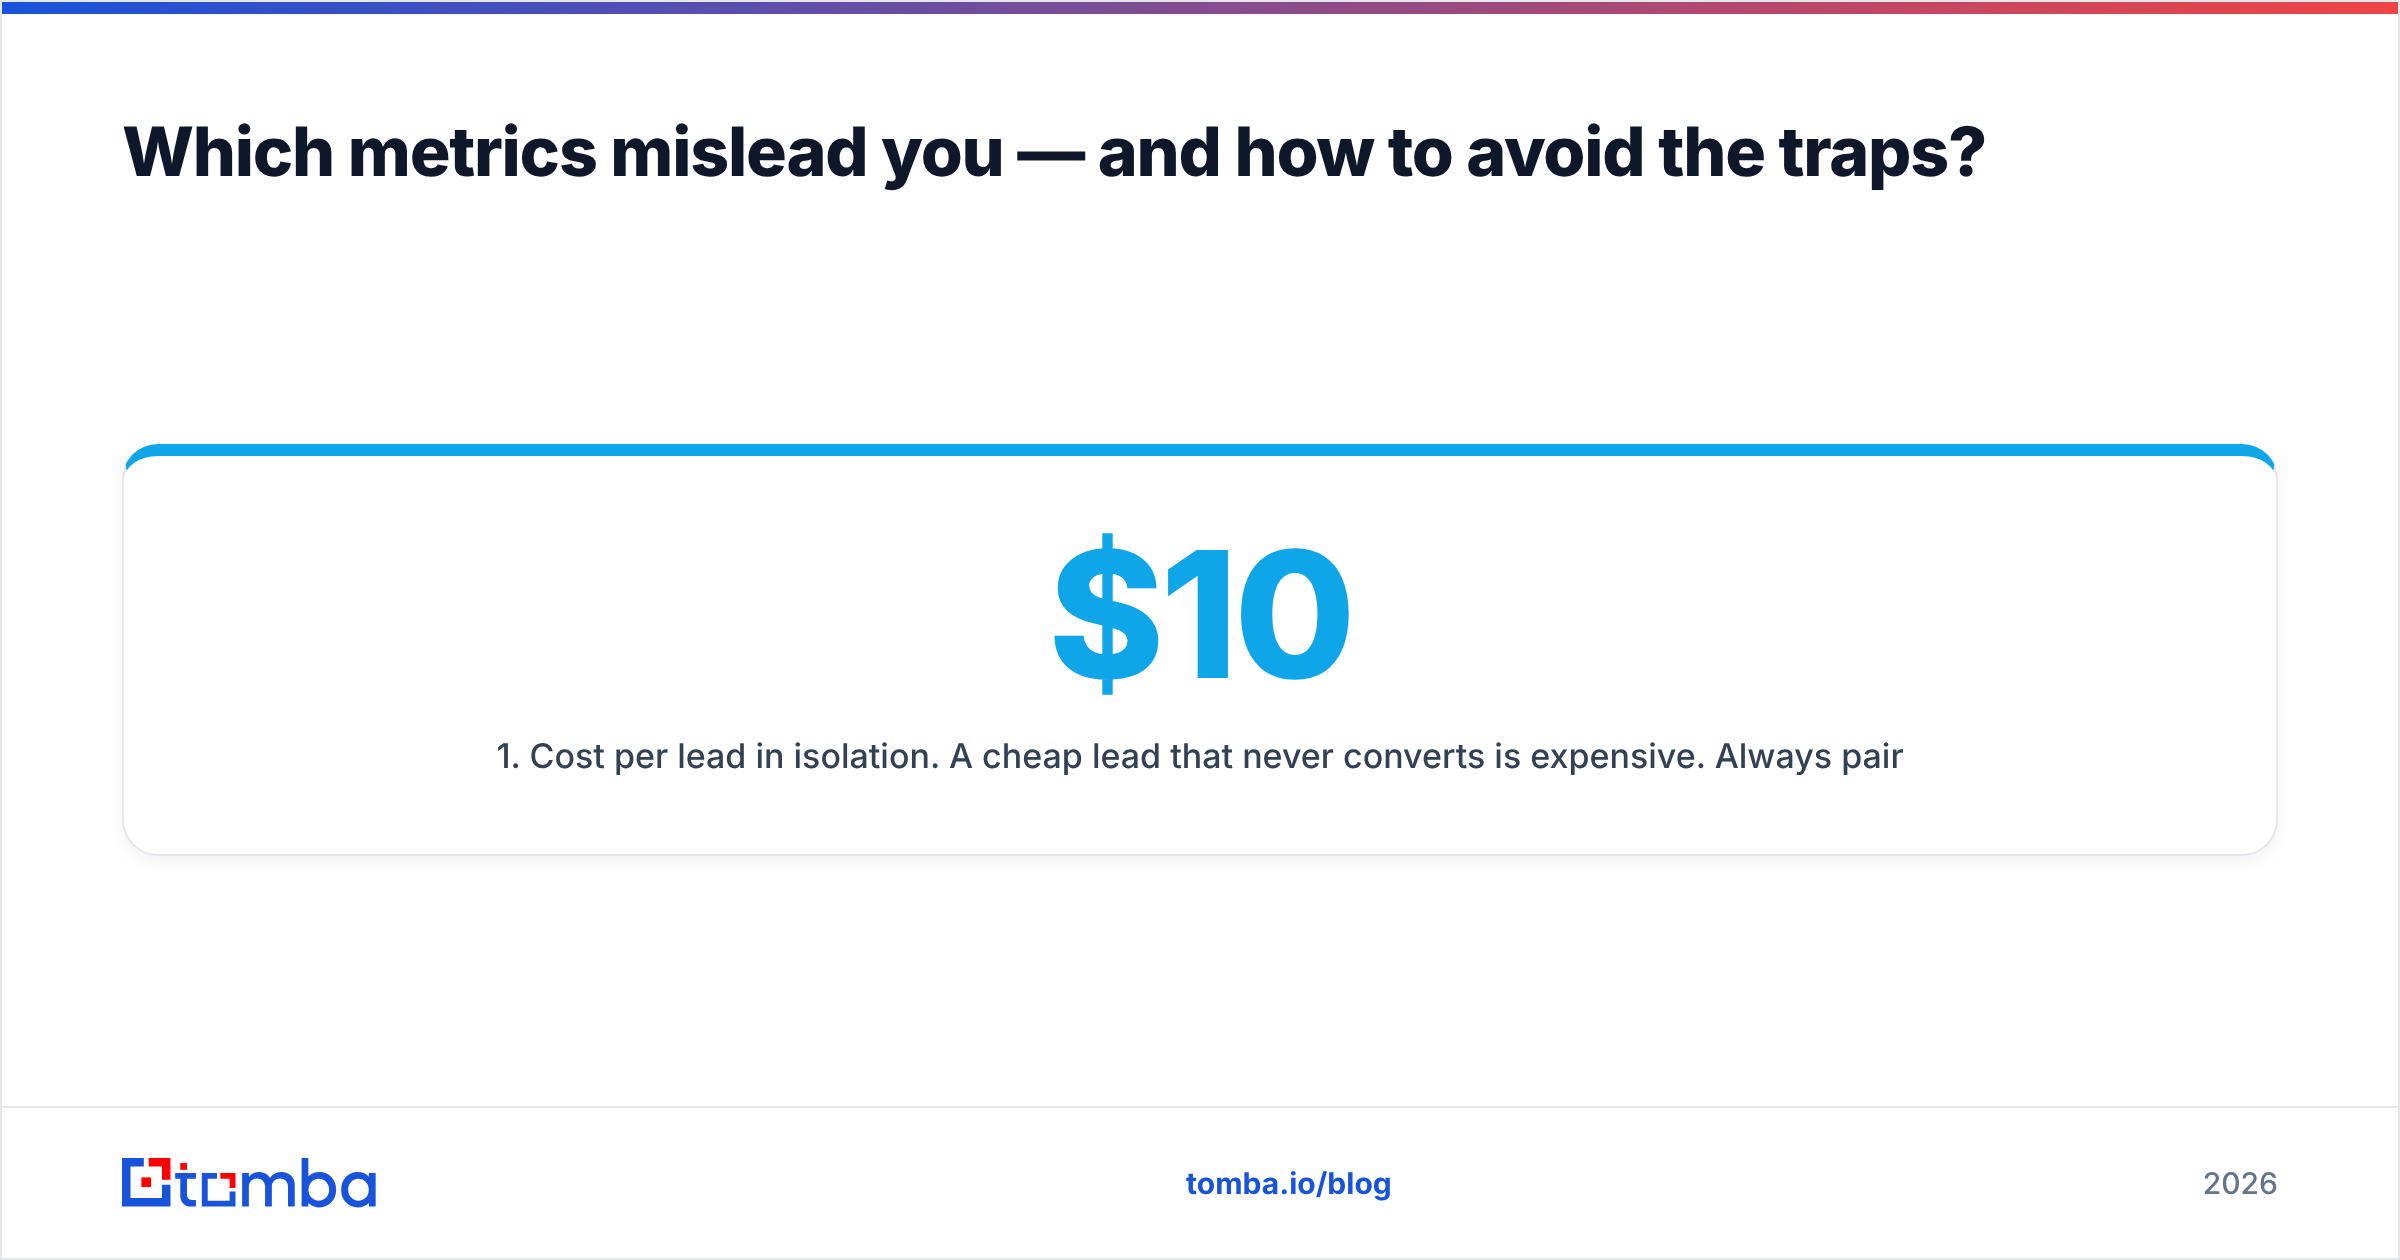
- Cost per lead in isolation. A cheap lead that never converts is expensive. Always pair CPL with lead-to-customer rate. A $10 lead at 0.5% conversion is worse than a $60 lead at 5%.
- Blended CAC as your headline number. As above — it hides your true cost to scale. Report paid CAC as the primary and blended as context.
- LTV built on optimistic churn. LTV is exquisitely sensitive to the churn assumption. Halving your assumed churn doubles your LTV on paper. Use trailing actuals, not hopes.
- Vanity funnel volume. Impressions, clicks, and raw MQL counts feel like progress but don't tie to revenue. Track a marketing qualified lead only if you also track how many become customers.
- Averages that hide cohorts. A blended 3:1 ratio can contain one channel at 6:1 and another at 0.8:1. The average tells you to keep going; the cohorts tell you to kill a channel and double another.
The fix for all five is the same discipline: connect every top-of-funnel metric to a downstream revenue outcome, and segment before you average. When you enrich lead records with firmographic and contact detail — using data enrichment — you can slice CAC by company size, industry, and role, which is where the real optimization lives.
How do you build a customer acquisition metrics dashboard?#
Start narrow and make every metric earn its place. A useful dashboard has four tiers:
- Headline (check daily): Paid CAC, CAC payback period. These two tell you if you can keep spending.
- Health (check weekly): LTV:CAC ratio by channel, lead-to-customer rate, cost per opportunity. These flag which channels to feed or starve.
- Diagnostic (check when something moves): Cost per lead by source, email deliverability rate, data validity rate, sales-cycle length. These explain why the headline numbers changed.
- Strategic (check monthly): Cohort retention curves, expansion CAC versus new-logo CAC, magic number. These inform budget and hiring.
Feed the dashboard from clean inputs. If your CRM is full of duplicate and unreachable contacts, every metric downstream inherits the noise. Pipe verified, deduplicated, enriched data in — whether through the Tomba API or a direct HubSpot integration — so your CAC reflects reality instead of list rot. A dashboard is only as honest as the data underneath it.
Frequently asked questions#
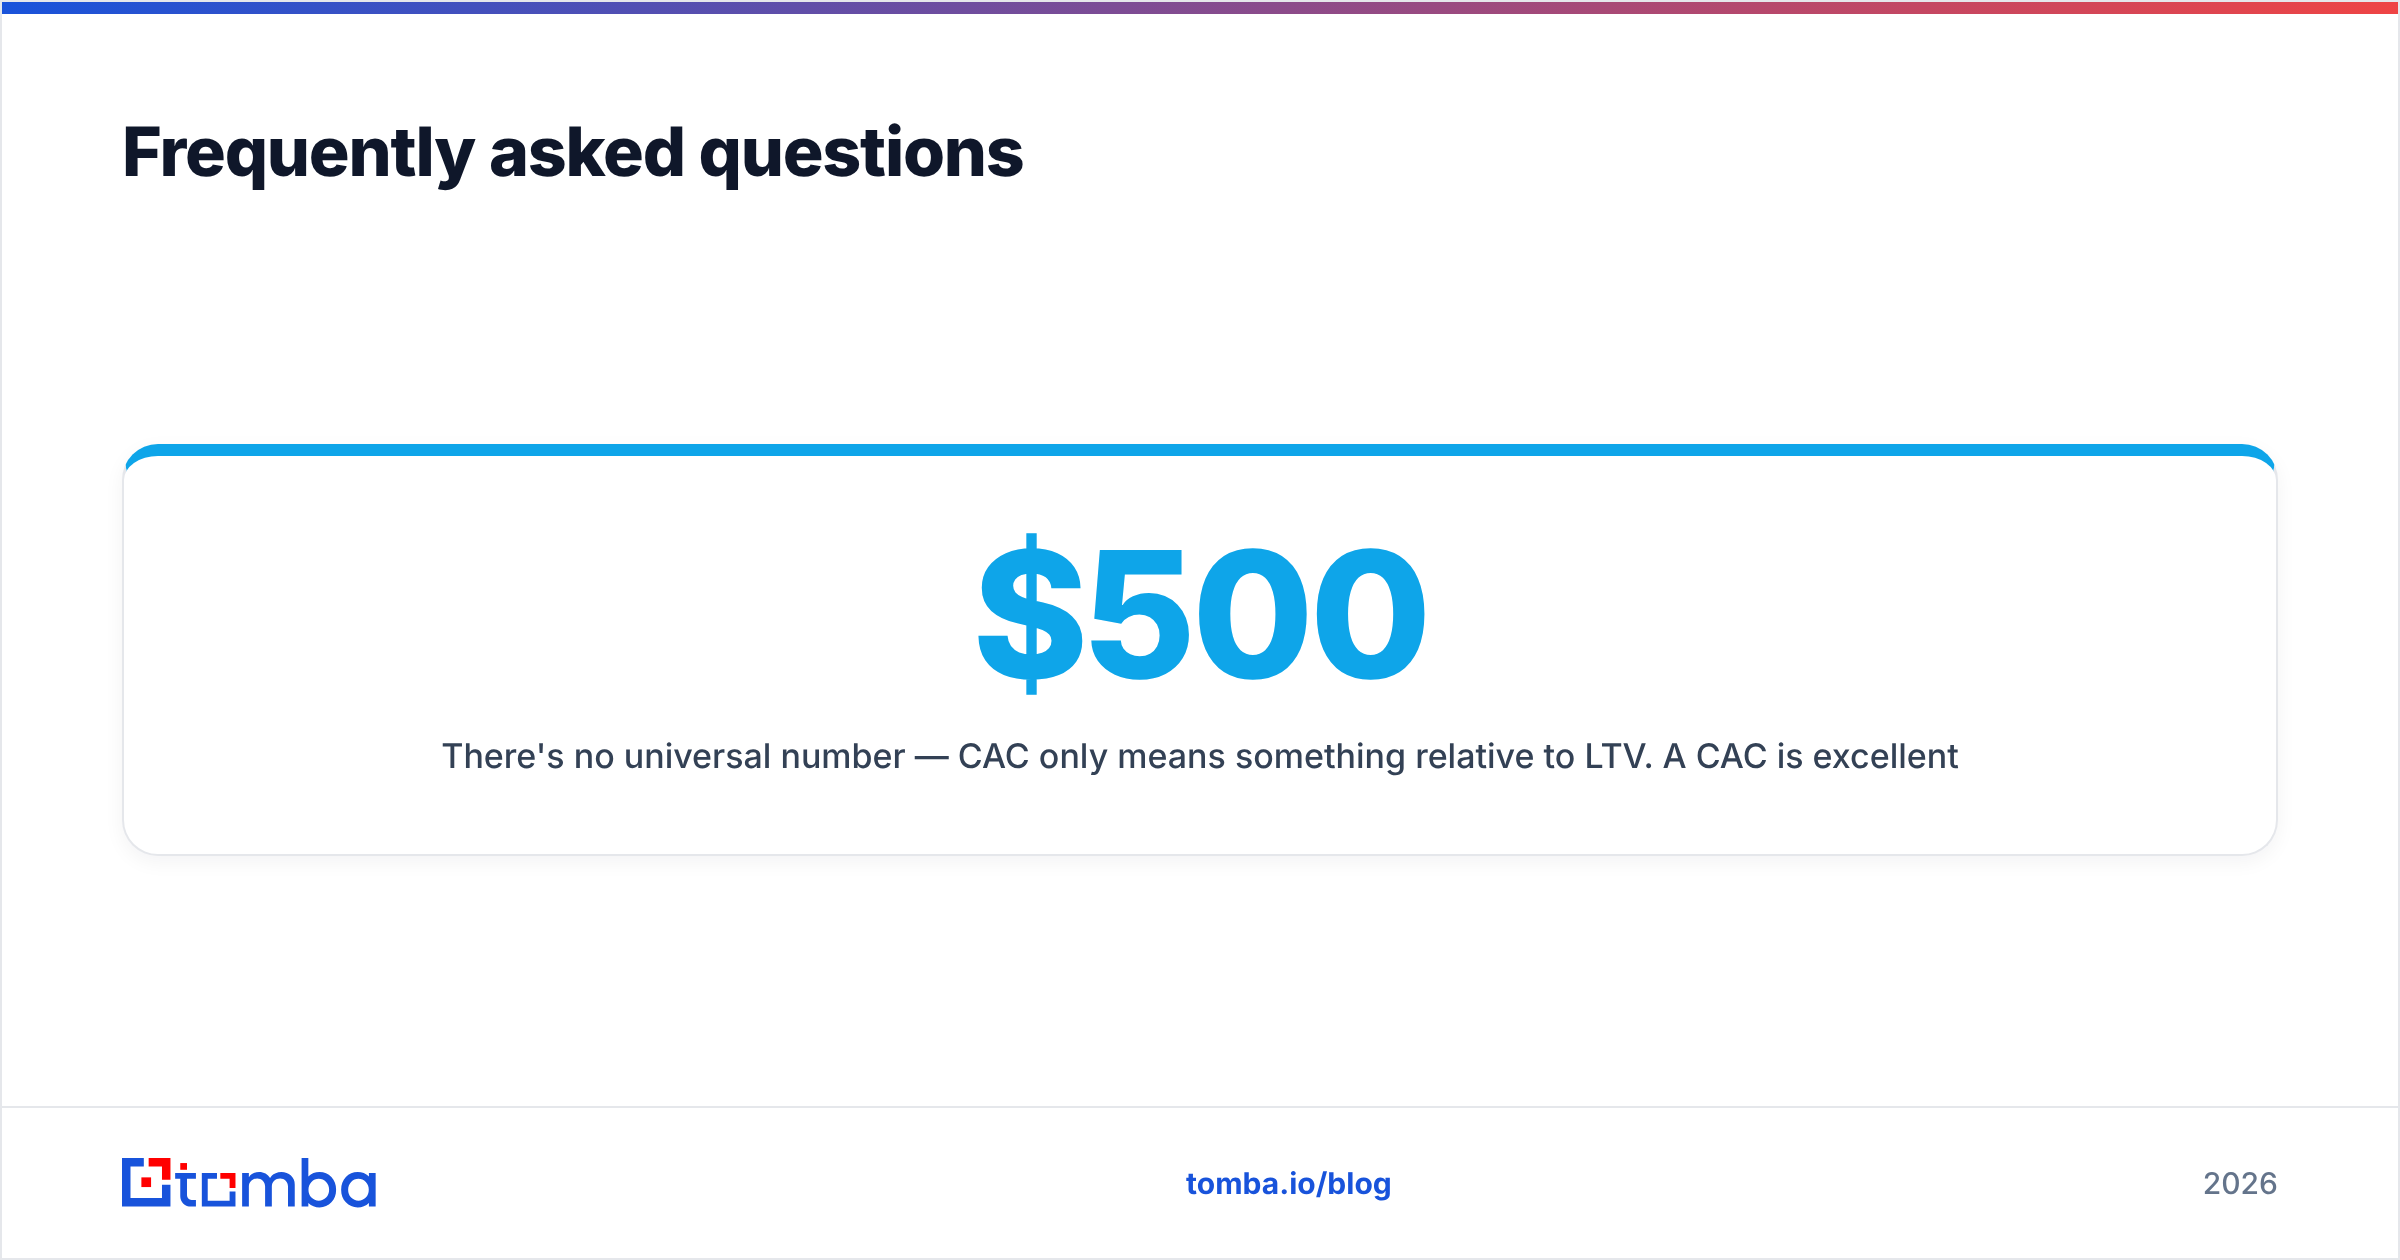
What is a good CAC? There's no universal number — CAC only means something relative to LTV. A $500 CAC is excellent for a $10,000-LTV product and catastrophic for a $600-LTV one. Judge CAC by your LTV:CAC ratio (aim near 3:1) and payback period (aim under 12 months), never by the dollar figure alone.
How is CAC different from cost per acquisition (CPA)? CPA usually measures the cost of a specific conversion event — a signup, a trial, a download — while CAC measures the cost of a paying customer. CPA is a channel metric; CAC is a business metric. Don't let a marketing platform's CPA stand in for true CAC.
How often should I recalculate these metrics? Recalculate CAC and payback monthly, and review LTV and cohort retention quarterly. Anything faster adds noise; anything slower lets a bleeding channel run too long. Segment by channel every time.
Can better data really lower CAC that much? Yes. Invalid contacts waste spend, wreck deliverability, and drag down conversion — all of which inflate CAC before optimization even starts. Verifying and enriching data is often the single highest-ROI CAC lever available, because it multiplies the return on every other dollar you spend.
Start with the cheapest CAC lever you have#
The fastest way to improve your customer acquisition metrics isn't a new channel or a bigger budget — it's feeding your funnel accurate, verified, enriched contact data so that every dollar you spend reaches a real, reachable buyer. That's the lever most teams skip because it doesn't show up on an ad report, even though it moves CAC more reliably than any bid adjustment.
Tomba's Email Finder helps you source accurate professional emails by name, company, or domain, and its verification layer keeps your list clean so your deliverability — and your CAC — stay healthy. Start on the free tier (25 searches per month), and if the economics work, Tomba pricing scales from Starter at $49/mo up through Growth and Pro. Fix the data first, and every acquisition metric downstream gets easier to move.
Related guides#
Ready to find emails that actually work?
Join 150,000+ professionals who stopped guessing and started sending. Free credits on signup — no credit card required.
Get the Tomba newsletter
Practical outbound tactics and product updates — once every two weeks.
About the author