Customer Relationship Management KPIs: The 2026 Metrics That Matter
Most teams drown in CRM dashboards yet still can't answer one question: is revenue coming? Here are the customer relationship management KPIs that actually predict it in 2026 — with formulas, benchmarks, and the traps to avoid.
Your CRM has 40 fields, 12 dashboards, and a leaderboard that updates in real time. Yet when your CEO asks "are we going to hit the number?" the honest answer is a shrug. That gap — between data volume and decision confidence — is what a good customer relationship management KPI is supposed to close.
This guide covers the KPIs that actually move the forecast, how to calculate each, realistic 2026 benchmarks, and the measurement mistakes that quietly wreck pipelines.
TL;DR#
- A CRM KPI is a decision trigger, not a wall decoration. If a metric doesn't change what you do next week, stop tracking it as a KPI.
- Track across the full lifecycle: acquisition (CAC, conversion rate), value (win rate, sales cycle, average deal size), and retention (churn, NRR, LTV:CAC).
- The most-abused number is data quality. Dirty records inflate every other KPI — bad emails, duplicate contacts, and stale titles all lie to your dashboard.
- Benchmarks are directional, not gospel. A 20% win rate is healthy for enterprise and alarming for transactional SMB. Segment before you judge.
- Five to seven KPIs beat forty. Pick the ones tied to revenue, review them on a fixed cadence, and kill vanity metrics.
What is a CRM KPI, exactly?#
A CRM KPI is a quantified measure of how well your customer relationships convert into and sustain revenue. Think of it like a car's dashboard: you don't need 200 gauges, you need speed, fuel, and engine temperature — the few readings that tell you whether to accelerate, refuel, or pull over.
Technically, a CRM key performance indicator ties a specific business outcome (revenue, retention, efficiency) to a measurable input you can influence. The distinction that matters: a metric is anything you can count (emails sent, calls logged); a KPI is a metric you've committed to acting on. Every KPI is a metric, but most metrics should never be promoted to KPI status.
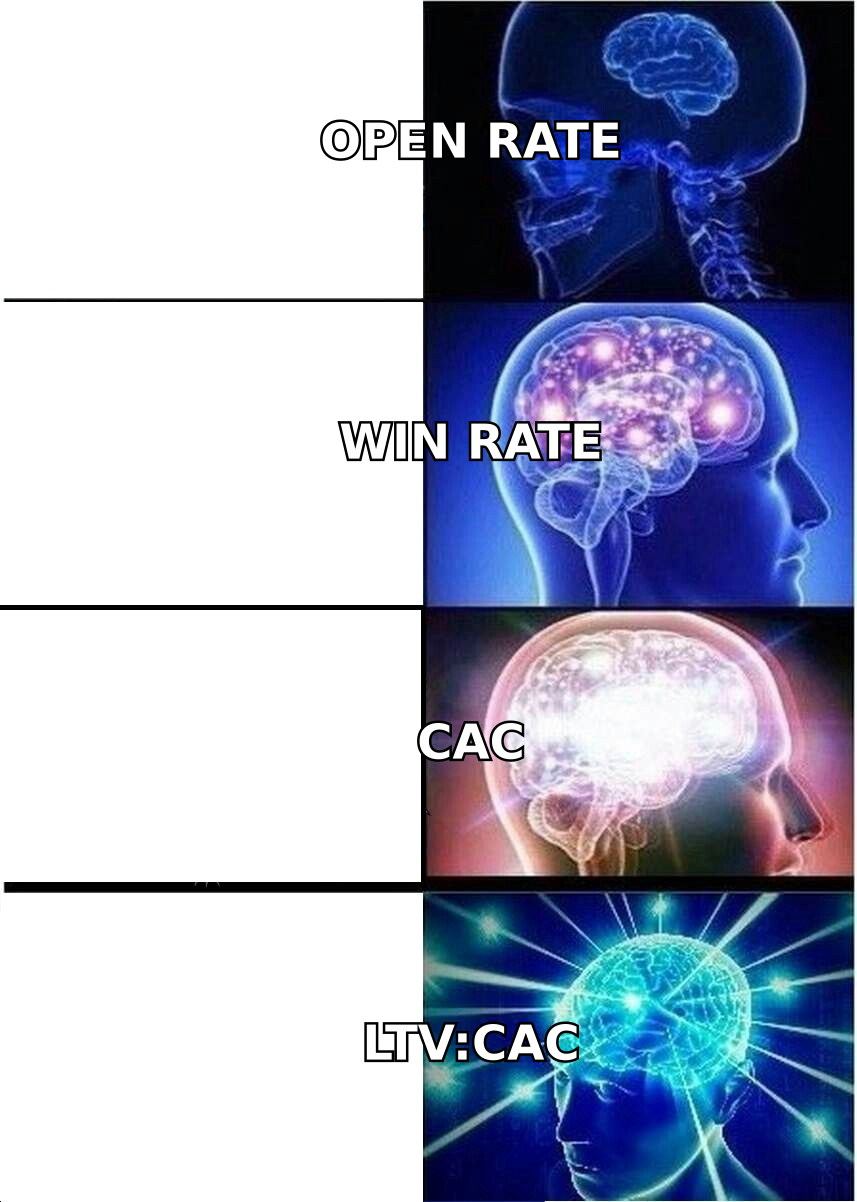
The escalation above is the whole game. Open rate feels productive. Win rate tells you if you'll survive the quarter. LTV:CAC tells you if the business itself works. Sophistication means climbing toward metrics that predict money, not activity.
Which customer relationship management KPIs actually matter?#
Group your KPIs by lifecycle stage so no single team optimizes its own number at the expense of the funnel. Here are the core categories, each with a formula and what it really tells you.
- Lead conversion rate —
(leads converted to opportunity ÷ total leads) × 100. Measures whether your top-of-funnel quality matches your sales motion. A falling rate usually means marketing and sales disagree on what "qualified" means. - Win rate —
(deals won ÷ total closed deals) × 100. The single clearest read on sales effectiveness and pipeline realism. Track it by segment, rep, and lead source, not just as one blended number. - Sales cycle length — average days from opportunity created to closed-won. Shortening it is often cheaper than adding headcount; it compounds directly into capacity.
- Average deal size (ACV) — total revenue ÷ number of deals. Rising ACV can hide a falling win rate, so never read it alone.
- Customer Acquisition Cost (CAC) —
total sales + marketing spend ÷ new customers acquired. The denominator of every efficiency conversation in revenue operations. - Net Revenue Retention (NRR) —
(starting revenue + expansion − churn − contraction) ÷ starting revenue × 100. Above 100% means you'd grow even with zero new logos. It's the metric investors ask about first.
CRM KPI comparison: what each measures and when it lies#
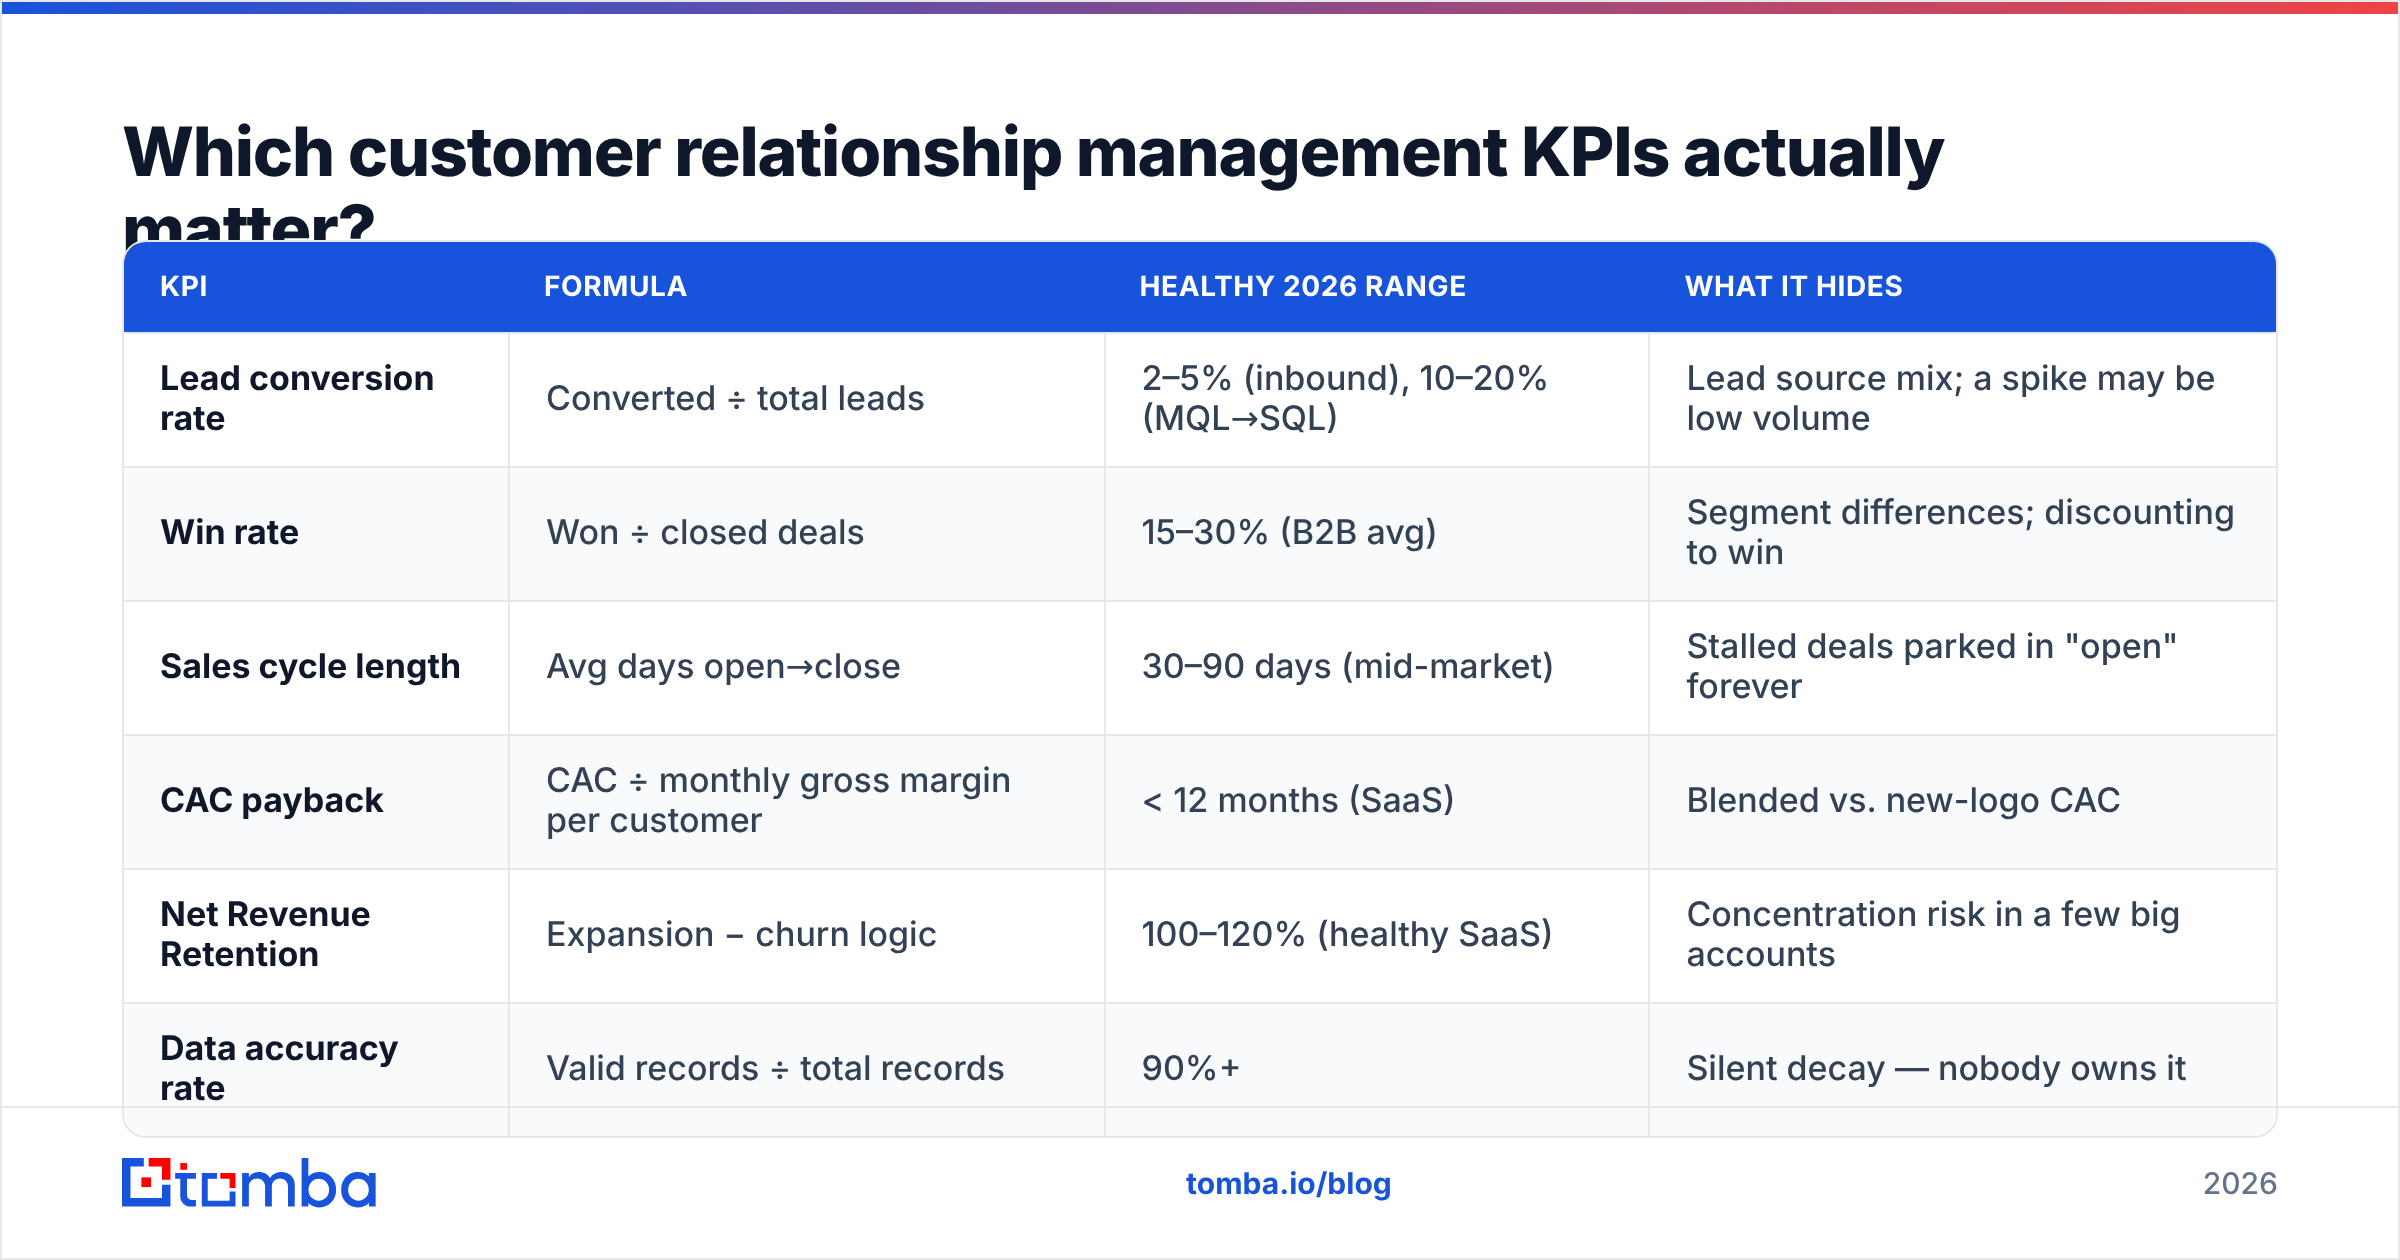
| KPI | Formula | Healthy 2026 range | What it hides |
|---|---|---|---|
| Lead conversion rate | Converted ÷ total leads | 2–5% (inbound), 10–20% (MQL→SQL) | Lead source mix; a spike may be low volume |
| Win rate | Won ÷ closed deals | 15–30% (B2B avg) | Segment differences; discounting to win |
| Sales cycle length | Avg days open→close | 30–90 days (mid-market) | Stalled deals parked in "open" forever |
| CAC payback | CAC ÷ monthly gross margin per customer | < 12 months (SaaS) | Blended vs. new-logo CAC |
| Net Revenue Retention | Expansion − churn logic | 100–120% (healthy SaaS) | Concentration risk in a few big accounts |
| Data accuracy rate | Valid records ÷ total records | 90%+ | Silent decay — nobody owns it |
That last row is the one most teams skip, and it's the one that corrupts every row above it.
Why do CRM KPIs go wrong even when the dashboard looks green?#
Because the inputs are dirty. A KPI is only as trustworthy as the data feeding it, and CRM data decays fast — people change jobs, companies rebrand, emails bounce. Gartner has long estimated that poor data quality costs organizations millions annually, and in a CRM it shows up as inflated pipeline, misrouted leads, and forecasts built on contacts who left 18 months ago.
Here's the chain reaction: a stale contact record means a bounced cold email, which means a missed opportunity that never enters your funnel, which means your lead conversion rate looks better than reality (fewer bad leads counted) while your actual revenue looks worse. The KPI turns green while the business turns red.
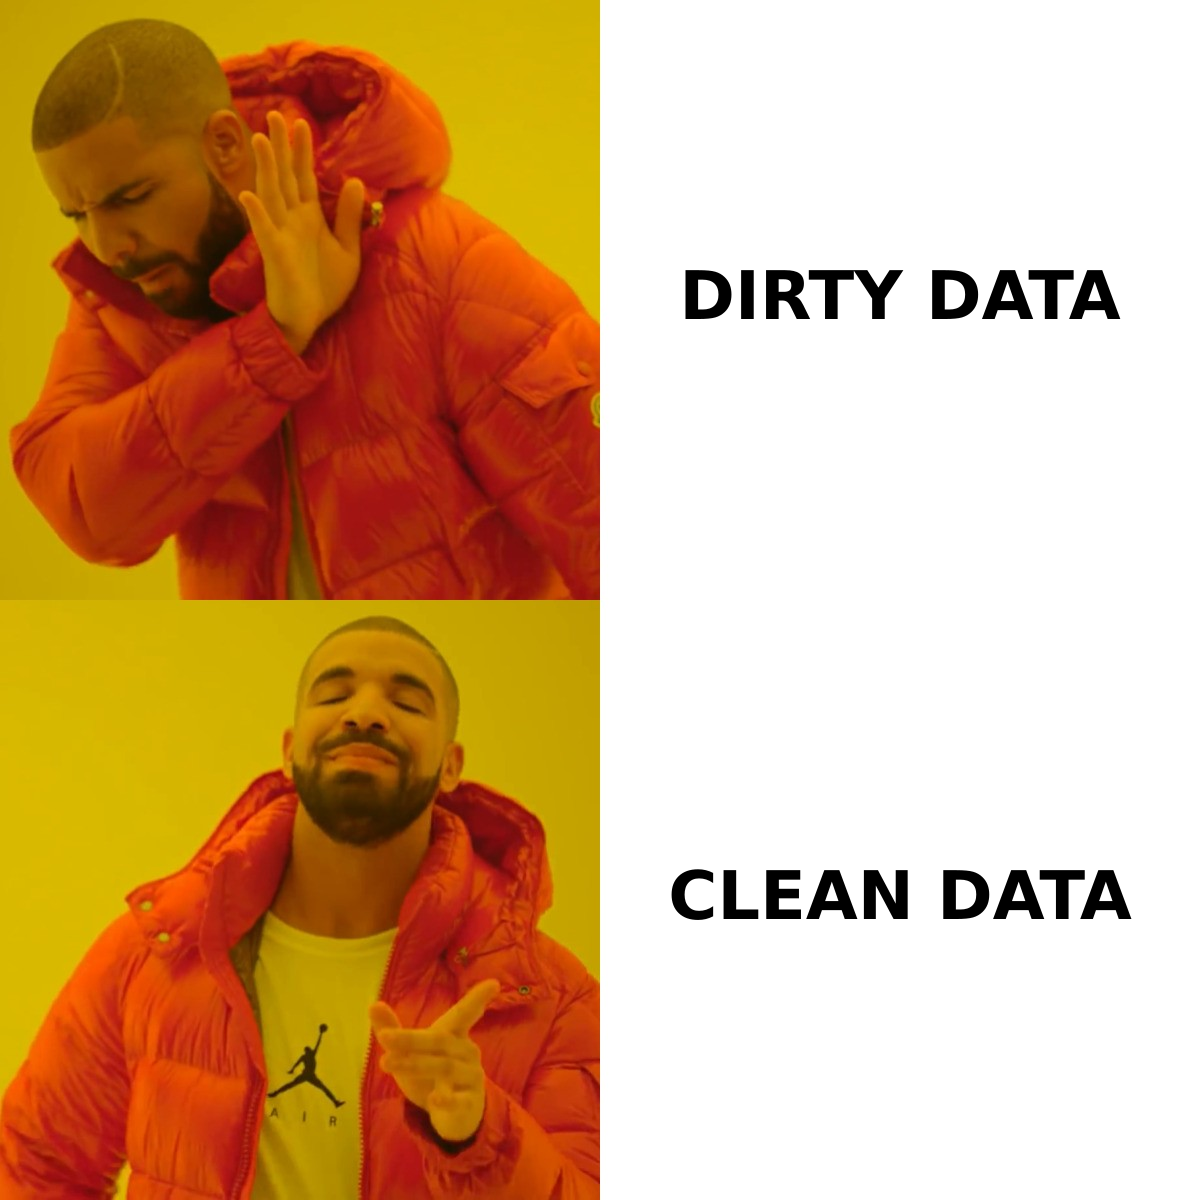
The fix is unglamorous: treat data quality as a first-class KPI with an owner and a cadence. Before you trust a single downstream number, verify the contacts. Running your list through an email verifier removes invalid and risky addresses so your deliverability and conversion metrics reflect real prospects, not ghosts. When you're building lists from scratch, an accurate email finder and ongoing data enrichment keep titles, companies, and contact details current so segmentation KPIs stay honest.
How many CRM KPIs should you actually track?#
Five to seven at the executive level. More than that and no one can hold the full picture in their head, which is the entire point of a KPI.
Use a simple tiered structure so different roles watch different altitudes without drowning:
- North-star tier (1 metric): the one number the whole revenue org rallies around — usually NRR or new ARR.
- Executive tier (5–7 KPIs): win rate, CAC payback, sales cycle, pipeline coverage, NRR, lead conversion, data accuracy.
- Operational tier (unlimited metrics): activity counts, response times, stage-by-stage drop-off — these inform the KPIs above but aren't KPIs themselves.
The mistake is flattening all three tiers into one dashboard. A rep staring at NRR can't act on it; a CEO staring at call volume shouldn't have to. Match the metric to the person who can move it.
What's the difference between activity, pipeline, and outcome KPIs?#
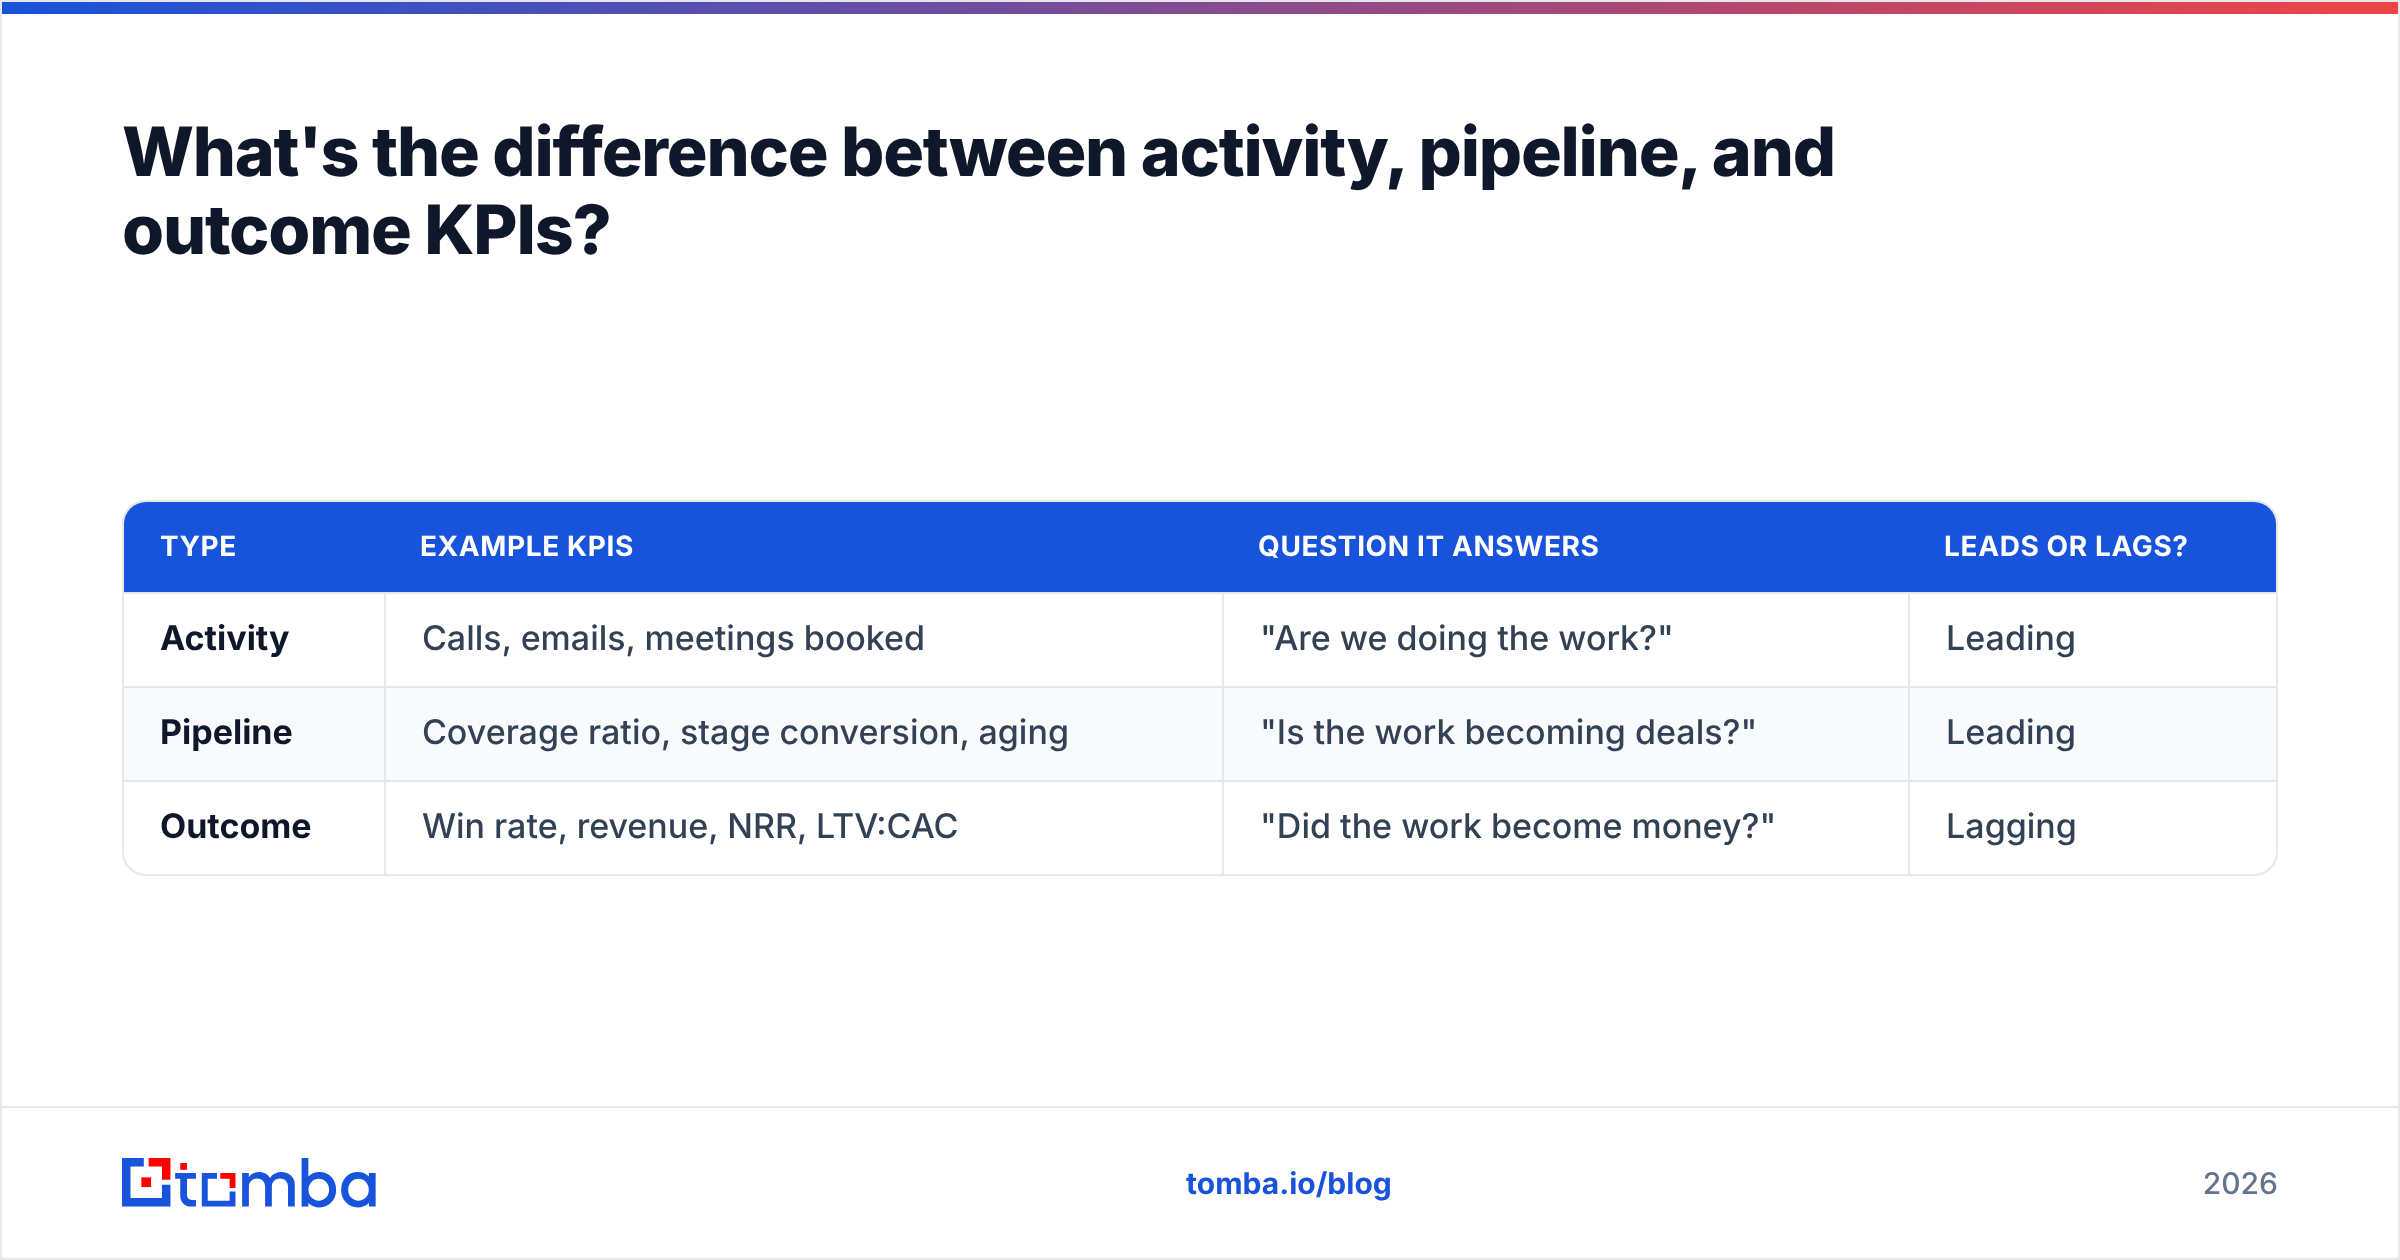
They answer three different questions, and healthy teams watch all three because each is a leading indicator of the next.
| Type | Example KPIs | Question it answers | Leads or lags? |
|---|---|---|---|
| Activity | Calls, emails, meetings booked | "Are we doing the work?" | Leading |
| Pipeline | Coverage ratio, stage conversion, aging | "Is the work becoming deals?" | Leading |
| Outcome | Win rate, revenue, NRR, LTV:CAC | "Did the work become money?" | Lagging |
Activity KPIs are the earliest warning system — if outreach volume drops today, pipeline dips in three weeks and revenue dips next quarter. But activity alone is the classic vanity trap: 500 emails to unverified addresses is activity that produces nothing. This is exactly why data quality sits underneath everything. Reliable contact data is what converts activity KPIs into pipeline KPIs instead of noise.
How do you calculate the KPIs that scare people: LTV, CAC, and the ratio?#
These three intimidate teams because the formulas look academic. They're not. Here's the plain-language version.
Customer Lifetime Value (LTV): average revenue per customer per month × gross margin % × average customer lifespan in months. In everyday terms: how much profit one customer hands you before they leave.
Customer Acquisition Cost (CAC): all sales and marketing spend in a period ÷ new customers won in that period. How much you paid to get them through the door.
The LTV:CAC ratio: LTV ÷ CAC. The rule of thumb from investors and operators alike is roughly 3:1 — you want to earn about three dollars of lifetime value for every dollar spent acquiring. Below 3:1 and you may be overspending or under-monetizing; wildly above it (say 6:1) can mean you're underinvesting in growth and leaving market share on the table. Both HubSpot and Salesforce publish detailed benchmarks worth checking against your own segment.
The catch: LTV:CAC is only meaningful when CAC uses new-logo costs and LTV uses actual retention, not optimistic assumptions. Blended CAC (which includes cheap-to-retain existing customers) flatters the ratio and hides acquisition problems.
How often should you review each KPI?#
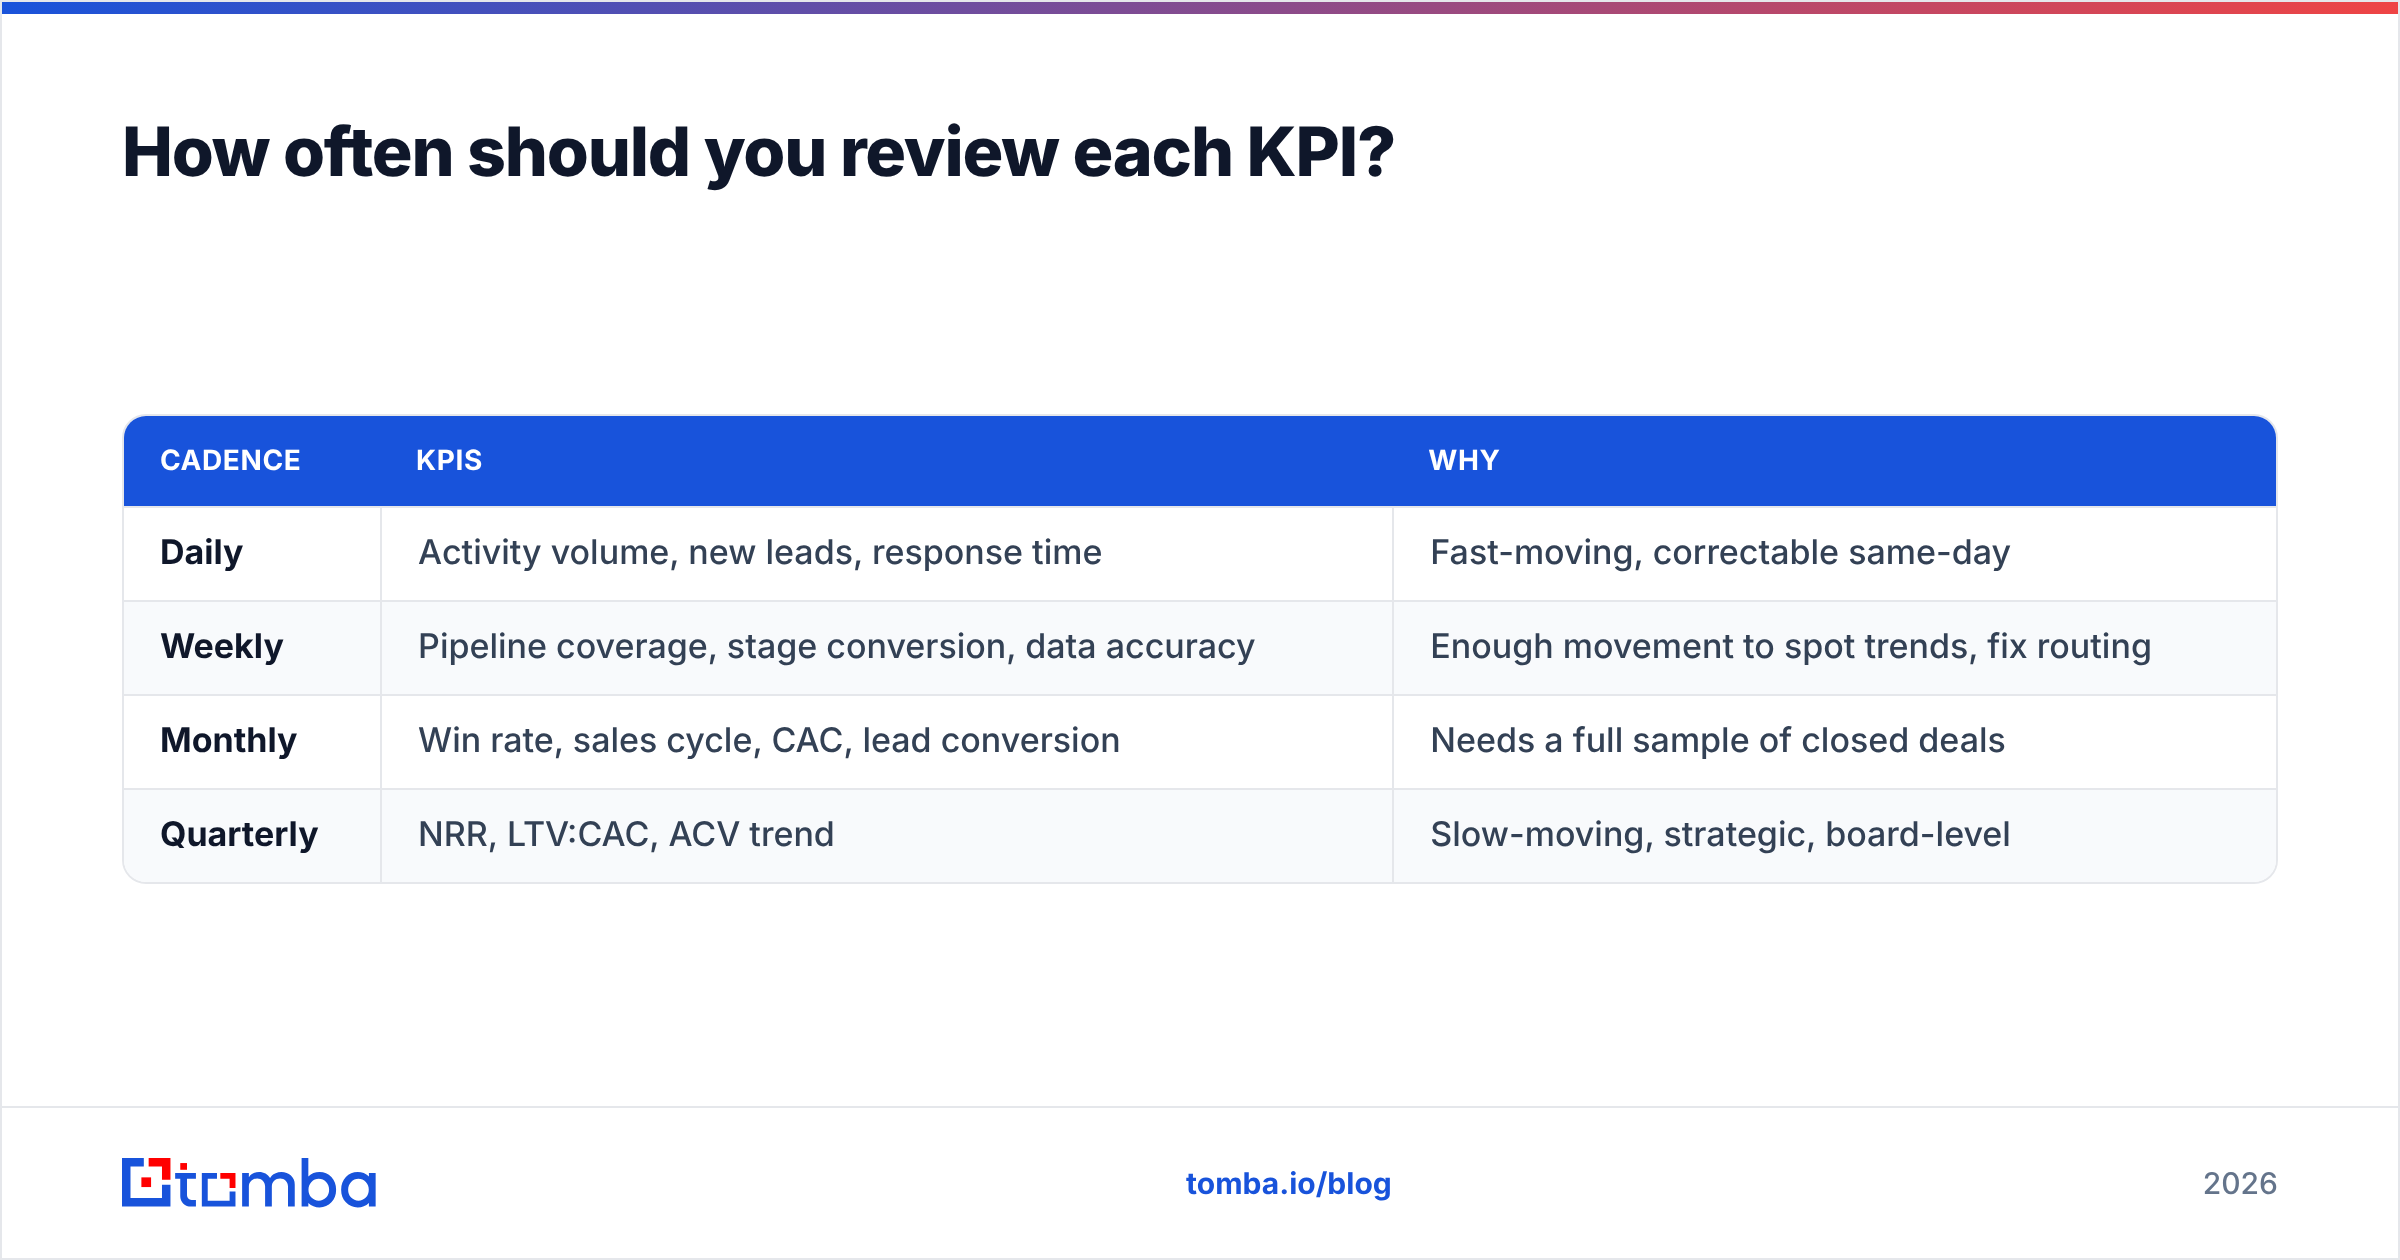
Match the review cadence to how fast the metric can actually change. Reviewing NRR daily is theater; reviewing pipeline coverage quarterly is negligence.
| Cadence | KPIs | Why |
|---|---|---|
| Daily | Activity volume, new leads, response time | Fast-moving, correctable same-day |
| Weekly | Pipeline coverage, stage conversion, data accuracy | Enough movement to spot trends, fix routing |
| Monthly | Win rate, sales cycle, CAC, lead conversion | Needs a full sample of closed deals |
| Quarterly | NRR, LTV:CAC, ACV trend | Slow-moving, strategic, board-level |
Set the cadence once, put it on the calendar, and resist the urge to refresh strategic KPIs obsessively. Watching NRR twitch day to day produces anxiety, not insight.
Building a CRM KPI system that survives contact with reality#
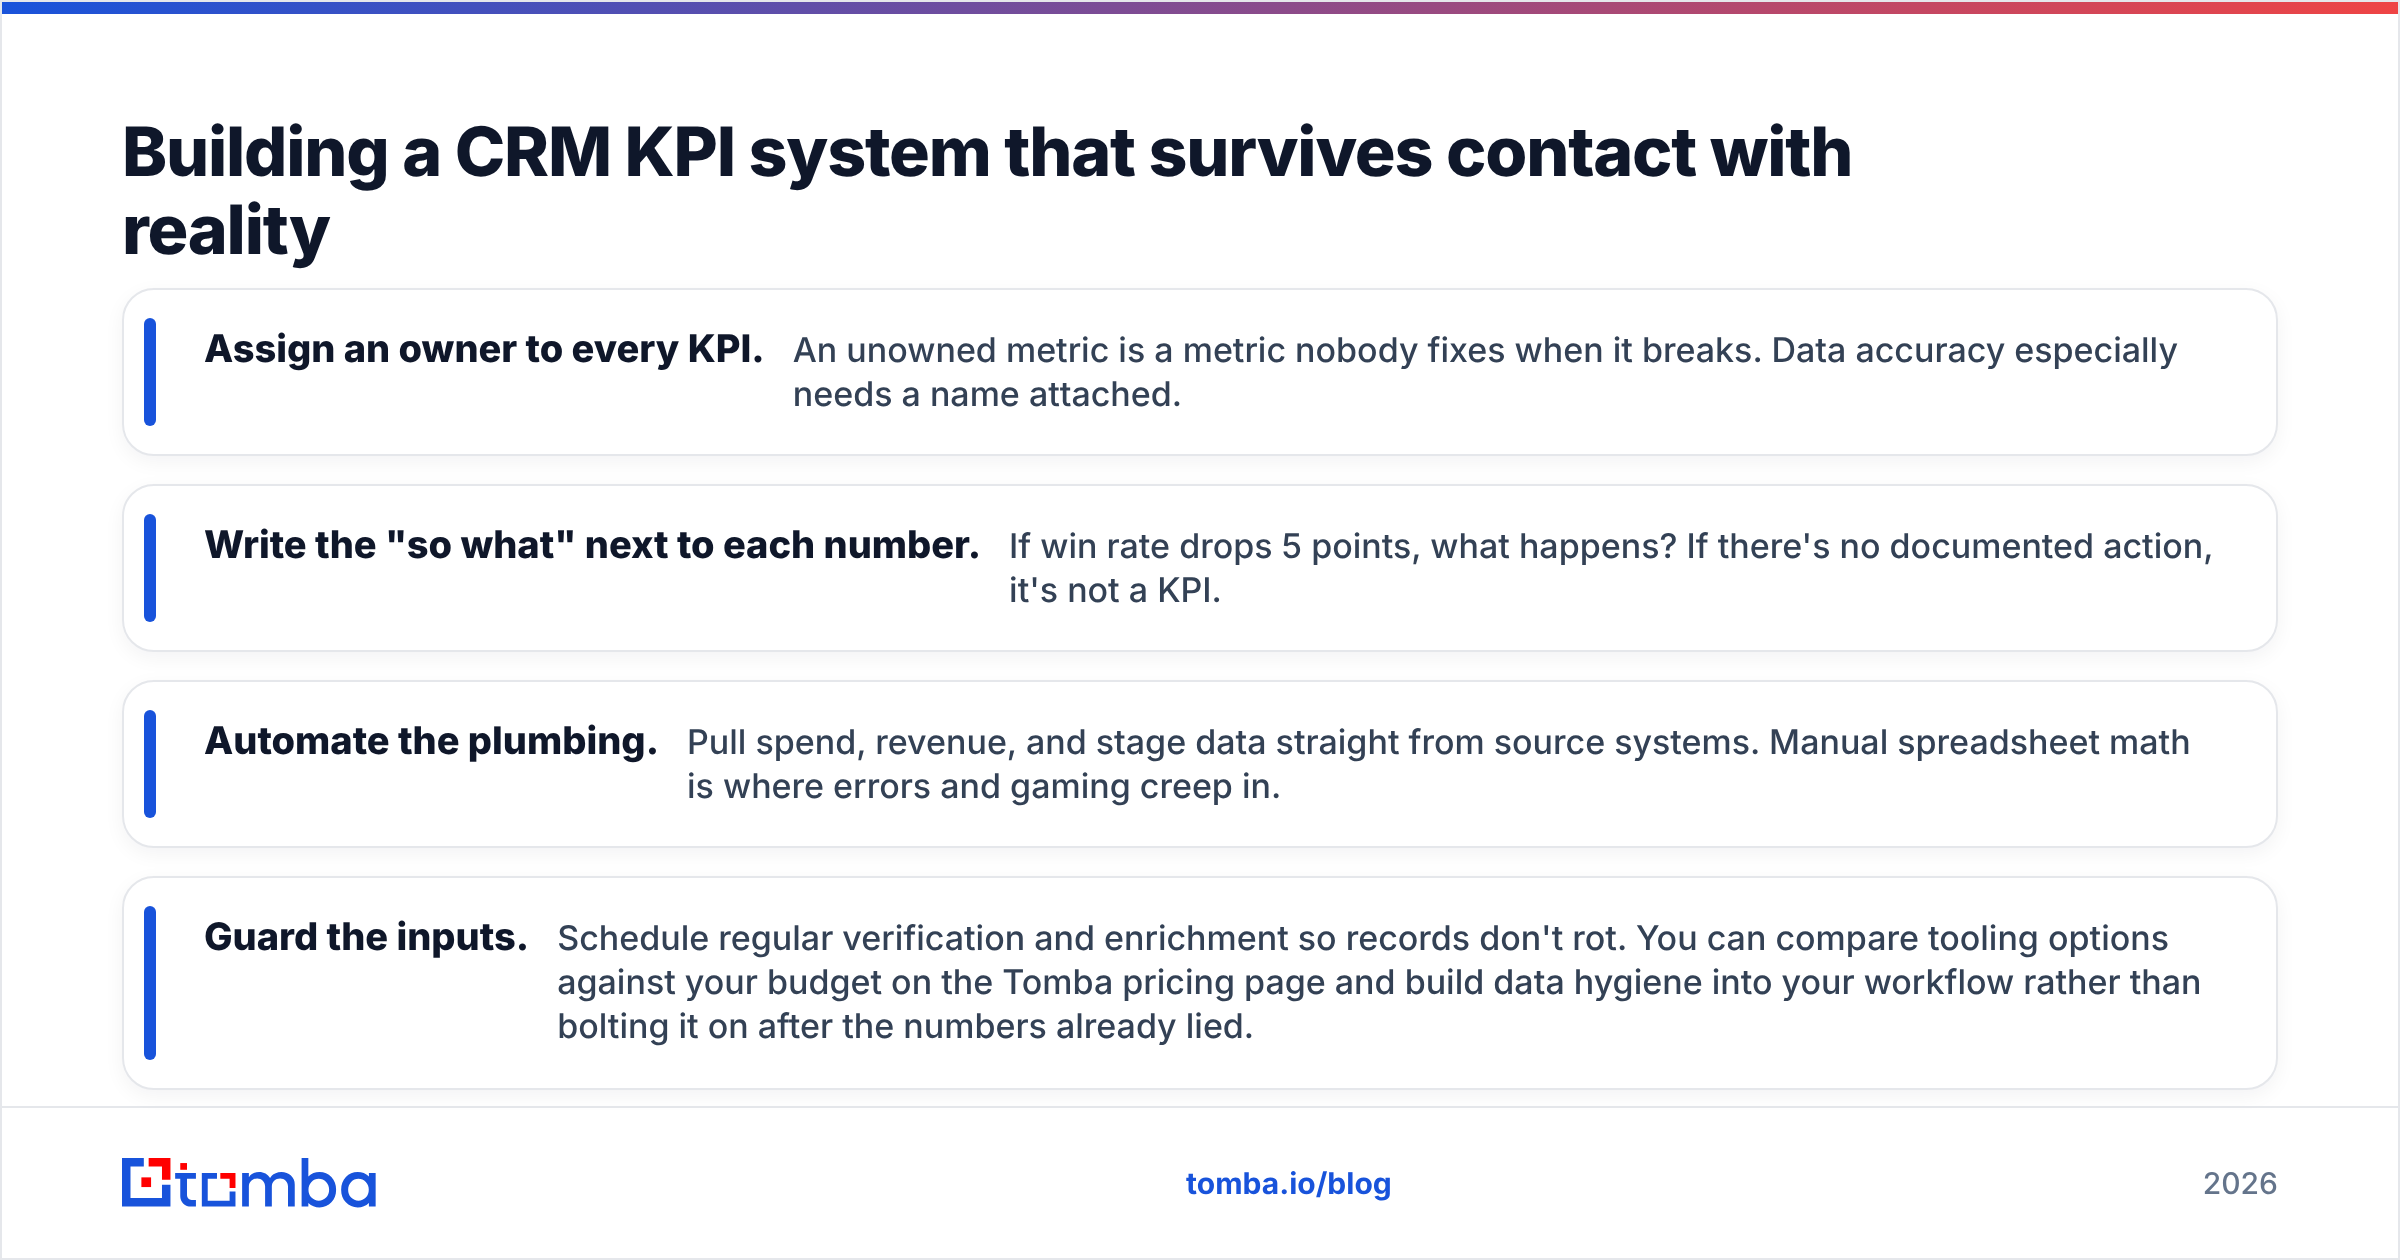
A KPI framework fails in one of three predictable ways: too many metrics, dirty inputs, or no owner. Counter each deliberately.
- Assign an owner to every KPI. An unowned metric is a metric nobody fixes when it breaks. Data accuracy especially needs a name attached.
- Write the "so what" next to each number. If win rate drops 5 points, what happens? If there's no documented action, it's not a KPI.
- Automate the plumbing. Pull spend, revenue, and stage data straight from source systems. Manual spreadsheet math is where errors and gaming creep in.
- Guard the inputs. Schedule regular verification and enrichment so records don't rot. You can compare tooling options against your budget on the Tomba pricing page and build data hygiene into your workflow rather than bolting it on after the numbers already lied.
Do those four things and your dashboard stops being decoration and starts being a decision engine.
The bottom line#
The best customer relationship management KPI is the one that changes a decision. Everything else is a metric — useful context, maybe, but not worth a slot on the executive dashboard. Track a tight set across acquisition, value, and retention; review each on a cadence that matches how fast it moves; and above all, protect the data underneath, because a green KPI built on stale contacts is more dangerous than no KPI at all.
Ready to make your CRM numbers trustworthy from the source? Start with the contacts themselves. Tomba's Email Finder helps you build clean, current prospect lists by domain, name, or company — so your win rate, conversion, and pipeline KPIs reflect real buyers instead of bounced addresses. Pair it with verification and enrichment, and every KPI downstream inherits data you can actually stake a forecast on. Try it free with 25 searches a month and see how much clearer the dashboard gets when the inputs are clean.
Related guides#
Ready to find emails that actually work?
Join 150,000+ professionals who stopped guessing and started sending. Free credits on signup — no credit card required.
Get the Tomba newsletter
Practical outbound tactics and product updates — once every two weeks.
About the author