Data Quality Assessment: A Practical 2026 Framework Guide
A data quality assessment tells you whether your B2B data can be trusted. Here's a 6-step framework, the six dimensions that matter, and how to score them without a data-science team.
Bad data does not announce itself. It hides in a CRM that looks full, a list that exports cleanly, and a dashboard that renders without errors — right up until a rep emails a contact who left two years ago, or marketing burns a quarter's budget on records that bounce. A data quality assessment is how you find those problems on purpose, before they find you.
This guide gives you a working definition, the six dimensions that actually matter, a repeatable scoring method, and a 6-step framework you can run this week without a dedicated data team.
TL;DR#
- A data quality assessment is a structured measurement of how fit your data is for its intended use — scored across accuracy, completeness, consistency, timeliness, validity, and uniqueness.
- You do not need perfect data. You need data that clears a threshold for the decision it drives; a marketing list and a billing system have different bars.
- Score each dimension 0–100, weight them by business impact, and track the composite over time — a single number that leadership can act on.
- The cheapest quality wins come from verification and enrichment at the point of entry, not from massive one-off cleanups that decay within months.
- Automate the recurring checks. Manual audits are a snapshot; pipelines that verify, dedupe, and enrich on a schedule are the actual fix.
What is a data quality assessment?#
A data quality assessment is the process of measuring your datasets against defined quality criteria and reporting how well they meet those criteria. Think of it like a home inspection before you buy: the house looks fine from the street, but the inspector checks the wiring, the foundation, and the roof against a checklist and hands you a report with a grade and a punch list. You are doing the same thing to your contact records, account data, and pipeline.
The key word is fit for use. Quality is not an absolute; it is relative to a purpose. An email address that is 90% likely to be valid is fine for a top-of-funnel newsletter but reckless for a cold outbound campaign where a 5% bounce rate can damage your sender reputation. The assessment's job is to tell you whether your data clears the bar for its job.
Analysts have long tied this to money. Gartner's widely cited estimate puts the average cost of poor data quality at $12.9 million per year per organization, and most of that damage is invisible until you measure it.
Why does data quality matter for B2B teams?#
Because every downstream system inherits the flaws of the data feeding it. In B2B specifically, bad data compounds fast:
- Wasted rep hours. SDRs spend time chasing contacts who changed jobs, work at dead companies, or never existed. That is your most expensive resource burning on records that were never going to convert.
- Deliverability damage. High bounce rates from stale email lists get your domain flagged. One bad campaign can suppress the inbox placement of your good campaigns for weeks.
- Broken reporting. Duplicate accounts inflate your total addressable market and hide the fact that two reps are working the same logo.
- Failed automation. Lead routing, scoring, and enrichment workflows all assume clean inputs. Feed them garbage and the automation confidently does the wrong thing at scale.
- Lost trust. Once a sales team stops believing the CRM, they build shadow spreadsheets, and your single source of truth quietly dies.
The through-line: quality problems do not stay contained. They leak into revenue.
What are the six dimensions of data quality?#
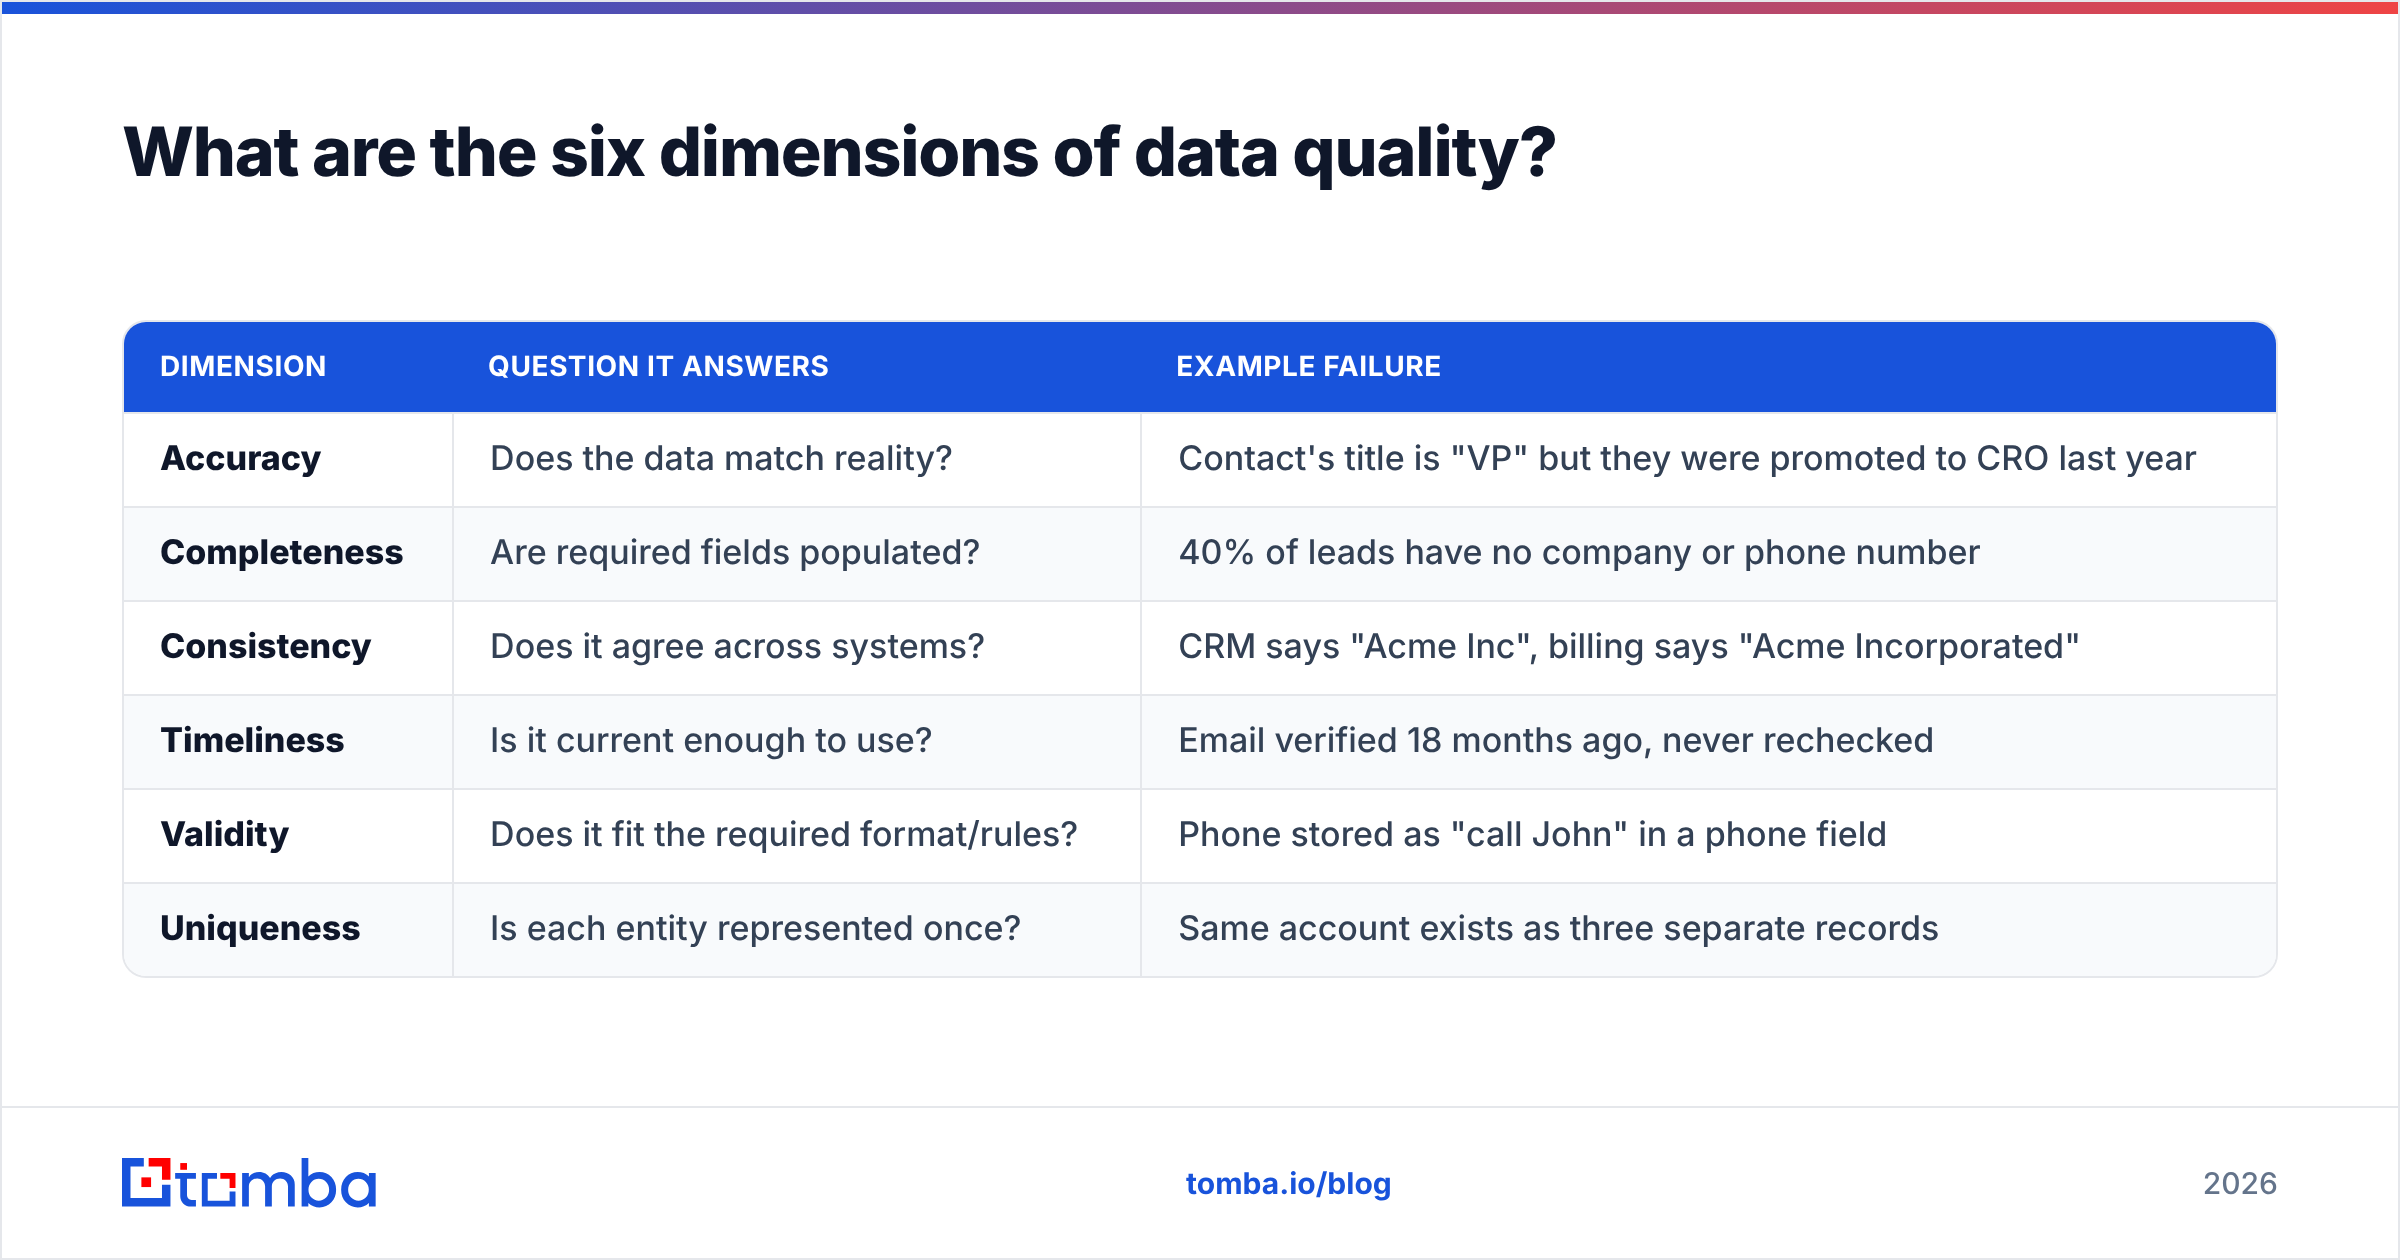
Most credible frameworks converge on the same core dimensions. You measure each one separately because a dataset can ace one and fail another — a record can be perfectly formatted (valid) and completely wrong (inaccurate).
| Dimension | Question it answers | Example failure |
|---|---|---|
| Accuracy | Does the data match reality? | Contact's title is "VP" but they were promoted to CRO last year |
| Completeness | Are required fields populated? | 40% of leads have no company or phone number |
| Consistency | Does it agree across systems? | CRM says "Acme Inc", billing says "Acme Incorporated" |
| Timeliness | Is it current enough to use? | Email verified 18 months ago, never rechecked |
| Validity | Does it fit the required format/rules? | Phone stored as "call John" in a phone field |
| Uniqueness | Is each entity represented once? | Same account exists as three separate records |
A useful mental model: accuracy and timeliness decay on their own over time (people change jobs, companies fold), while completeness, consistency, validity, and uniqueness are mostly created at the point of entry and integration. That split tells you where to spend: decay problems need recurring verification; entry problems need validation gates.
For a deeper look at where reliable B2B records actually come from, Tomba documents its own data sources — worth reviewing when you evaluate any provider's accuracy claims.
How do you score a data quality assessment?#
Turn each dimension into a percentage, then roll them into a weighted composite. Here is a concrete, no-nonsense method.
Step 1 — Score each dimension 0–100. For most dimensions this is a simple ratio:
- Completeness = (records with all required fields ÷ total records) × 100
- Uniqueness = (1 − duplicate records ÷ total records) × 100
- Validity = (records passing format rules ÷ total records) × 100
- Timeliness = (records verified within your freshness window ÷ total) × 100
Accuracy is harder because you need a source of truth. Sample 100–300 records, verify them against a trusted external source (an email verifier, a live lookup, a phone call), and extrapolate the pass rate.
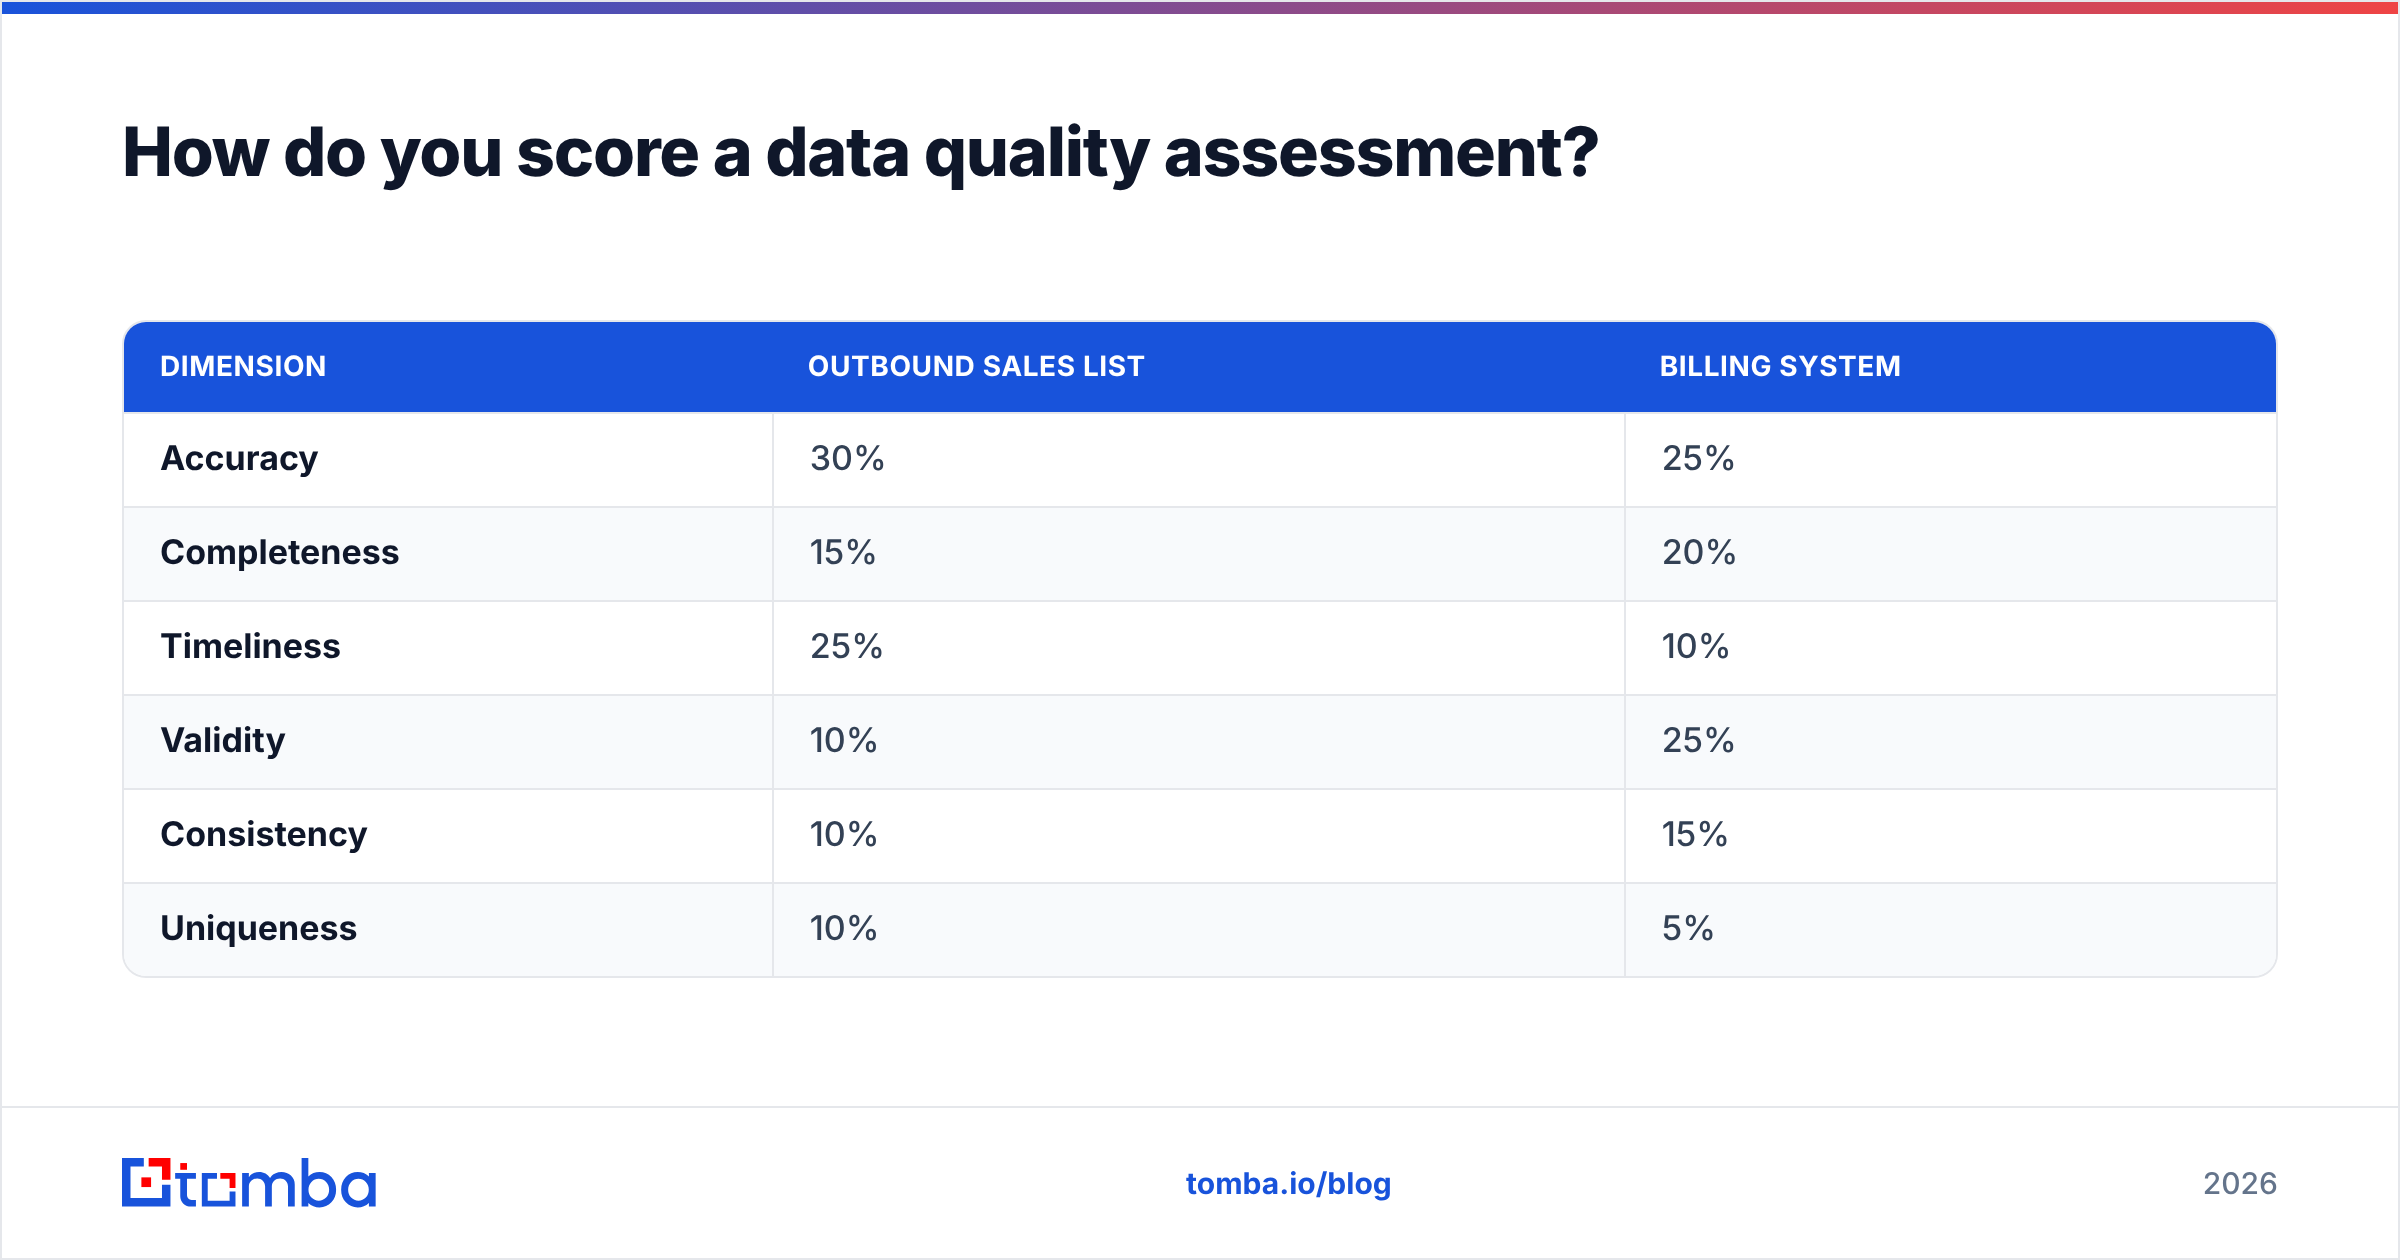
Step 2 — Weight by business impact. Not every dimension matters equally for every use case. Weight them:
| Dimension | Outbound sales list | Billing system |
|---|---|---|
| Accuracy | 30% | 25% |
| Completeness | 15% | 20% |
| Timeliness | 25% | 10% |
| Validity | 10% | 25% |
| Consistency | 10% | 15% |
| Uniqueness | 10% | 5% |
Step 3 — Compute the composite. Multiply each dimension score by its weight and sum. A list scoring 92 accuracy, 80 completeness, 70 timeliness, and so on produces a single number — say, 84 — that leadership can track quarter over quarter.
Step 4 — Set thresholds, not perfection targets. Decide the minimum composite for each use case. Maybe cold outbound requires 85+, nurture requires 70+, and analytics requires 60+. Data below threshold gets routed to remediation, not to reps.
What does a data quality assessment framework look like end to end?#
Here is the 6-step loop. Run it once to establish a baseline, then automate the recurring parts.
- Profile. Inventory your datasets and run column-level profiling — null rates, distinct counts, format distributions, min/max values. Profiling surfaces the obvious problems (a field that is 60% empty) in minutes and tells you where to look closer.
- Define rules. For each field, write the rule it must satisfy: email matches a valid pattern and passes SMTP verification, country is a two-letter ISO code, revenue is a positive number. These rules become your validity and completeness checks.
- Measure. Score every dimension using the method above. Produce a baseline report with a composite per dataset and per use case.
- Remediate. Fix the highest-impact failures first. Verify and remove dead emails, dedupe accounts, enrich missing firmographics, standardize inconsistent values. Prioritize by weight × failure rate, not by whatever is easiest.
- Prevent. Add validation at the point of entry so the same problems do not reappear. This is where most programs fail — they clean once and skip prevention, so the data re-rots within two quarters.
- Monitor. Schedule the checks. A weekly or monthly job that re-verifies aging records, catches new duplicates, and re-scores the composite turns a one-time audit into a living control.
Manual audit vs. automated pipeline: which should you use?#
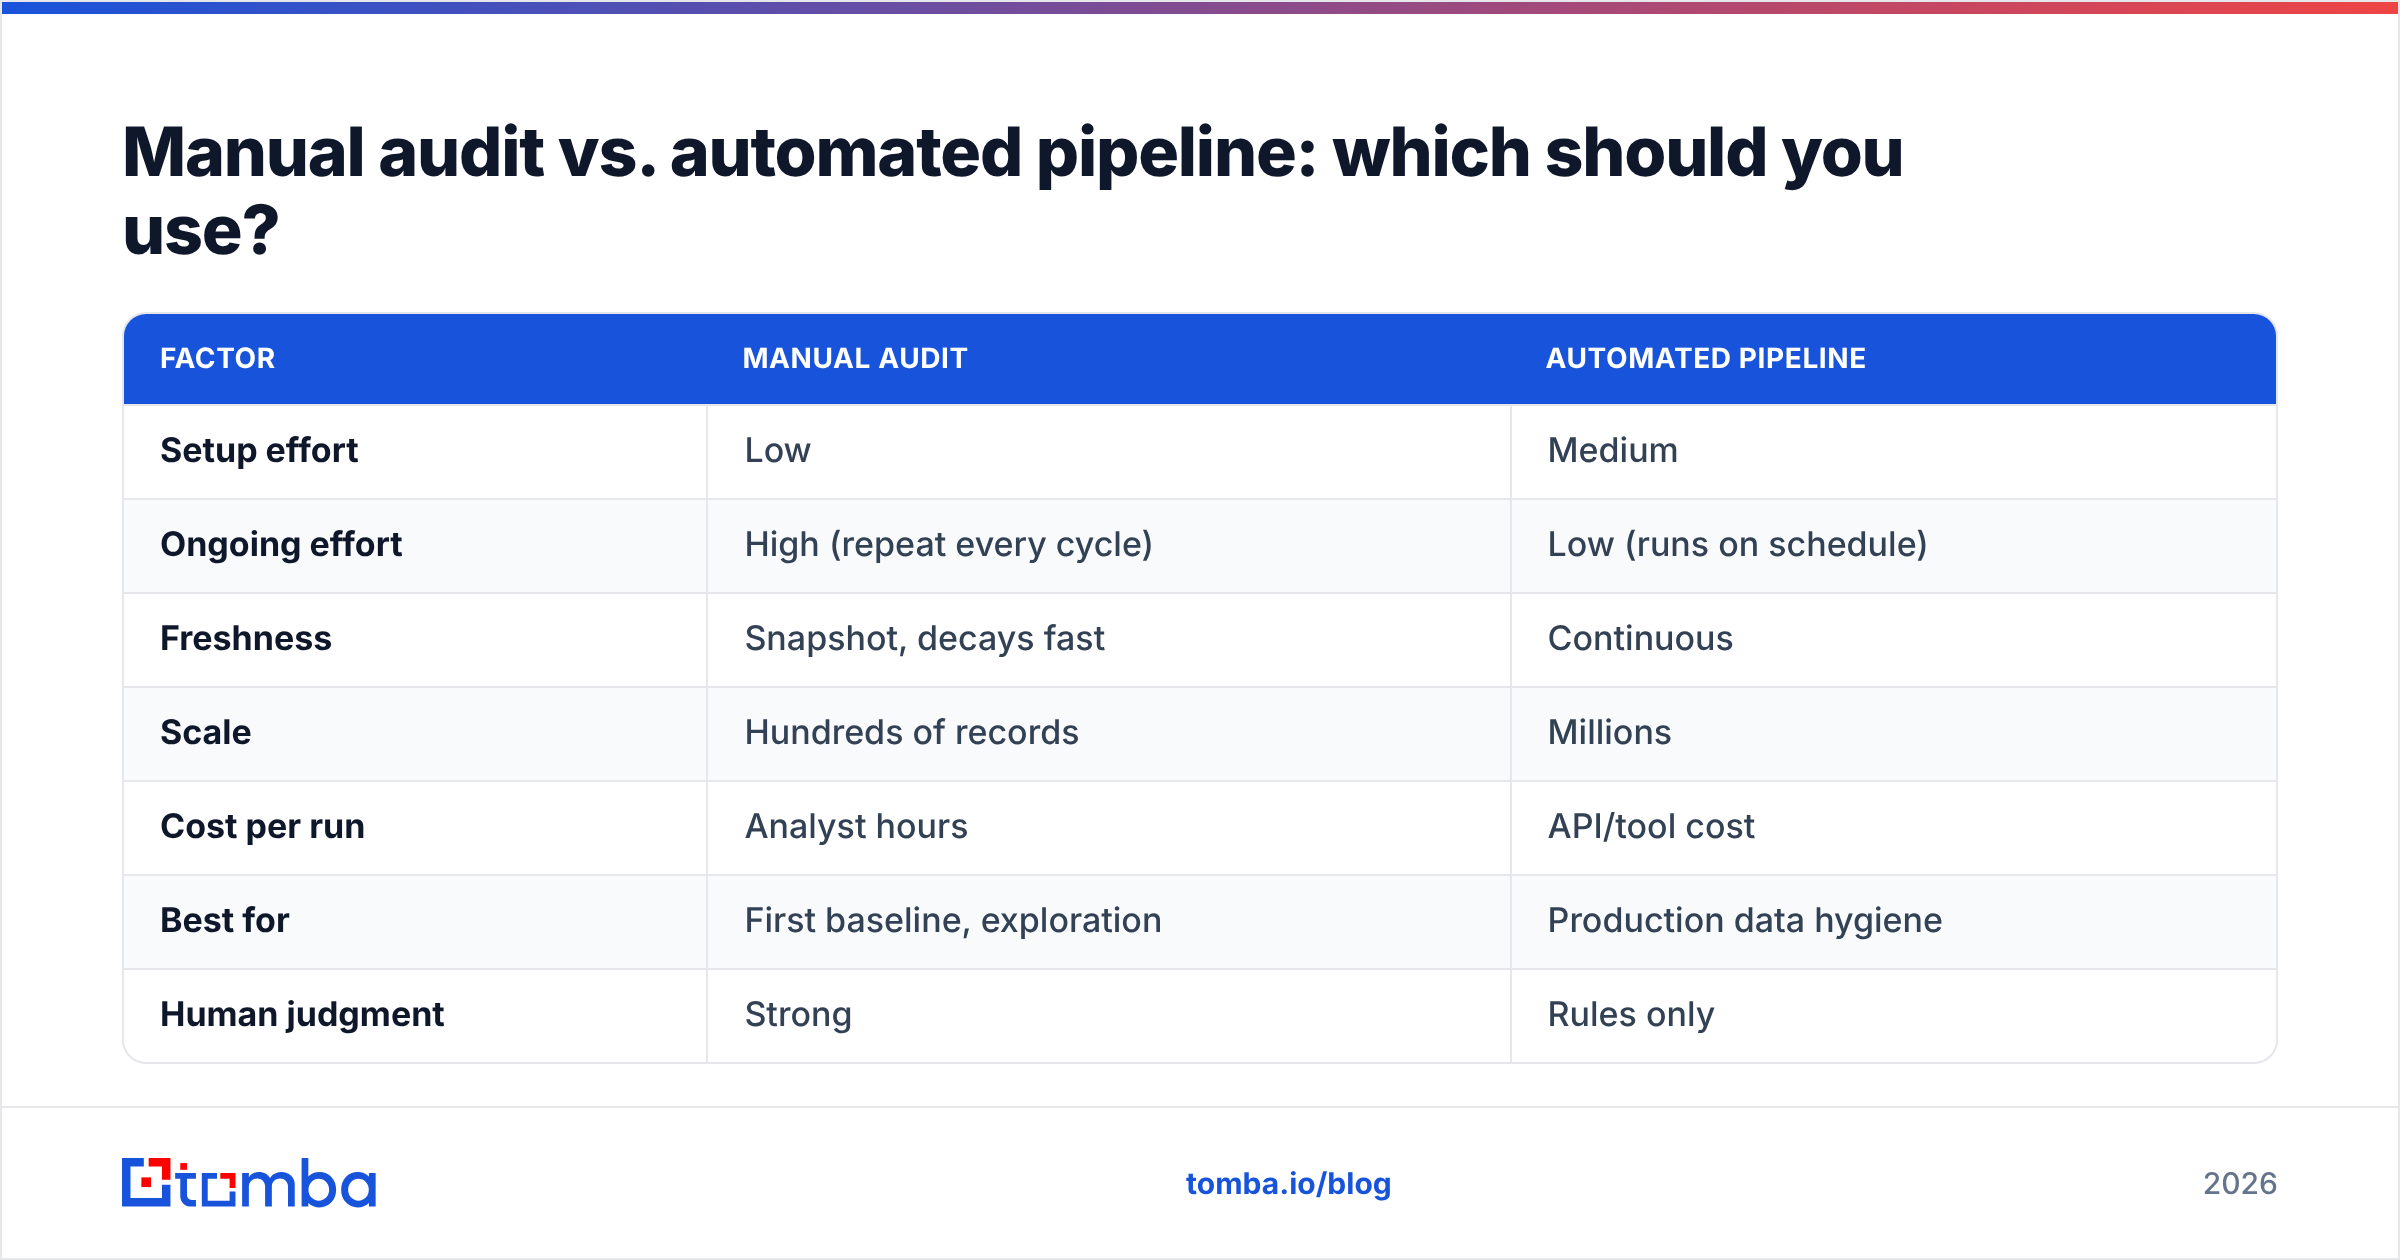
Both, in sequence. A manual audit gives you the first baseline and teaches you what "good" looks like for your data. But manual audits are a photograph — accurate the day you take them, stale a month later. The durable fix is automation.
| Factor | Manual audit | Automated pipeline |
|---|---|---|
| Setup effort | Low | Medium |
| Ongoing effort | High (repeat every cycle) | Low (runs on schedule) |
| Freshness | Snapshot, decays fast | Continuous |
| Scale | Hundreds of records | Millions |
| Cost per run | Analyst hours | API/tool cost |
| Best for | First baseline, exploration | Production data hygiene |
| Human judgment | Strong | Rules only |
The practical answer: audit manually to learn, then encode what you learned into an automated pipeline. Tools like bulk verification and data enrichment exist precisely so you do not re-run the tedious parts by hand every month.
What tools do you need for a data quality assessment?#
You need coverage across four jobs. Some platforms bundle several; independent reviews on G2 and Capterra are a good sanity check on vendor claims.
- Profiling — to see what your data actually contains (null rates, distributions, outliers). Many BI tools and open-source libraries handle this.
- Verification — to confirm contact data is real and current. Email verification, phone validation, and catch-all detection sit here.
- Enrichment — to fill gaps with trusted firmographic and contact data instead of leaving fields blank.
- Deduplication and standardization — to collapse duplicate entities and normalize inconsistent values.
The common mistake is buying a heavy "data quality platform" when 80% of your B2B pain is stale and incomplete contact data — a problem that verification and enrichment solve directly and cheaply.
What are common data quality assessment mistakes?#
- Chasing 100%. Perfect data does not exist and is not the goal. Fit for use is. Spending a month to move accuracy from 96% to 98% on a nurture list is a waste; that effort belongs on the outbound list that gates deliverability.
- Cleaning once and stopping. Data decays roughly 2–3% per month for contact records as people change jobs. A cleanup with no prevention or monitoring is a treadmill you keep falling off.
- Ignoring the point of entry. If your web forms accept "asdf@asdf" and your imports skip validation, you are manufacturing dirty data faster than you can clean it.
- No business context in scoring. A composite score with equal weights on every dimension hides the ones that actually cost you money. Weight by impact.
- Treating it as an IT project. Data quality is a revenue problem. The people who feel the pain — sales, marketing, RevOps — need to own the thresholds and the definition of "good enough."
How often should you run a data quality assessment?#
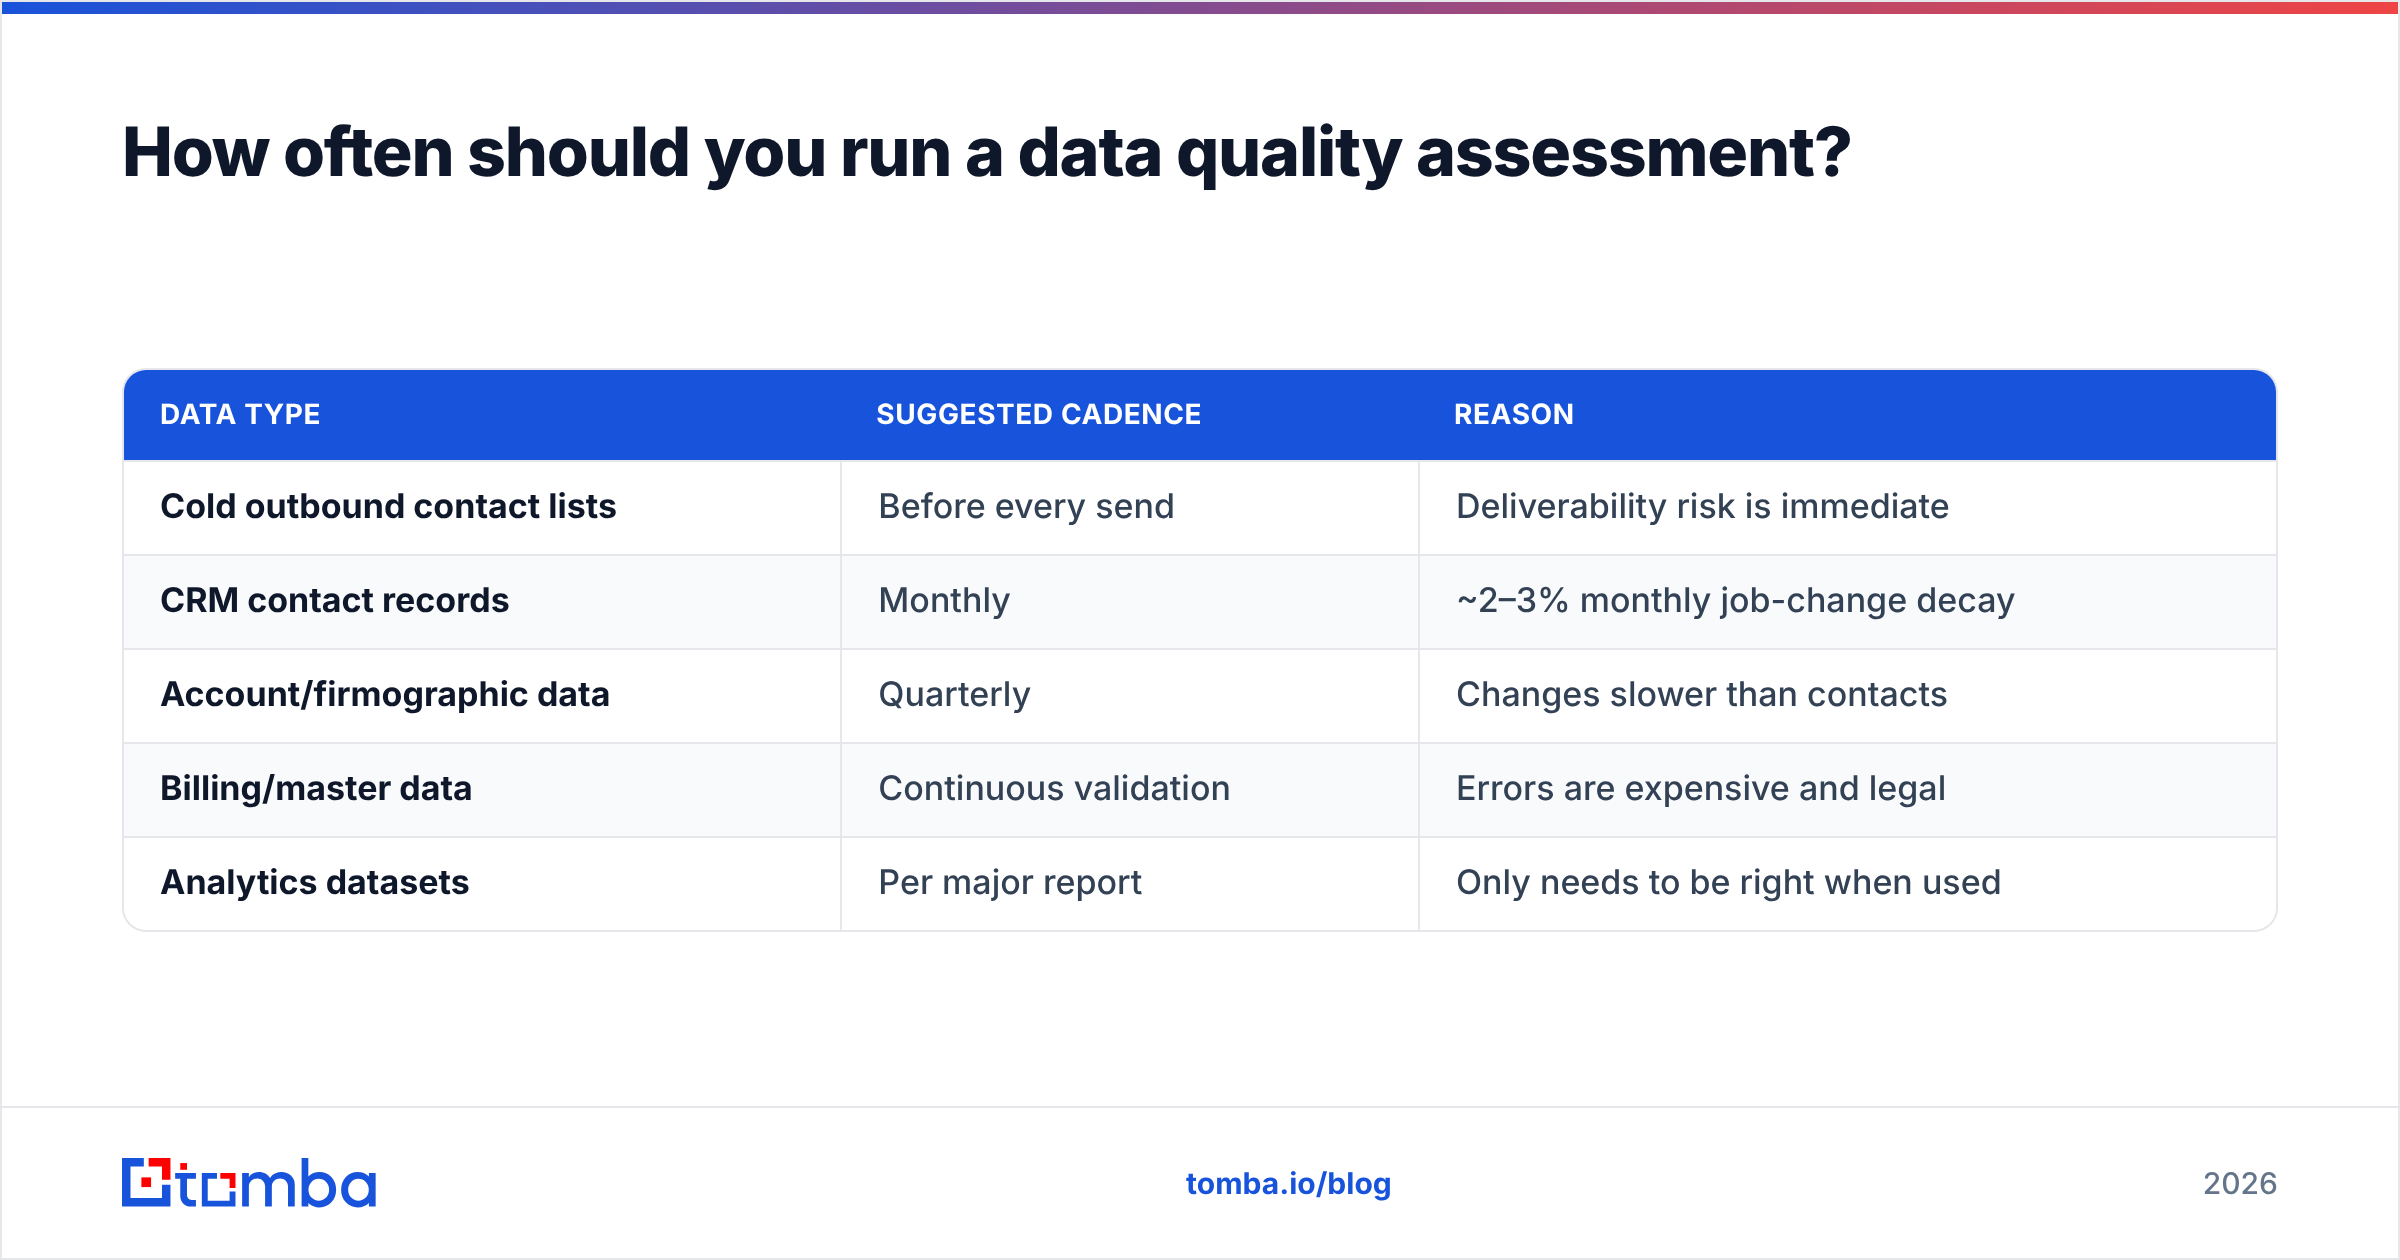
Match the cadence to how fast the data decays and how much a mistake costs.
| Data type | Suggested cadence | Reason |
|---|---|---|
| Cold outbound contact lists | Before every send | Deliverability risk is immediate |
| CRM contact records | Monthly | ~2–3% monthly job-change decay |
| Account/firmographic data | Quarterly | Changes slower than contacts |
| Billing/master data | Continuous validation | Errors are expensive and legal |
| Analytics datasets | Per major report | Only needs to be right when used |
The pattern is simple: the closer data sits to a costly, irreversible action, the more often you check it.
Closing: fix the data feeding your pipeline first#
A data quality assessment is only useful if it changes what you do next. For most B2B teams, the fastest measurable win is the contact layer — the emails, phones, and firmographics your reps and campaigns depend on every day. That is where decay is fastest and where a bad record does the most immediate damage.
If your assessment surfaces stale or incomplete contact data — and it almost always will — start there. The Tomba Email Finder finds and verifies professional email addresses by domain, name, or company, so the records entering your CRM clear a real accuracy bar instead of a formatting one. Pair it with verification and enrichment on a schedule, and the composite score you worked to establish stops sliding the moment you close the report. You can start on the free tier (25 searches/month) and scale up through Tomba's paid plans — $49/mo Starter, $99/mo Growth — as your data-quality program grows.
Measure it, fix the contact layer, automate the checks, and your pipeline stops running on data you can't trust.
Related guides#
Ready to find emails that actually work?
Join 150,000+ professionals who stopped guessing and started sending. Free credits on signup — no credit card required.
Get the Tomba newsletter
Practical outbound tactics and product updates — once every two weeks.
About the author