Deal Velocity: How to Measure and Speed Up Your Pipeline
Deal velocity tells you how much revenue your pipeline produces per day — and exactly which of four levers is slowing it down. Here's the formula, the benchmarks, and the fixes that actually move it.

TL;DR
- Deal velocity = (number of opportunities × average deal value × win rate) ÷ sales cycle length. It tells you how much revenue your pipeline generates per day, not per quarter.
- Most teams try to fix velocity by adding opportunities. That's the weakest lever — win rate and cycle length compound faster and cost nothing extra.
- A 10% cycle-length reduction is worth more than a 10% opportunity increase, because cycle length is a divisor.
- Bad contact data is the silent velocity killer: wrong emails, wrong titles, and missing decision-makers add weeks of dead time before a deal even qualifies.
- Track velocity by segment, not company-wide. A blended number hides the two segments that are actually broken.
What is deal velocity?#
Deal velocity is the rate at which revenue moves through your pipeline, expressed as dollars per day. Think of it like a factory line: you can measure how many units are on the belt (pipeline coverage), or you can measure how many finished units come off the end per hour. Deal velocity is the second measurement — and it's the one that predicts whether you hit your number.
The standard formula:
Deal Velocity = (Number of Opportunities × Average Deal Value × Win Rate) ÷ Sales Cycle Length (days)
A worked example. Say your team has 120 open opportunities, an average deal value of $18,000, a win rate of 22%, and an average sales cycle of 64 days:
(120 × $18,000 × 0.22) ÷ 64 = $7,425 per day
That number is useful in three ways. It gives you a forward-looking revenue rate you can multiply by remaining days in the quarter. It gives you a single scoreboard that four different teams (marketing, SDRs, AEs, RevOps) all influence. And when it drops, the formula tells you exactly which of the four inputs caused the drop.
The trap is treating it as a vanity metric. Velocity computed across your entire book — SMB self-serve deals blended with six-month enterprise cycles — produces a number that describes no real deal. Segment first, then measure.
Which of the four levers actually moves the number?#
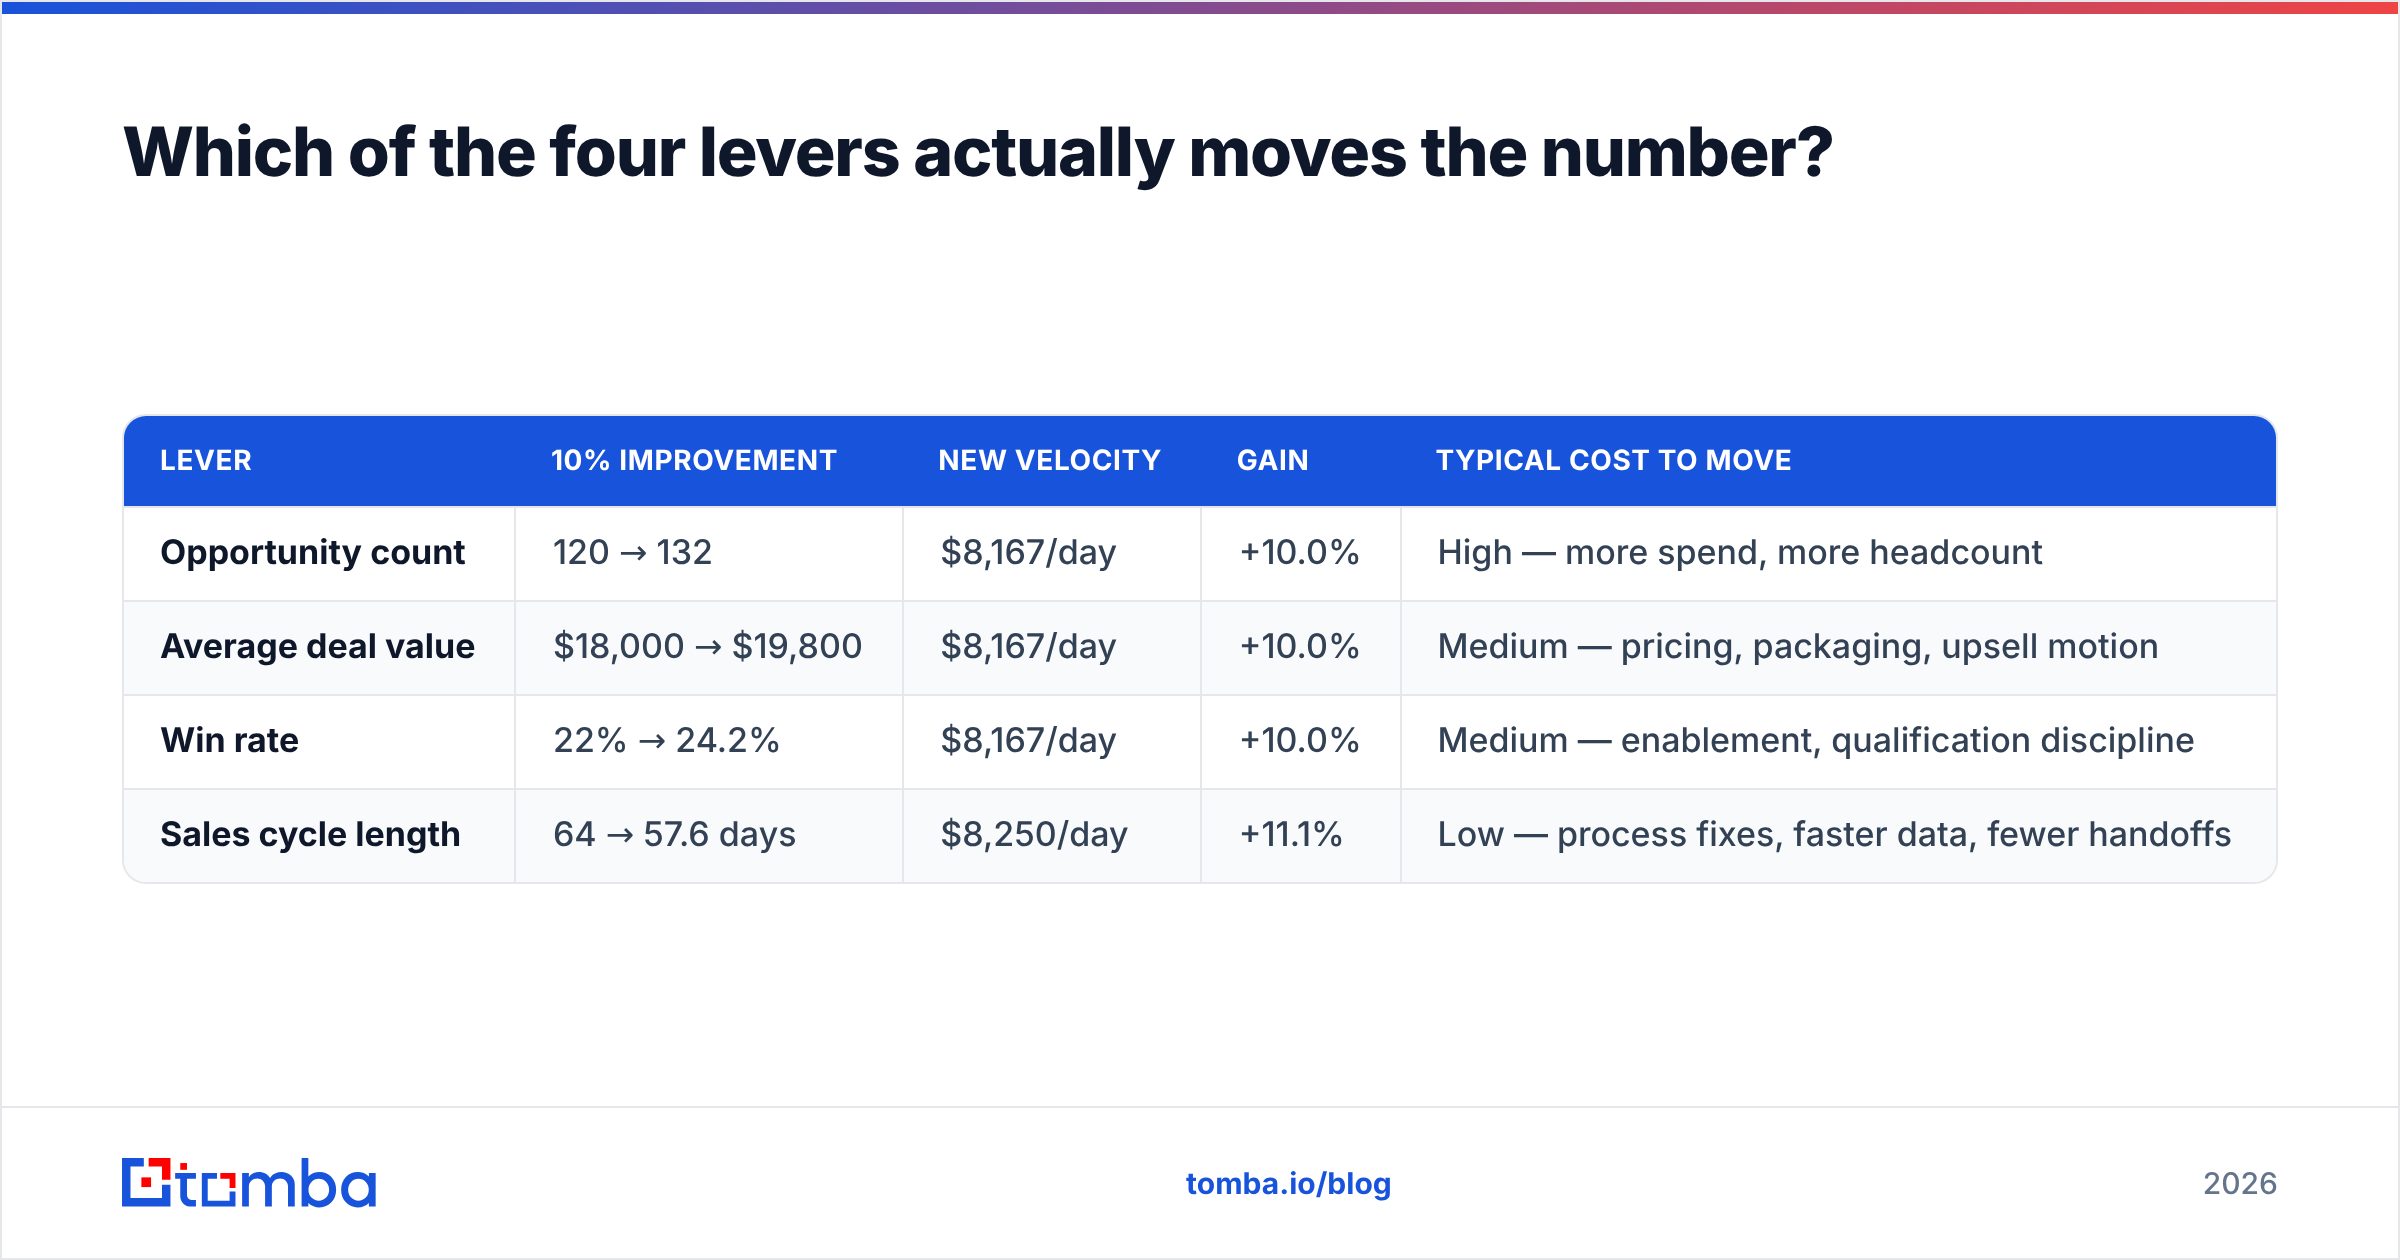
Not equally. Here's how each lever behaves when you push it 10% in the right direction, starting from the $7,425/day baseline above.
| Lever | 10% improvement | New velocity | Gain | Typical cost to move |
|---|---|---|---|---|
| Opportunity count | 120 → 132 | $8,167/day | +10.0% | High — more spend, more headcount |
| Average deal value | $18,000 → $19,800 | $8,167/day | +10.0% | Medium — pricing, packaging, upsell motion |
| Win rate | 22% → 24.2% | $8,167/day | +10.0% | Medium — enablement, qualification discipline |
| Sales cycle length | 64 → 57.6 days | $8,250/day | +11.1% | Low — process fixes, faster data, fewer handoffs |
The arithmetic is boring but the implication isn't: cycle length is a divisor, so it produces a slightly larger gain per unit of improvement. More importantly, it is almost always the cheapest lever to move. Cutting six days off a cycle usually means removing a redundant approval step, getting the right contact on the first call, or auto-populating a security questionnaire — not hiring anyone.
The lever most teams reach for first is opportunity count, because it's the most visible and the easiest to buy. It is also the one with the worst marginal economics: doubling top-of-funnel volume with unqualified accounts tends to lower win rate and lengthen cycles simultaneously, which can leave velocity flat or negative.

Anchor your prioritization on this order:
- Cycle length first. Audit the stage-to-stage dwell times. The bottleneck is usually one stage, not the whole funnel.
- Win rate second. Tighten qualification. Losing faster is a velocity win — a deal that dies in week two costs less pipeline time than one that dies in month four.
- Deal value third. Multi-product bundling and annual-vs-monthly terms move this without new logos.
- Opportunity count last. Only after the first three are healthy, or you're just pushing more volume through a leaky, slow system.
Where does time actually disappear in a sales cycle?#
Almost never where reps say it does. When you instrument stage timestamps in your CRM, the dead time clusters in four places:
Pre-qualification research. Reps spend hours per week hunting for the right contact, verifying that a title is current, and finding a working email address. This is invisible in most dashboards because the clock hasn't started yet — but it delays first touch by days.
First-touch bounce loops. An email to a stale address bounces, the rep tries a permutation, that bounces too, and three days evaporate. Worse, repeated bounces degrade sender reputation, which lowers the deliverability of every subsequent send.
Multi-threading gaps. Deals stall when a single champion goes quiet. Teams that identify three or more stakeholders early see materially shorter cycles because no one person can freeze the deal. Gartner's research on B2B buying has consistently found that buying groups now involve six to ten decision-makers — a deal threaded to one contact is a deal waiting to stall.
Procurement and security review. The last mile. Rarely fixable by the rep, usually fixable by pre-staging documents at the proposal stage instead of the contract stage.
Here's the pattern: three of those four are data problems, not selling problems. Reps aren't slow because they lack motivation; they're slow because the inputs to their day are wrong.
How do you diagnose a velocity drop?#
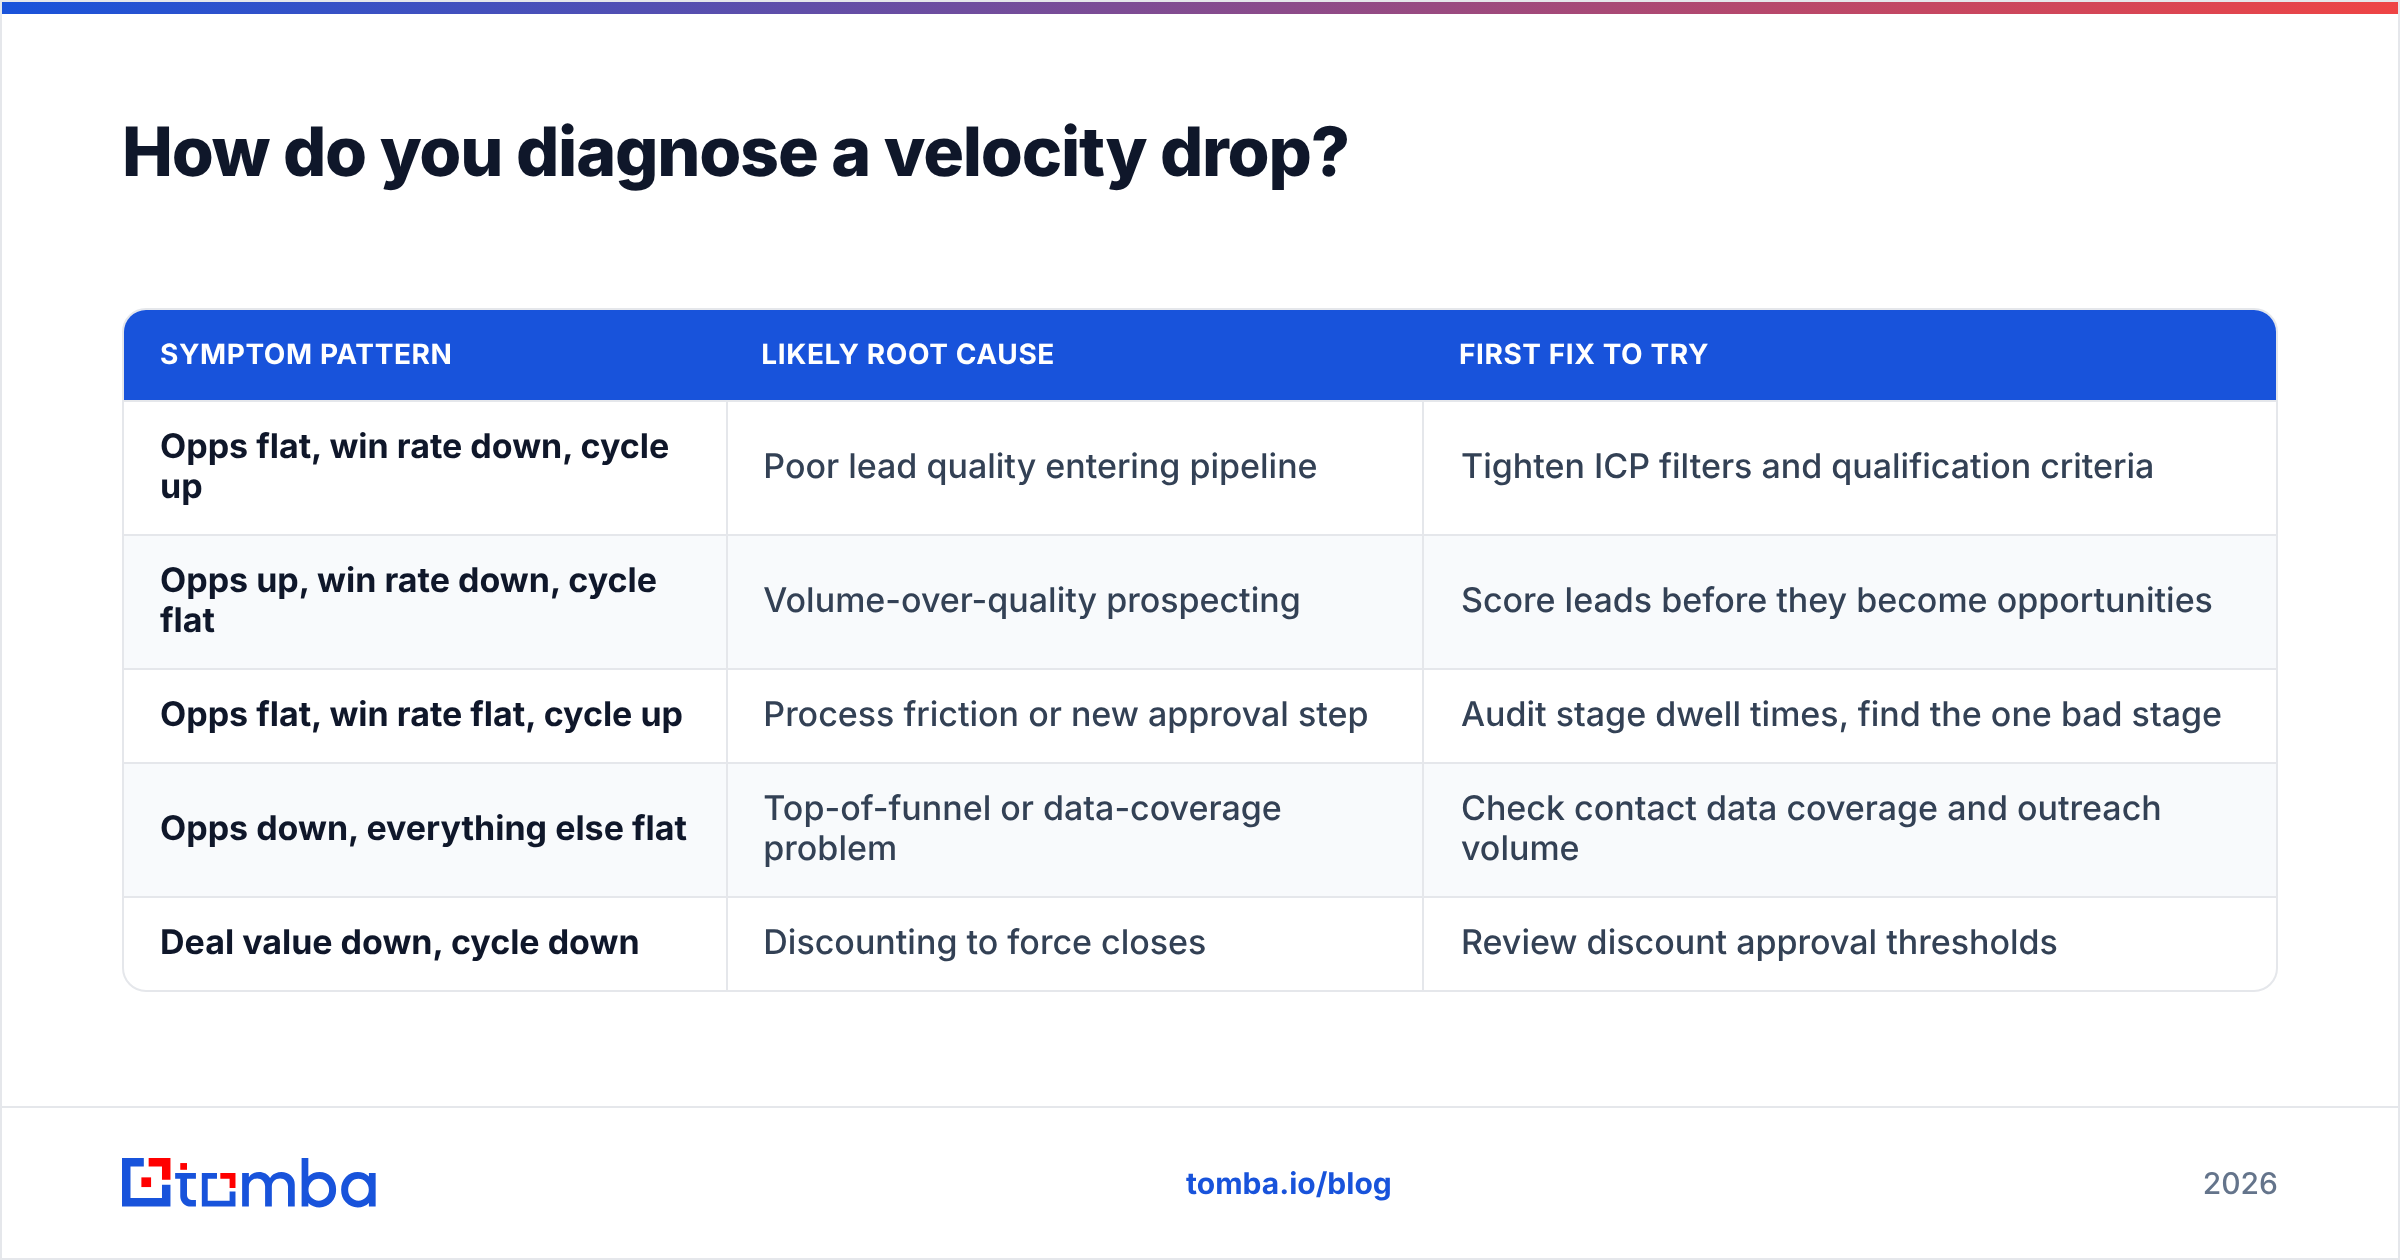
Run the formula on two adjacent periods and compare each input in isolation. A velocity decline always traces to at least one of the four, and the pattern of movement tells you the cause.
| Symptom pattern | Likely root cause | First fix to try |
|---|---|---|
| Opps flat, win rate down, cycle up | Poor lead quality entering pipeline | Tighten ICP filters and qualification criteria |
| Opps up, win rate down, cycle flat | Volume-over-quality prospecting | Score leads before they become opportunities |
| Opps flat, win rate flat, cycle up | Process friction or new approval step | Audit stage dwell times, find the one bad stage |
| Opps down, everything else flat | Top-of-funnel or data-coverage problem | Check contact data coverage and outreach volume |
| Deal value down, cycle down | Discounting to force closes | Review discount approval thresholds |
Two practical rules when you run this diagnosis.
First, use a rolling 90-day window, not month-over-month. Deal velocity is noisy at short intervals, especially for teams closing fewer than 30 deals a quarter — one whale distorts average deal value badly enough to make the whole number meaningless.
Second, exclude open deals from cycle-length calculations, but track them separately as "aging pipeline." Averaging only closed-won deals makes your cycle look shorter than it is, because the deals that are quietly rotting never enter the average. Report both.
What does a healthy deal velocity look like in 2026?#
There is no universal benchmark, and any article that gives you one number is selling something. Velocity is denominated in your own dollars and your own days — a $7,000/day figure is excellent for a 4-person team and alarming for a 40-person one.
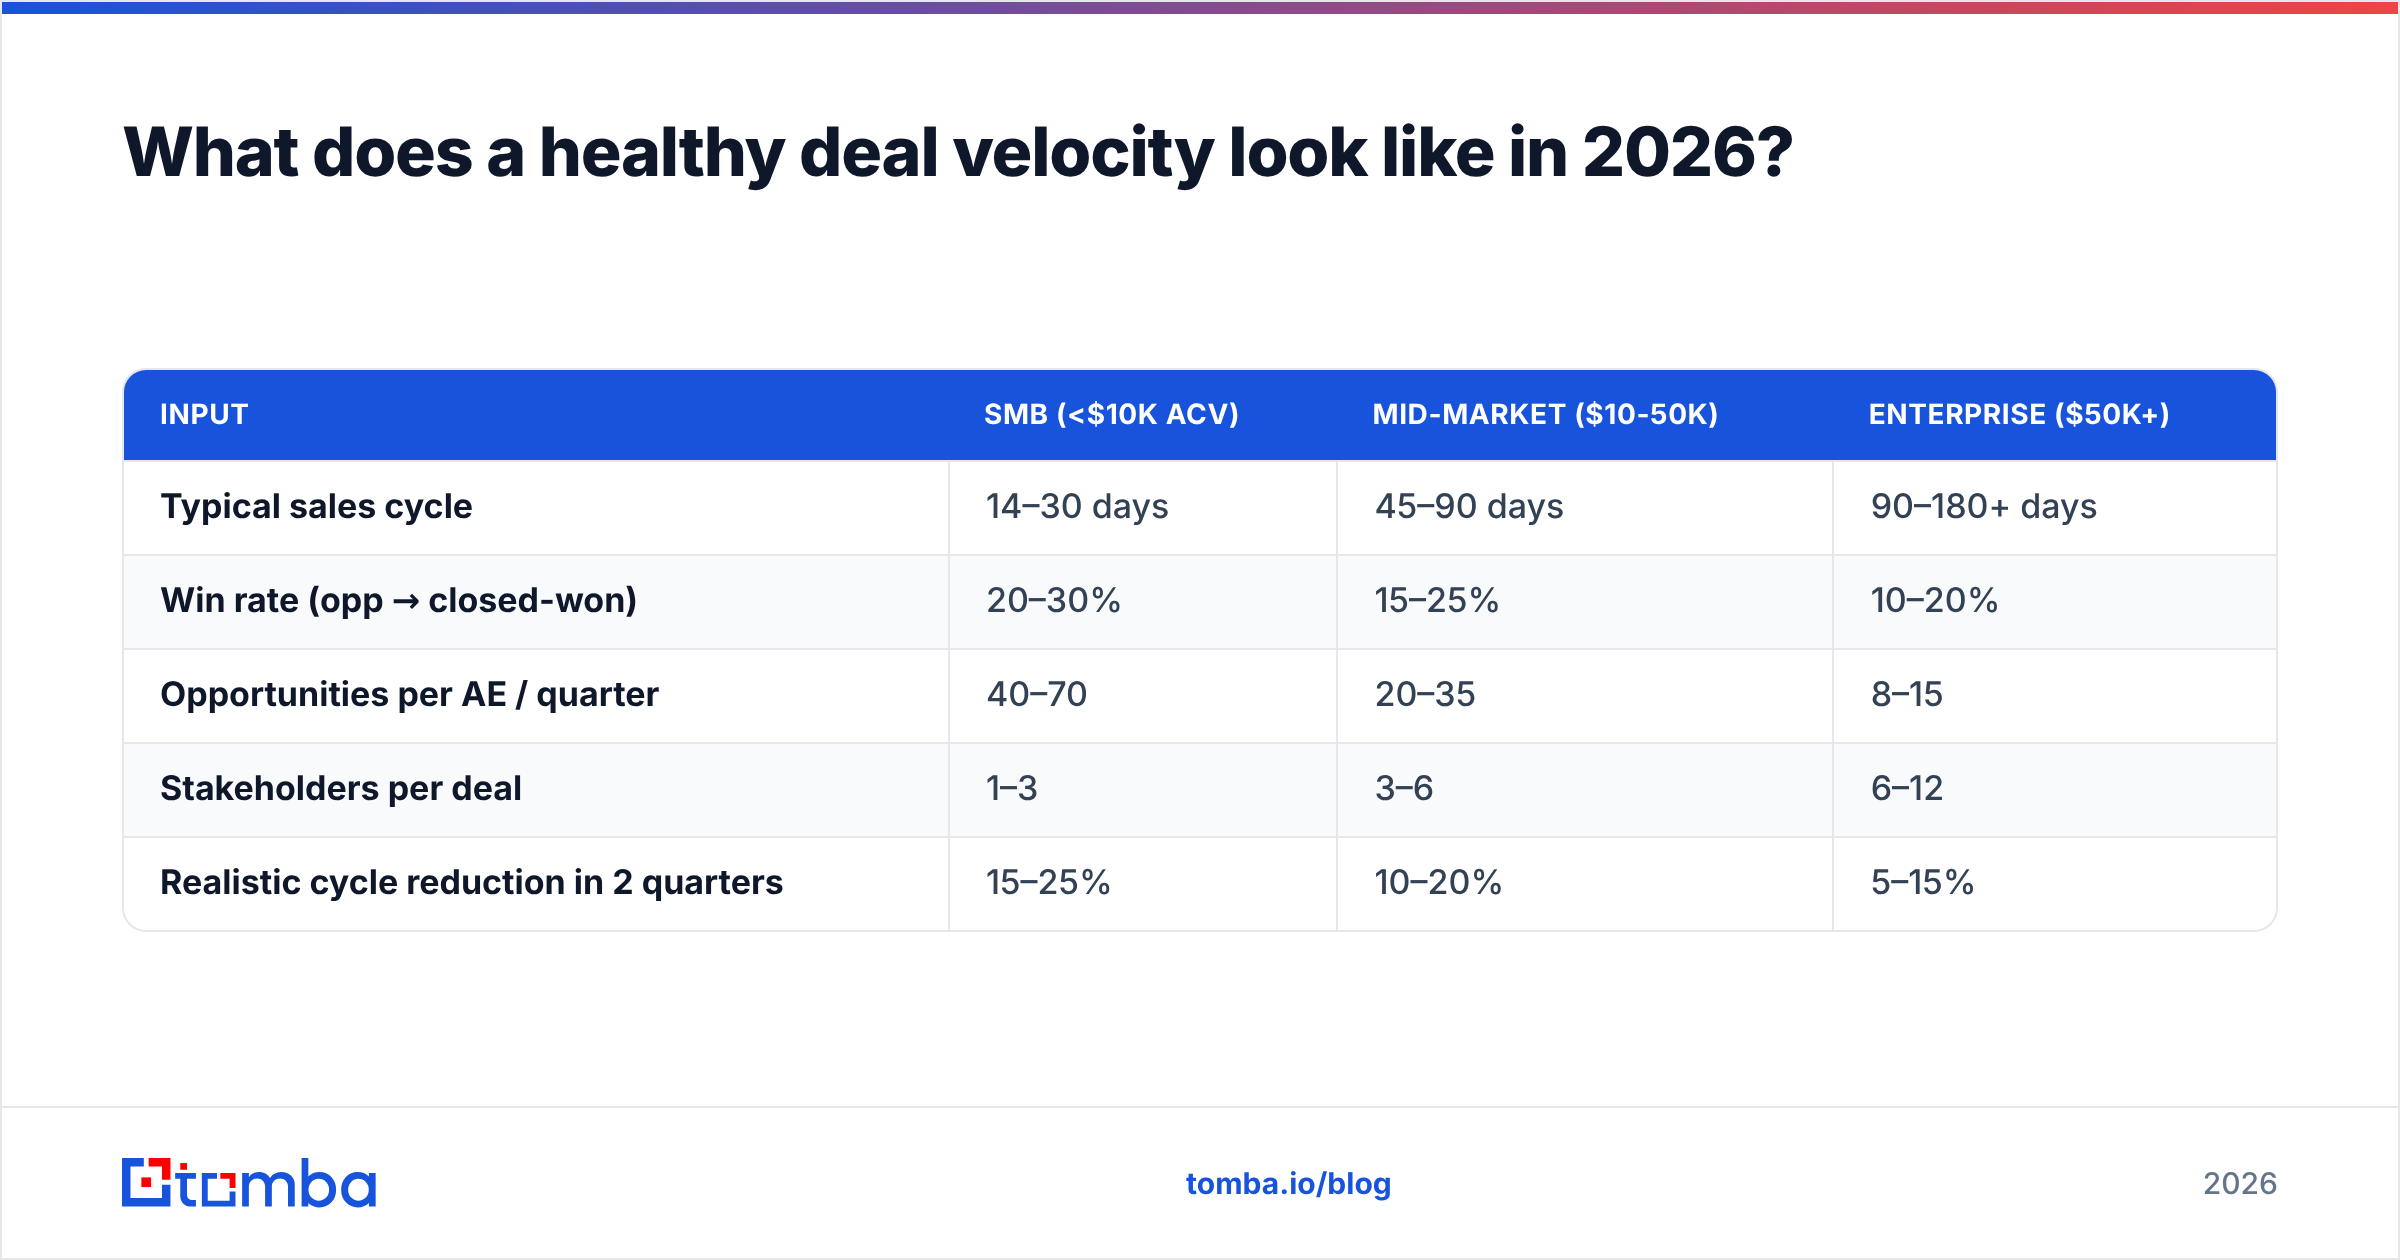
What you can benchmark are the four inputs. Reasonable ranges for B2B SaaS, drawn from vendor benchmark reports and peer-review data on G2:
| Input | SMB (<$10k ACV) | Mid-market ($10-50k) | Enterprise ($50k+) |
|---|---|---|---|
| Typical sales cycle | 14–30 days | 45–90 days | 90–180+ days |
| Win rate (opp → closed-won) | 20–30% | 15–25% | 10–20% |
| Opportunities per AE / quarter | 40–70 | 20–35 | 8–15 |
| Stakeholders per deal | 1–3 | 3–6 | 6–12 |
| Realistic cycle reduction in 2 quarters | 15–25% | 10–20% | 5–15% |
Use the last row as your planning constraint. If someone promises to halve an enterprise sales cycle in one quarter, the plan is either fantasy or it involves discounting — which lowers average deal value and cancels out the velocity gain.
The right target: pick the single worst input relative to these ranges, and set a quarterly goal for that one only. Teams that try to move all four at once move none of them.
How does contact data quality change deal velocity?#
Directly and measurably, through two of the four inputs.
Bad data lengthens cycles because reps waste the first several touches reaching the wrong person or no person at all. And it lowers win rate, because deals that start with a low-authority contact require a re-entry later — and re-entered deals close worse than deals that started at the right altitude.
The mechanics of the leak:
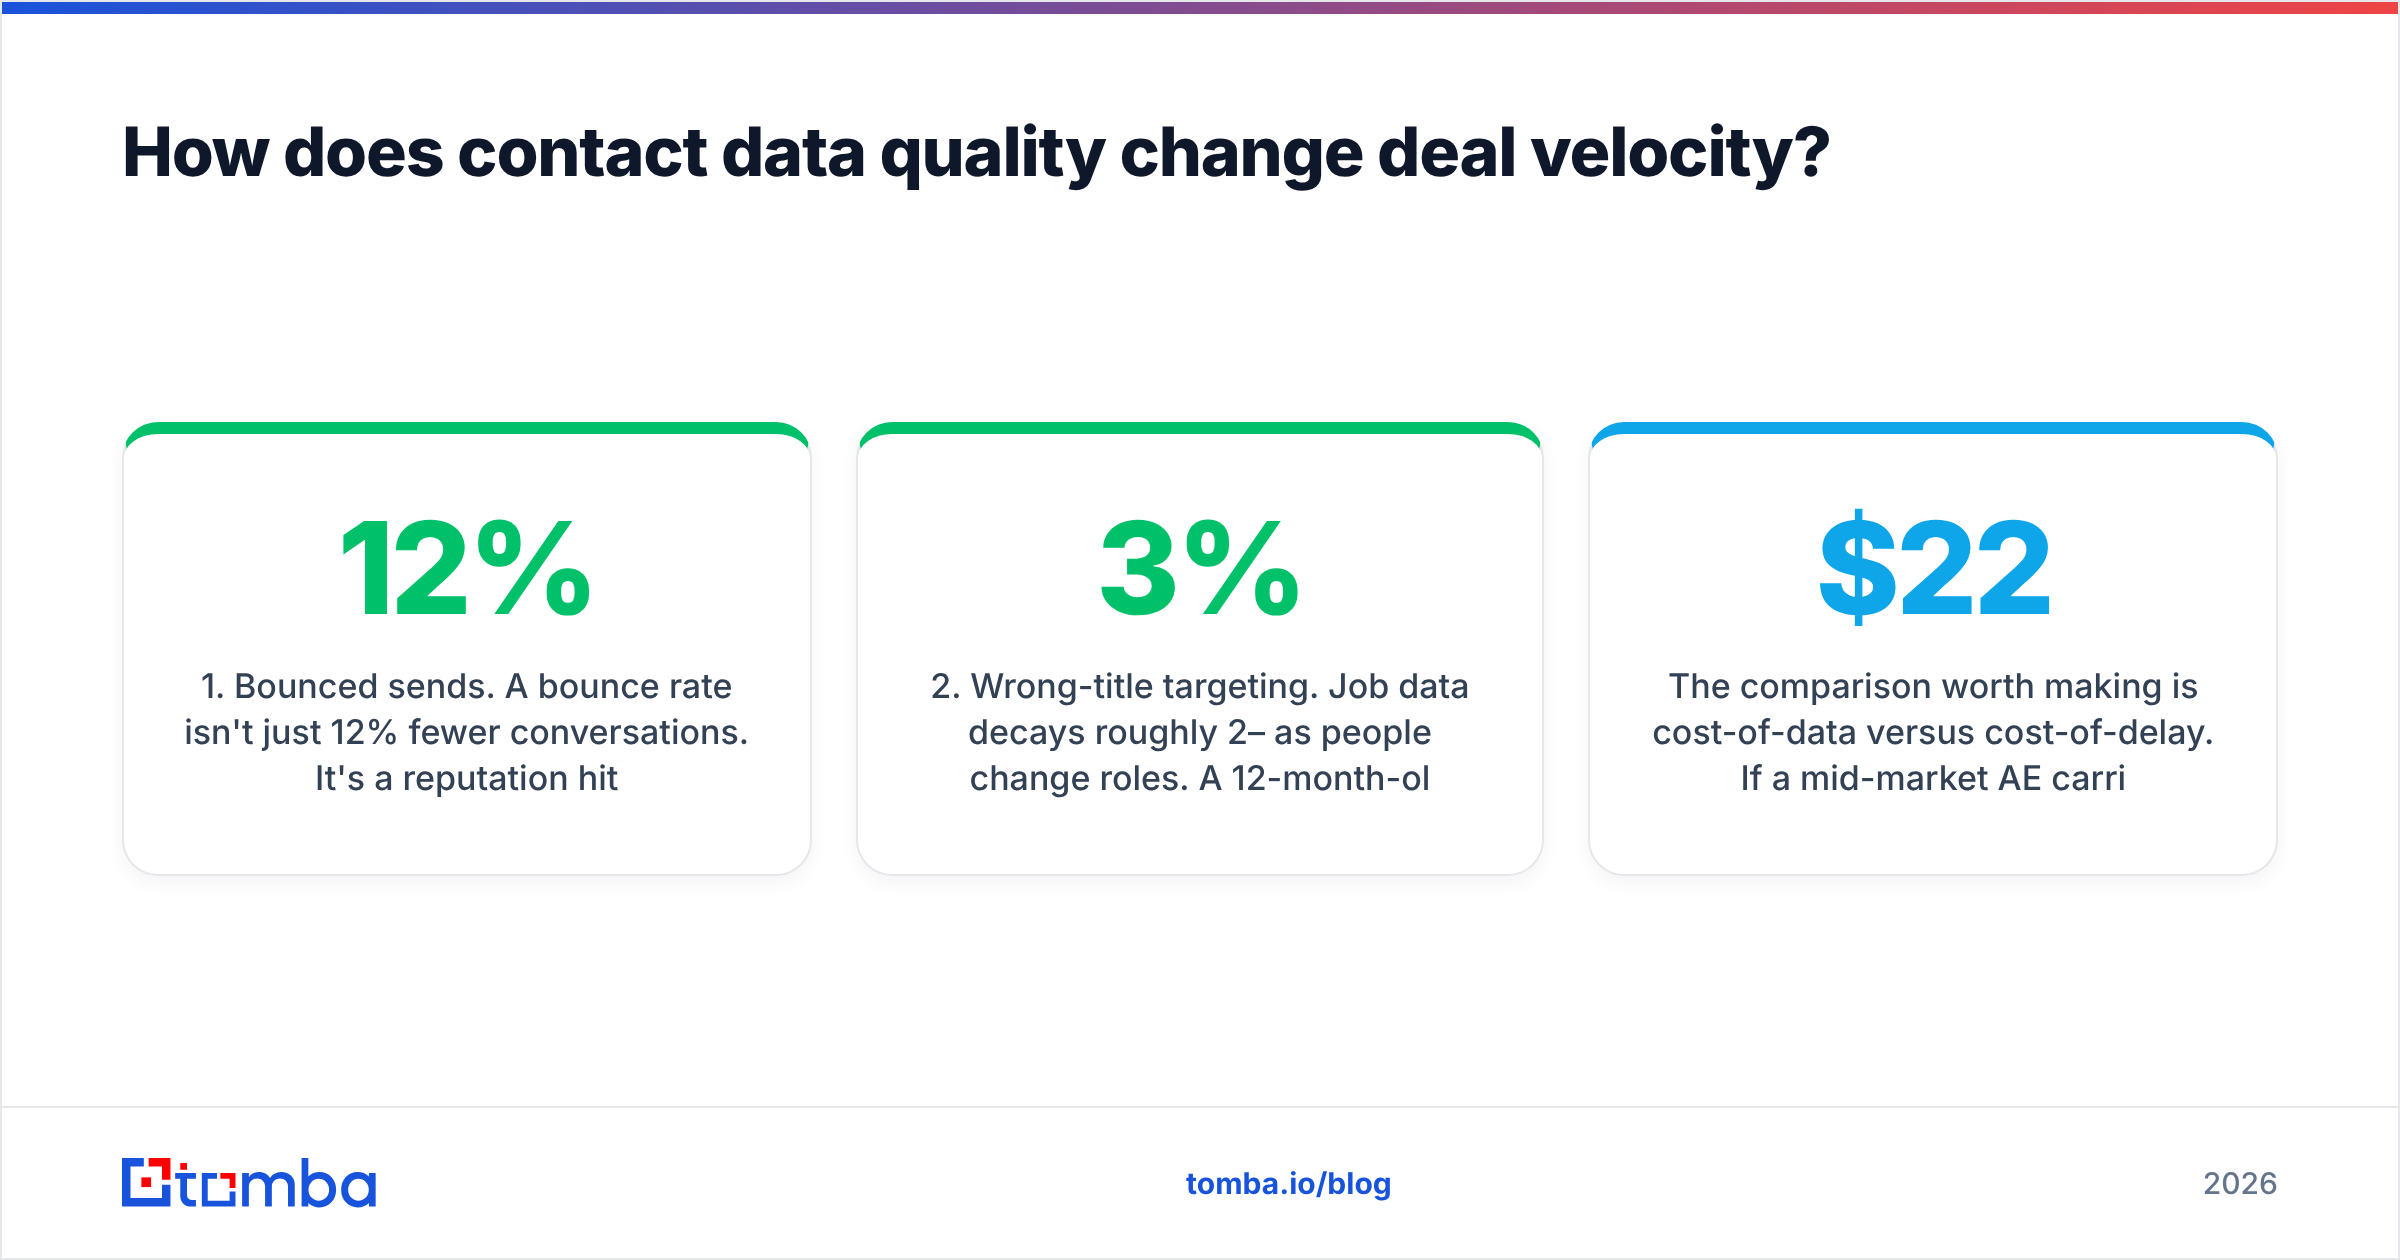
- Bounced sends. A 12% bounce rate isn't just 12% fewer conversations. It's a reputation hit that quietly suppresses inbox placement on the other 88%. Running lists through an email verifier before send is the cheapest fix in the entire outbound stack.
- Wrong-title targeting. Job data decays roughly 2–3% per month as people change roles. A 12-month-old list is meaningfully wrong. Re-enriching before a campaign — not after — prevents the wasted cycle.
- Missing decision-makers. If your record has one contact per account, you cannot multi-thread. Domain search that returns every reachable contact at a company turns a single-threaded deal into a three-threaded one before the first call.
- No phone coverage. Email-only sequences take longer to get a response than mixed email-plus-call sequences. Adding verified B2B phone numbers compresses time-to-first-conversation.
- Manual research time. Every hour a rep spends assembling a contact record is an hour not spent in conversation. Bulk enrichment moves that work off the rep's calendar entirely.

The comparison worth making is cost-of-data versus cost-of-delay. If a mid-market AE carries 25 opportunities at $22,000 average value with a 20% win rate, each day of cycle length is worth roughly $1,700 of velocity. A data tool that costs $99/month and removes four days of research friction pays for itself several times over in the first week. That math holds across most vendors in the category — BookYourData, Tomba, and the other established players in B2B contact data all clear that bar comfortably. The question isn't whether to pay for data; it's whether your data is fresh enough to shorten cycles rather than just fill CRM fields.
What does a 90-day velocity improvement plan look like?#
Concrete, sequenced, and narrow. Here's the plan that works most often:
Days 1–15: Instrument. Add stage-entry timestamps if you don't have them. Compute deal velocity for the last four quarters, segmented by deal size band. Identify which single input has degraded most.
Days 16–30: Fix the data floor. Verify your entire active prospect list. Re-enrich anything older than six months. Establish a standing rule that no sequence launches without verification — this alone typically removes 3–8 days of early-cycle waste.
Days 31–60: Attack the worst stage. You'll usually find one stage holding 40%+ of total cycle time. Common culprits: "demo scheduled → demo completed" (a scheduling problem, fix with direct booking links) and "proposal sent → negotiation" (a stakeholder problem, fix by multi-threading earlier).
Days 61–90: Tighten qualification. Add explicit exit criteria per stage. Deals that can't meet criteria get closed-lost fast. This raises win rate and shortens cycle length simultaneously, because dead deals stop inflating the average.
Measure at day 90, not weekly. Velocity moves slower than the metrics that feed it, and weekly reporting on a 64-day cycle produces noise that will send you chasing the wrong lever. For a deeper look at how process discipline compounds, HubSpot's sales pipeline research covers the stage-definition mechanics well.
One caution: don't chase velocity at the expense of deal quality. Velocity is a ratio, and ratios can be gamed. Aggressive discounting shortens cycles and raises win rates while destroying the average-deal-value input and your gross margin. If velocity is up but total revenue is flat, you've optimized the metric instead of the business.
What should you do next?#
Compute your baseline this week. Pull opportunity count, average deal value, win rate, and cycle length for the last completed quarter, segmented by deal size. Run the formula. Then look at which input is furthest from the benchmark ranges above and build one quarter's plan around that single number.
If your diagnosis lands on cycle length or opportunity count — and for most teams it does — the fastest structural fix is upstream of the sales process entirely: get accurate, current contact data into your reps' hands before they start working an account. Tomba's Email Finder finds verified professional email addresses by name, domain, or company, so reps reach the right decision-maker on the first attempt instead of the fourth. It starts free with 25 searches per month, and paid plans begin at $49/month — see full Tomba pricing for team volumes. Fix the data floor first; the velocity gains follow.
Related guides#
Ready to find emails that actually work?
Join 150,000+ professionals who stopped guessing and started sending. Free credits on signup — no credit card required.
Get the Tomba newsletter
Practical outbound tactics and product updates — once every two weeks.
About the author