Demand Generation Campaign: The 2026 Build-and-Measure Guide
Most demand generation campaigns die because they measure MQLs instead of pipeline. Here's the 2026 blueprint: channel mix, budget splits, real benchmarks, and the data layer that makes attribution honest.
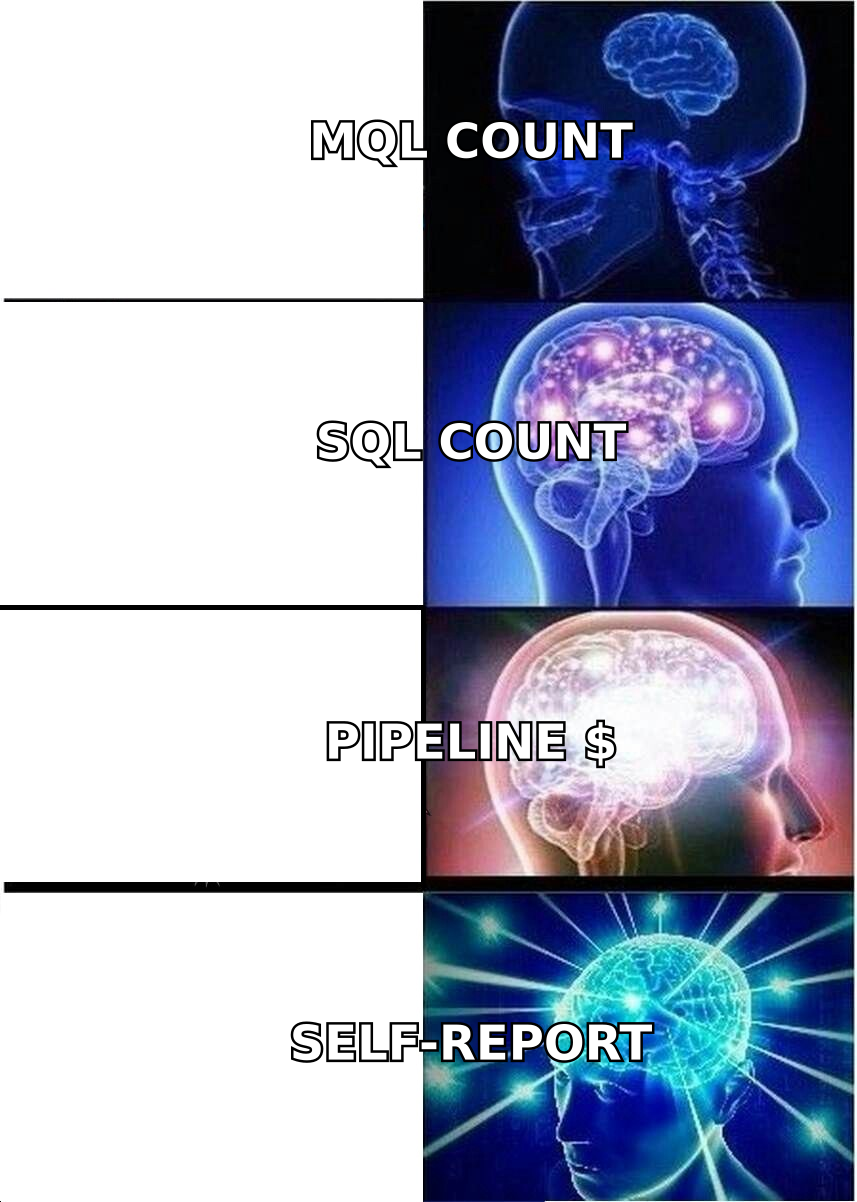
A demand generation campaign has one job: create buyers, not form fills. Most teams still grade it on MQL count. That is why the budget gets cut two quarters later. This guide covers how to plan, fund, and score a demand generation campaign in 2026 — channel mix, budget splits, benchmarks, and the data layer under all of it.
TL;DR
- A demand generation campaign creates and captures market demand. It is not a lead form with a bigger budget. The output metric is qualified pipeline.
- The 2026 split that works: about 60% of spend on demand creation (content, video, communities, podcasts) and 40% on demand capture (search, retargeting, review sites, outbound).
- Attribution breaks in a dark-social world. Add a "how did you hear about us?" field. Compare it against platform data. The gap is usually 30-50%.
- Outbound belongs inside the demand generation campaign, not in a silo. It only works on clean contact data. A 25% bounce rate poisons the domain your nurture emails need.
- Score every demand generation campaign on four things: cost per opportunity, pipeline velocity, win rate by source, and payback period. The rest is diagnostics.
What is a demand generation campaign, actually?#
A demand generation campaign is a coordinated, multi-channel program. It makes a defined audience aware of a problem. It convinces them you solve it. And it keeps you reachable when they are ready to buy.
Here is the everyday version. Lead generation is standing outside a restaurant, handing menus to whoever walks past. A demand generation campaign is making people hungry. You become the restaurant they already had in mind, with a table ready when they show up. Both matter. Only one of them scales.
Technically, a demand generation campaign does three jobs. Most teams collapse them into one.
- Demand creation — reaching people who do not know they have the problem yet. Podcasts, LinkedIn posts, YouTube, original research, community sponsorships. No form fills. No fast ROI. This is where 2026 budgets are quietly moving.
- Demand capture — meeting people who are already searching. Paid search, SEO, G2 and Capterra category pages, comparison content, retargeting. Cheap per conversion, but capped by market size.
- Demand conversion — turning interest into a sales conversation. Nurture sequences, outbound touches, webinars, free tools, product-led trials.
The common failure looks like this. You run only #2 and #3. Cost per lead climbs every quarter. You decide paid does not work anymore. Paid works fine. You have used up the small slice of buyers who are in-market right now — about 5%, per the Ehrenberg-Bass 95-5 rule made popular by LinkedIn's B2B Institute research.
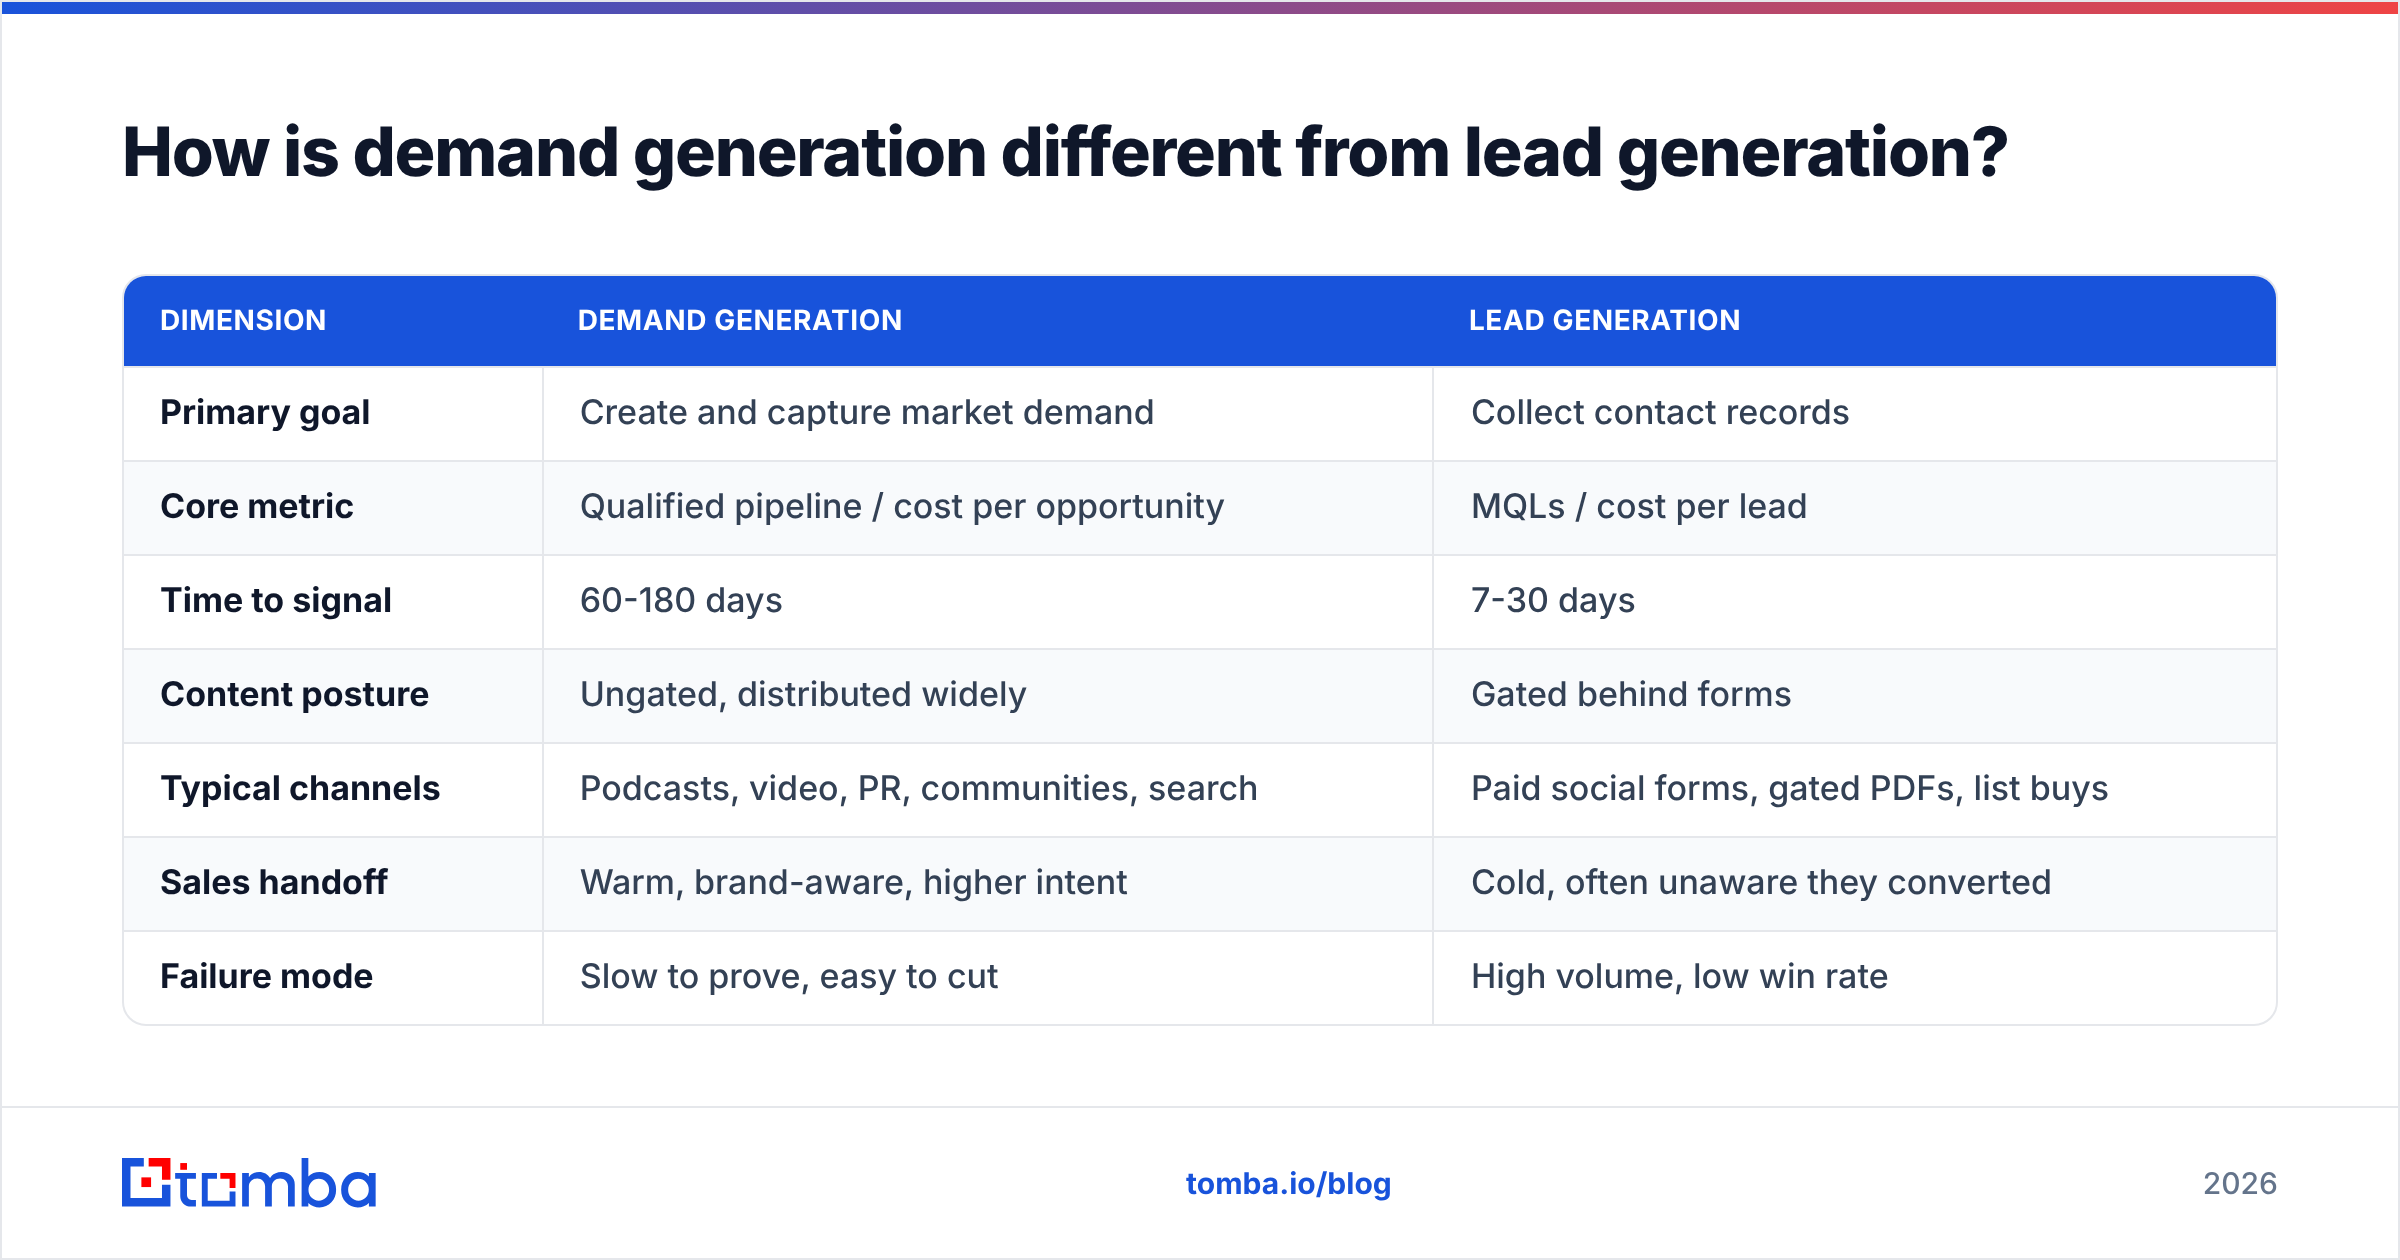
How is demand generation different from lead generation?#
They overlap. The operating model does not. Different metrics, different timelines, different failure modes.
| Dimension | Demand generation | Lead generation |
|---|---|---|
| Primary goal | Create and capture market demand | Collect contact records |
| Core metric | Qualified pipeline / cost per opportunity | MQLs / cost per lead |
| Time to signal | 60-180 days | 7-30 days |
| Content posture | Ungated, distributed widely | Gated behind forms |
| Typical channels | Podcasts, video, PR, communities, search | Paid social forms, gated PDFs, list buys |
| Sales handoff | Warm, brand-aware, higher intent | Cold, often unaware they converted |
| Failure mode | Slow to prove, easy to cut | High volume, low win rate |
| Budget defense | Hard (needs modeling) | Easy (looks efficient on a dashboard) |
Look at the last row. Lead gen is easier to defend in a board meeting, because the numbers arrive fast and look clean. A demand generation campaign wins on win rate and deal size. But you have to survive two quarters of ugly dashboards to prove it.
What does a 2026 demand generation campaign structure look like?#
Build the demand generation campaign in five layers. Skip one and the layers above it underperform.
- Audience definition — not "SaaS companies, 50-500 employees." That is a filter, not an audience. Define by situation: "RevOps leads at Series B SaaS firms consolidating three data vendors." Situations produce messages. Filters produce spray.
- Message and proof — one core claim per campaign, backed by proof a skeptic can check: a benchmark study, a customer teardown, a public calculator. If the claim is better deliverability, show an inbox placement chart.
- Creation surface — where you build awareness with no conversion target. Two or three surfaces, maximum. A weekly LinkedIn cadence plus a podcast run beats eight half-built channels.
- Capture surface — where intent converts. Comparison pages, product pages, a free tool, branded search, review sites. Paid money goes here.
- Data and routing layer — the dull part that decides whether the rest compounds. Enrichment, deduplication, verified data, routing rules, and a source field that survives the trip to your CRM.
Most post-mortems blame layer 3. The problem is usually layer 5. If 18% of your form fills go to the wrong owner or bounce on the first send, creative cannot save the demand generation campaign.
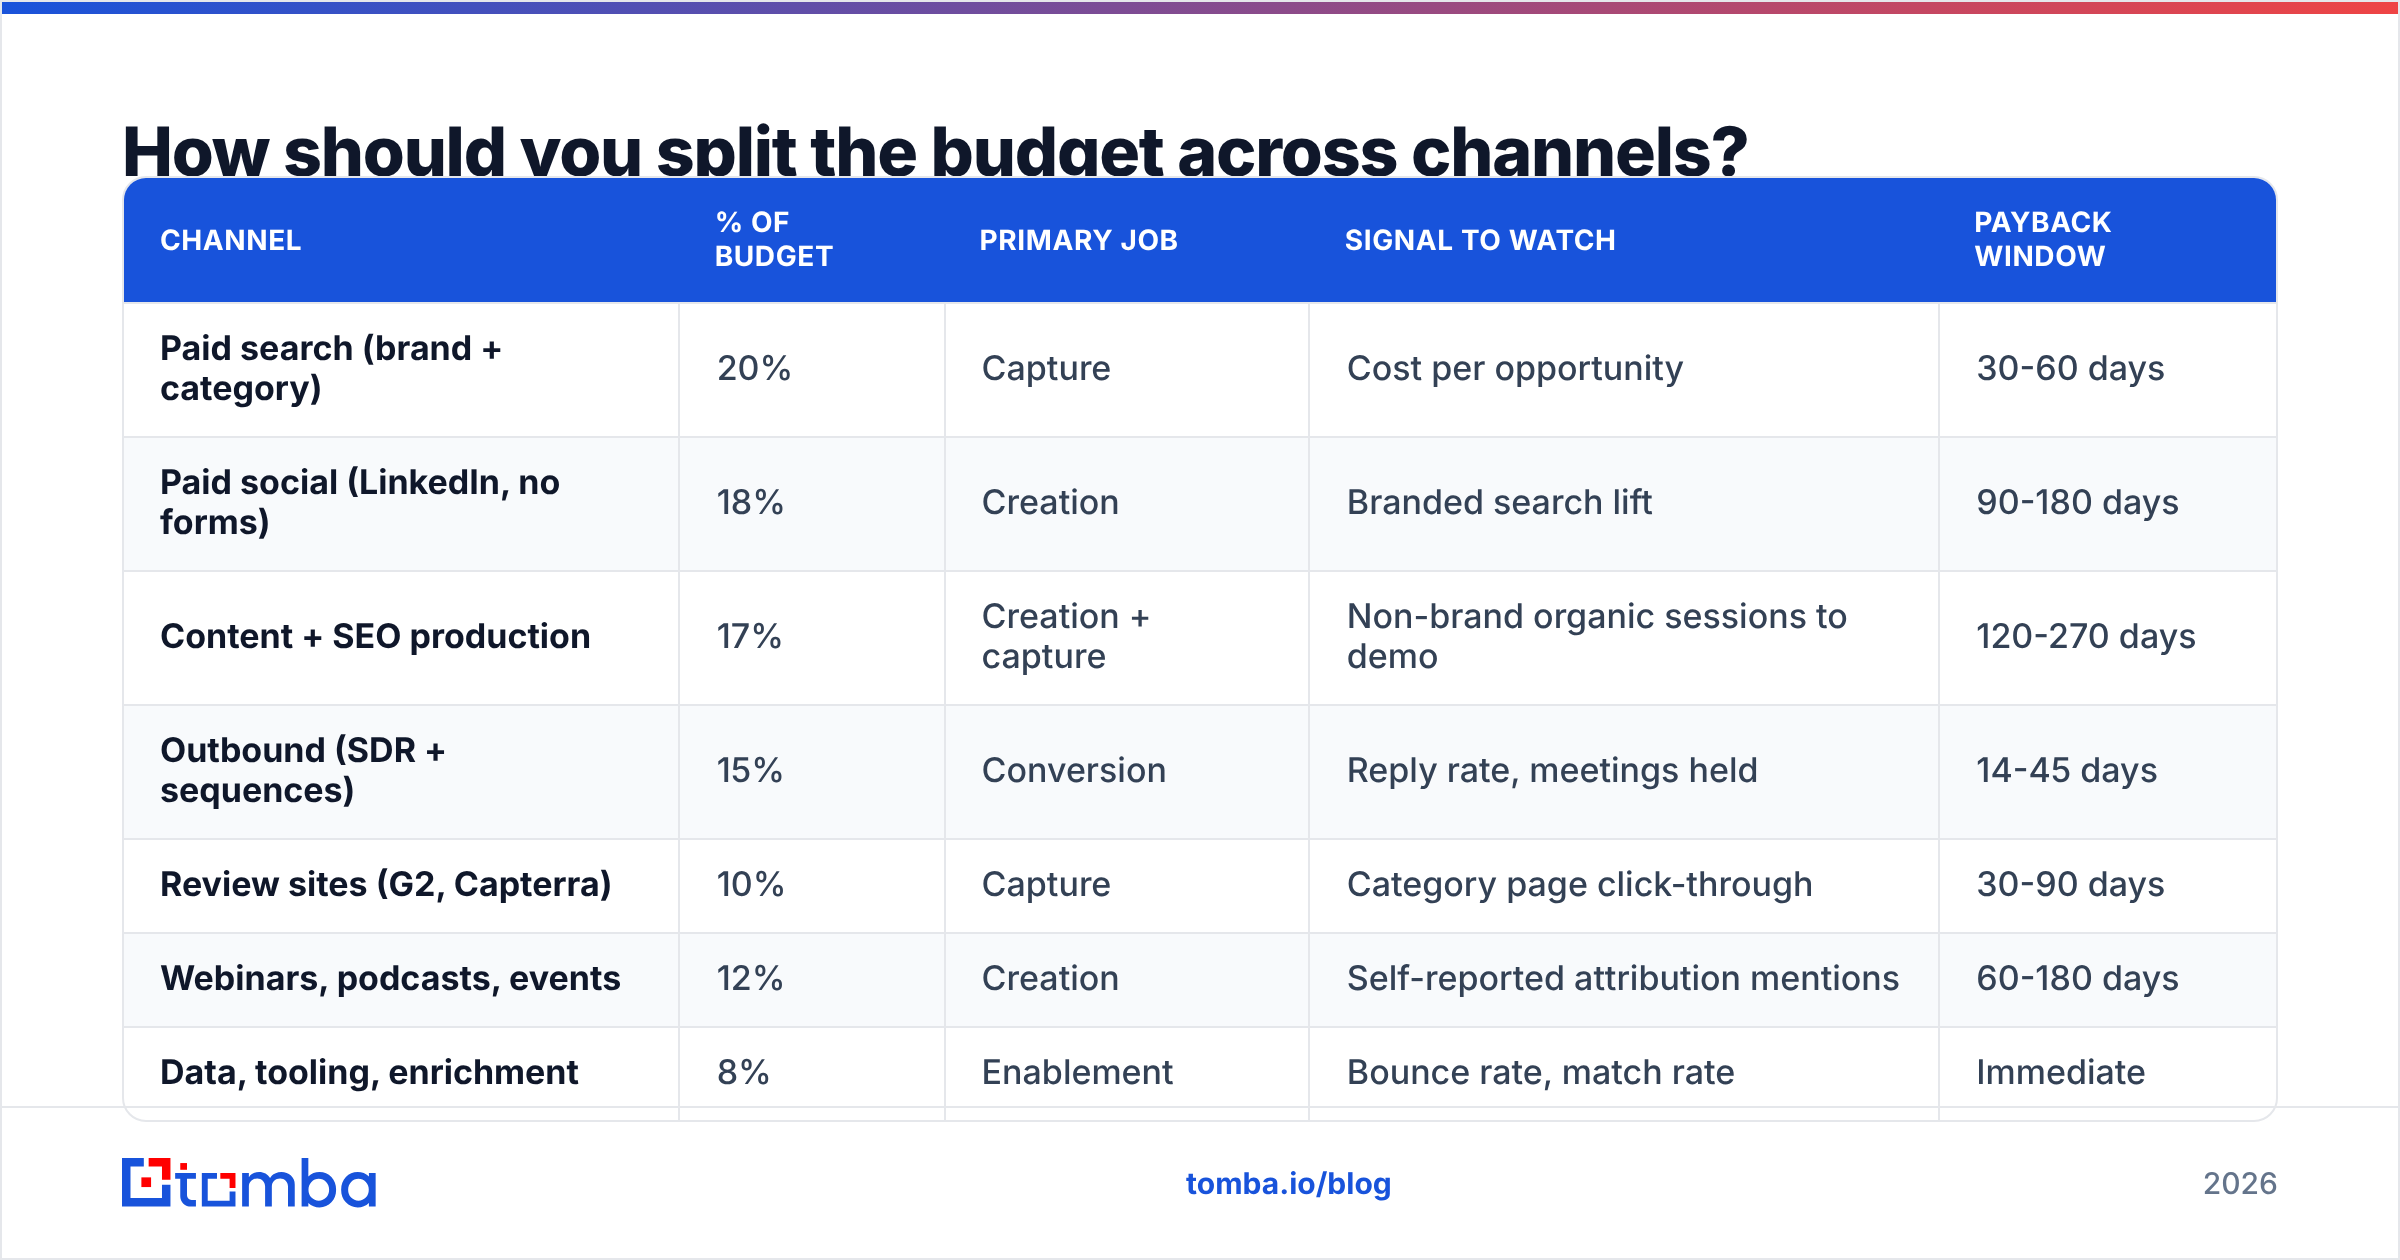
How should you split a demand generation campaign budget?#
Here is a working split for a mid-market B2B team. Assume $40k-$120k per quarter. Adjust for category maturity. If nobody searches for your category yet, shift more spend toward creation.
| Channel | % of budget | Primary job | Signal to watch | Payback window |
|---|---|---|---|---|
| Paid search (brand + category) | 20% | Capture | Cost per opportunity | 30-60 days |
| Paid social (LinkedIn, no forms) | 18% | Creation | Branded search lift | 90-180 days |
| Content + SEO production | 17% | Creation + capture | Non-brand organic sessions to demo | 120-270 days |
| Outbound (SDR + sequences) | 15% | Conversion | Reply rate, meetings held | 14-45 days |
| Review sites (G2, Capterra) | 10% | Capture | Category page click-through | 30-90 days |
| Webinars, podcasts, events | 12% | Creation | Self-reported attribution mentions | 60-180 days |
| Data, tooling, enrichment | 8% | Enablement | Bounce rate, match rate | Immediate |
Two notes on that last row. First, 8% for data and tooling sounds high until you price a bad list. At a 22% bounce rate on a 10,000-contact sequence, you burn 2,200 sends. You also take a real hit to sender reputation, and every legitimate contact behind them is more likely to land in spam.
Second, this is the layer teams cut first when budgets tighten. That is backwards. It is the multiplier on the other 92% of the demand generation campaign.
Which channels actually produce pipeline in 2026?#
Three shifts are worth planning around.
Gated content is a declining asset. The trade — your email for a PDF — returns worse data than it did five years ago. Buyers have learned to type test@test.com. The teams still winning gate utility: calculators, benchmark tools, templates. They stop gating information, such as a 12-page PDF that restates a blog post.
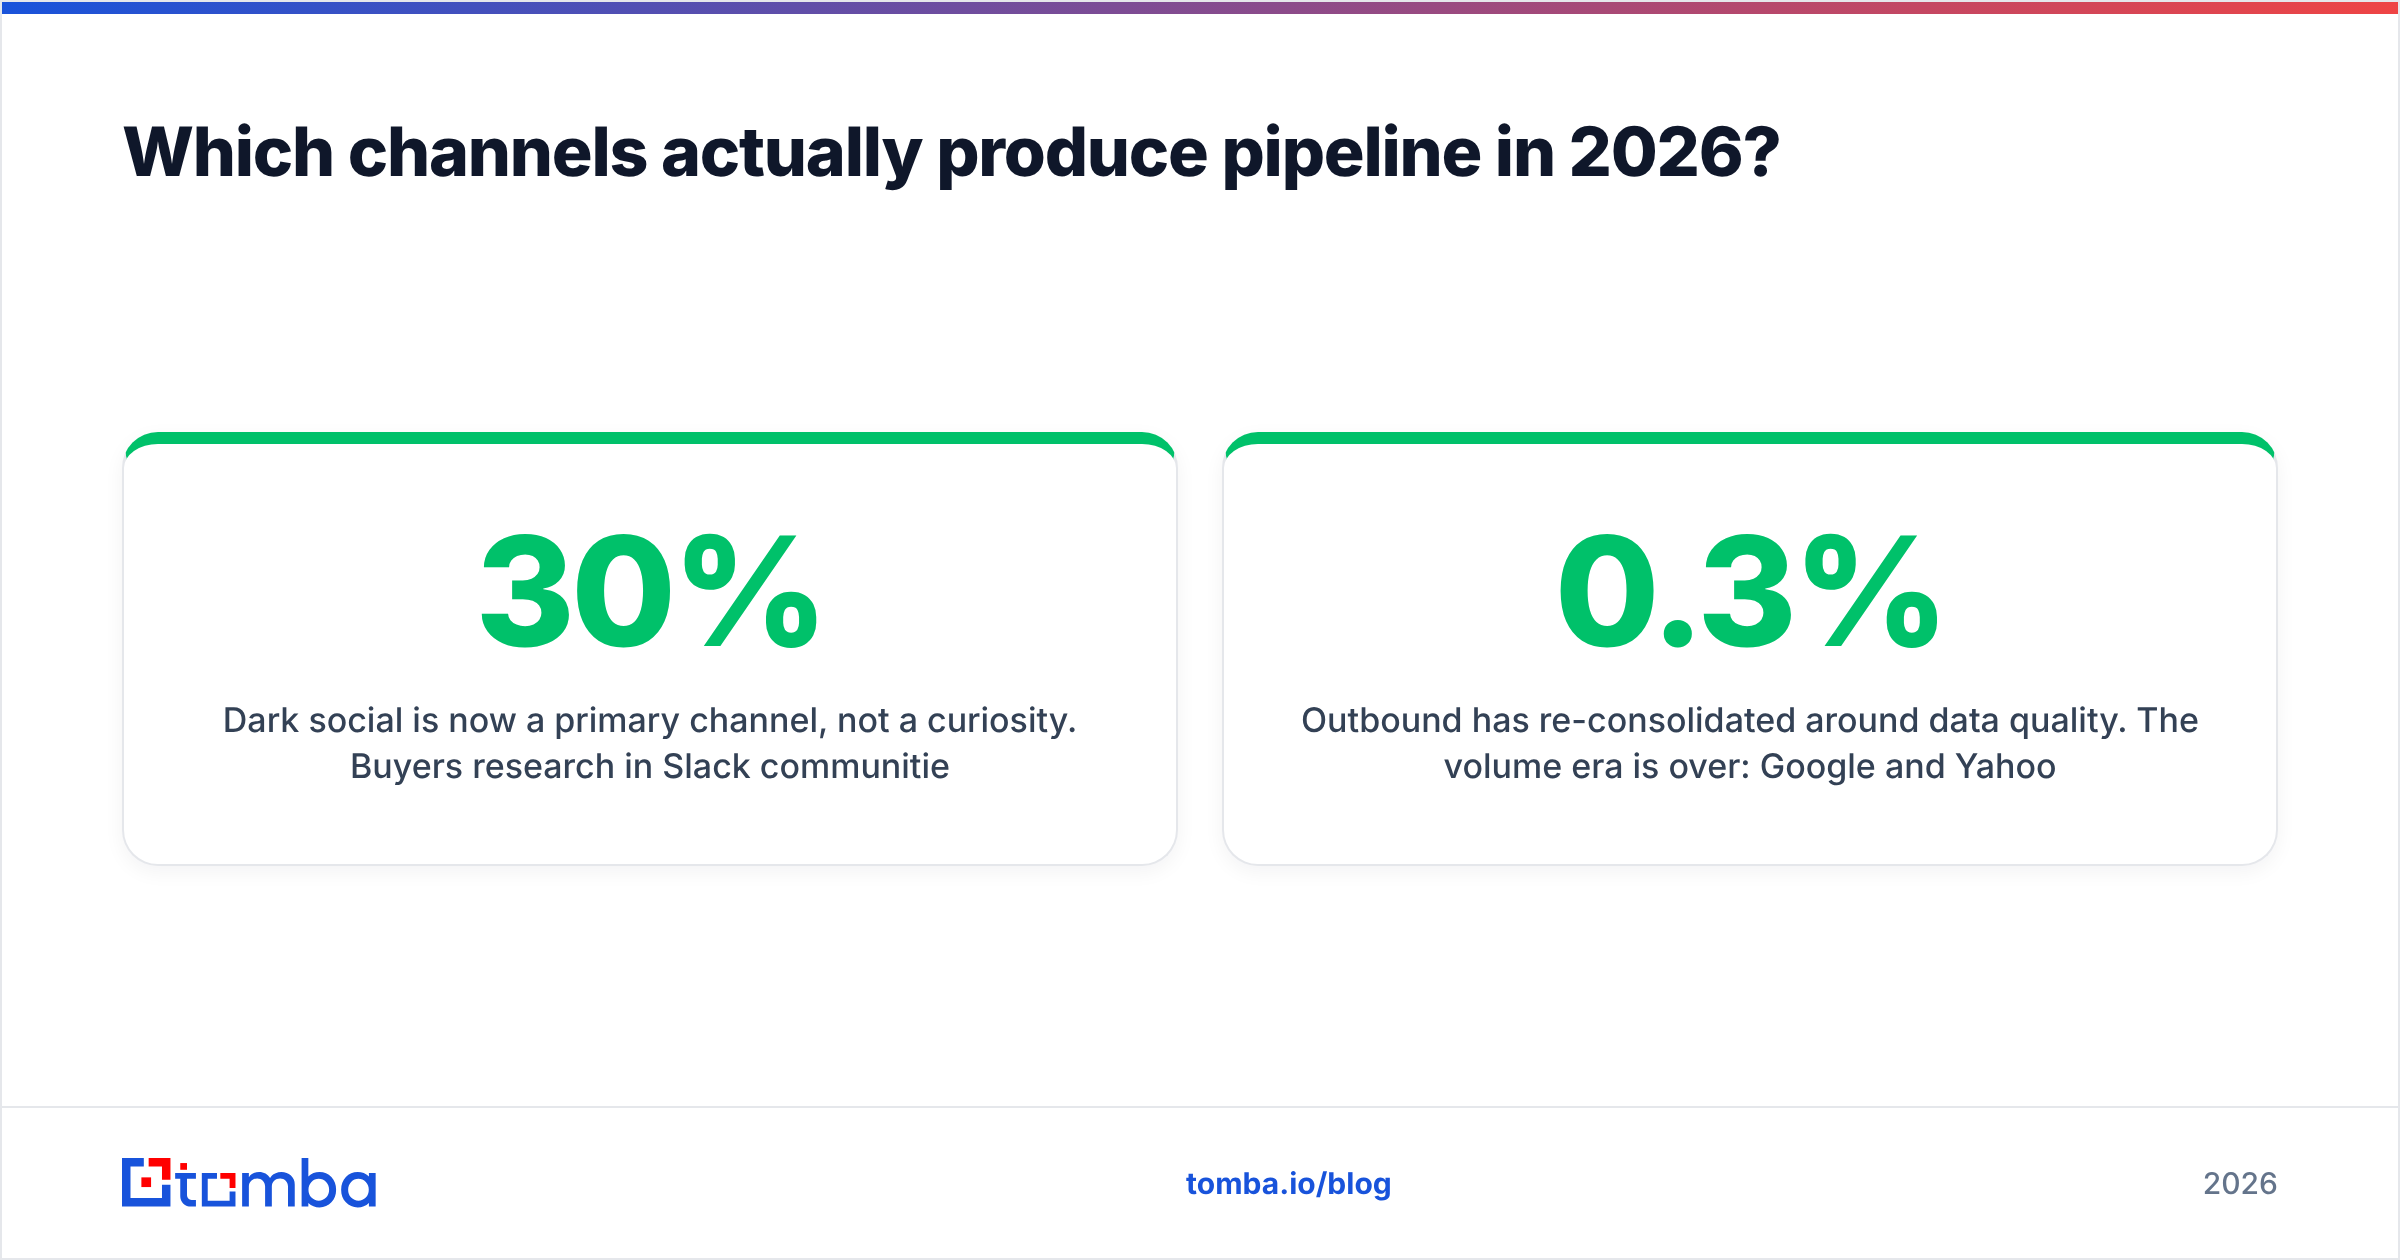
Dark social is now a primary channel. Buyers research in Slack groups, LinkedIn comment threads, private Discords, and podcast episodes. None of that shows up in Google Analytics. Say your self-reported field shows "a friend recommended you" at 30%, while platform data shows 5%. That gap is not noise. That is your demand generation campaign working, uninstrumented.
Outbound now runs on data quality. The volume era is over. Google and Yahoo bulk sender rules, plus stricter Microsoft filtering, mean a sloppy list gets filtered before anyone reads your copy. Teams still booking meetings send less and verify more. Running every contact through an email verifier is table stakes now. Google's Gmail bulk sender guidelines put the spam complaint limit at 0.3%. You cannot hit that with an unverified list.

How do you measure a demand generation campaign honestly?#
Pick four KPIs. Treat everything else as a diagnostic you check when a KPI moves.
The four:
- Cost per opportunity (CPO) — campaign spend divided by sales-accepted opportunities. Not cost per lead. CPO compares channels on the axis that matters.
- Win rate by source — the number that exposes MQL theater. 400 leads at a 3% win rate lose to 60 leads at 22%, every time.
- Pipeline velocity — (opportunities × average deal size × win rate) ÷ average sales cycle. It tells you whether the demand generation campaign speeds the business up or just adds volume.
- CAC payback period — months to earn back acquisition cost from gross profit. Under 12 months is healthy for B2B SaaS. Over 18, you fund growth from the balance sheet.
The instrumentation that keeps those numbers honest:
- Add a self-reported attribution field. One question on the demo form: "How did you first hear about us?" It is biased toward recency. It still beats last-touch. Reconcile it with platform data each quarter.
- Hold-out tests beat models. Turn a channel off in one region for six weeks. Watch what pipeline does. Geo hold-outs are the closest thing marketing has to causal proof.
- Instrument the handoff, not just the click. Track meeting-held rate and opportunity-created rate by source in your CRM. Most attribution fights are routing fights in disguise.
- Report on a lag. A January launch with a 90-day sales cycle cannot be judged in February. Set the review date at launch. Then refuse to judge it early.
On the modeling side, read Gartner's demand generation research and HubSpot's State of Marketing benchmarks against your own numbers. Do not adopt either wholesale.
What benchmarks should a demand generation campaign hit?#
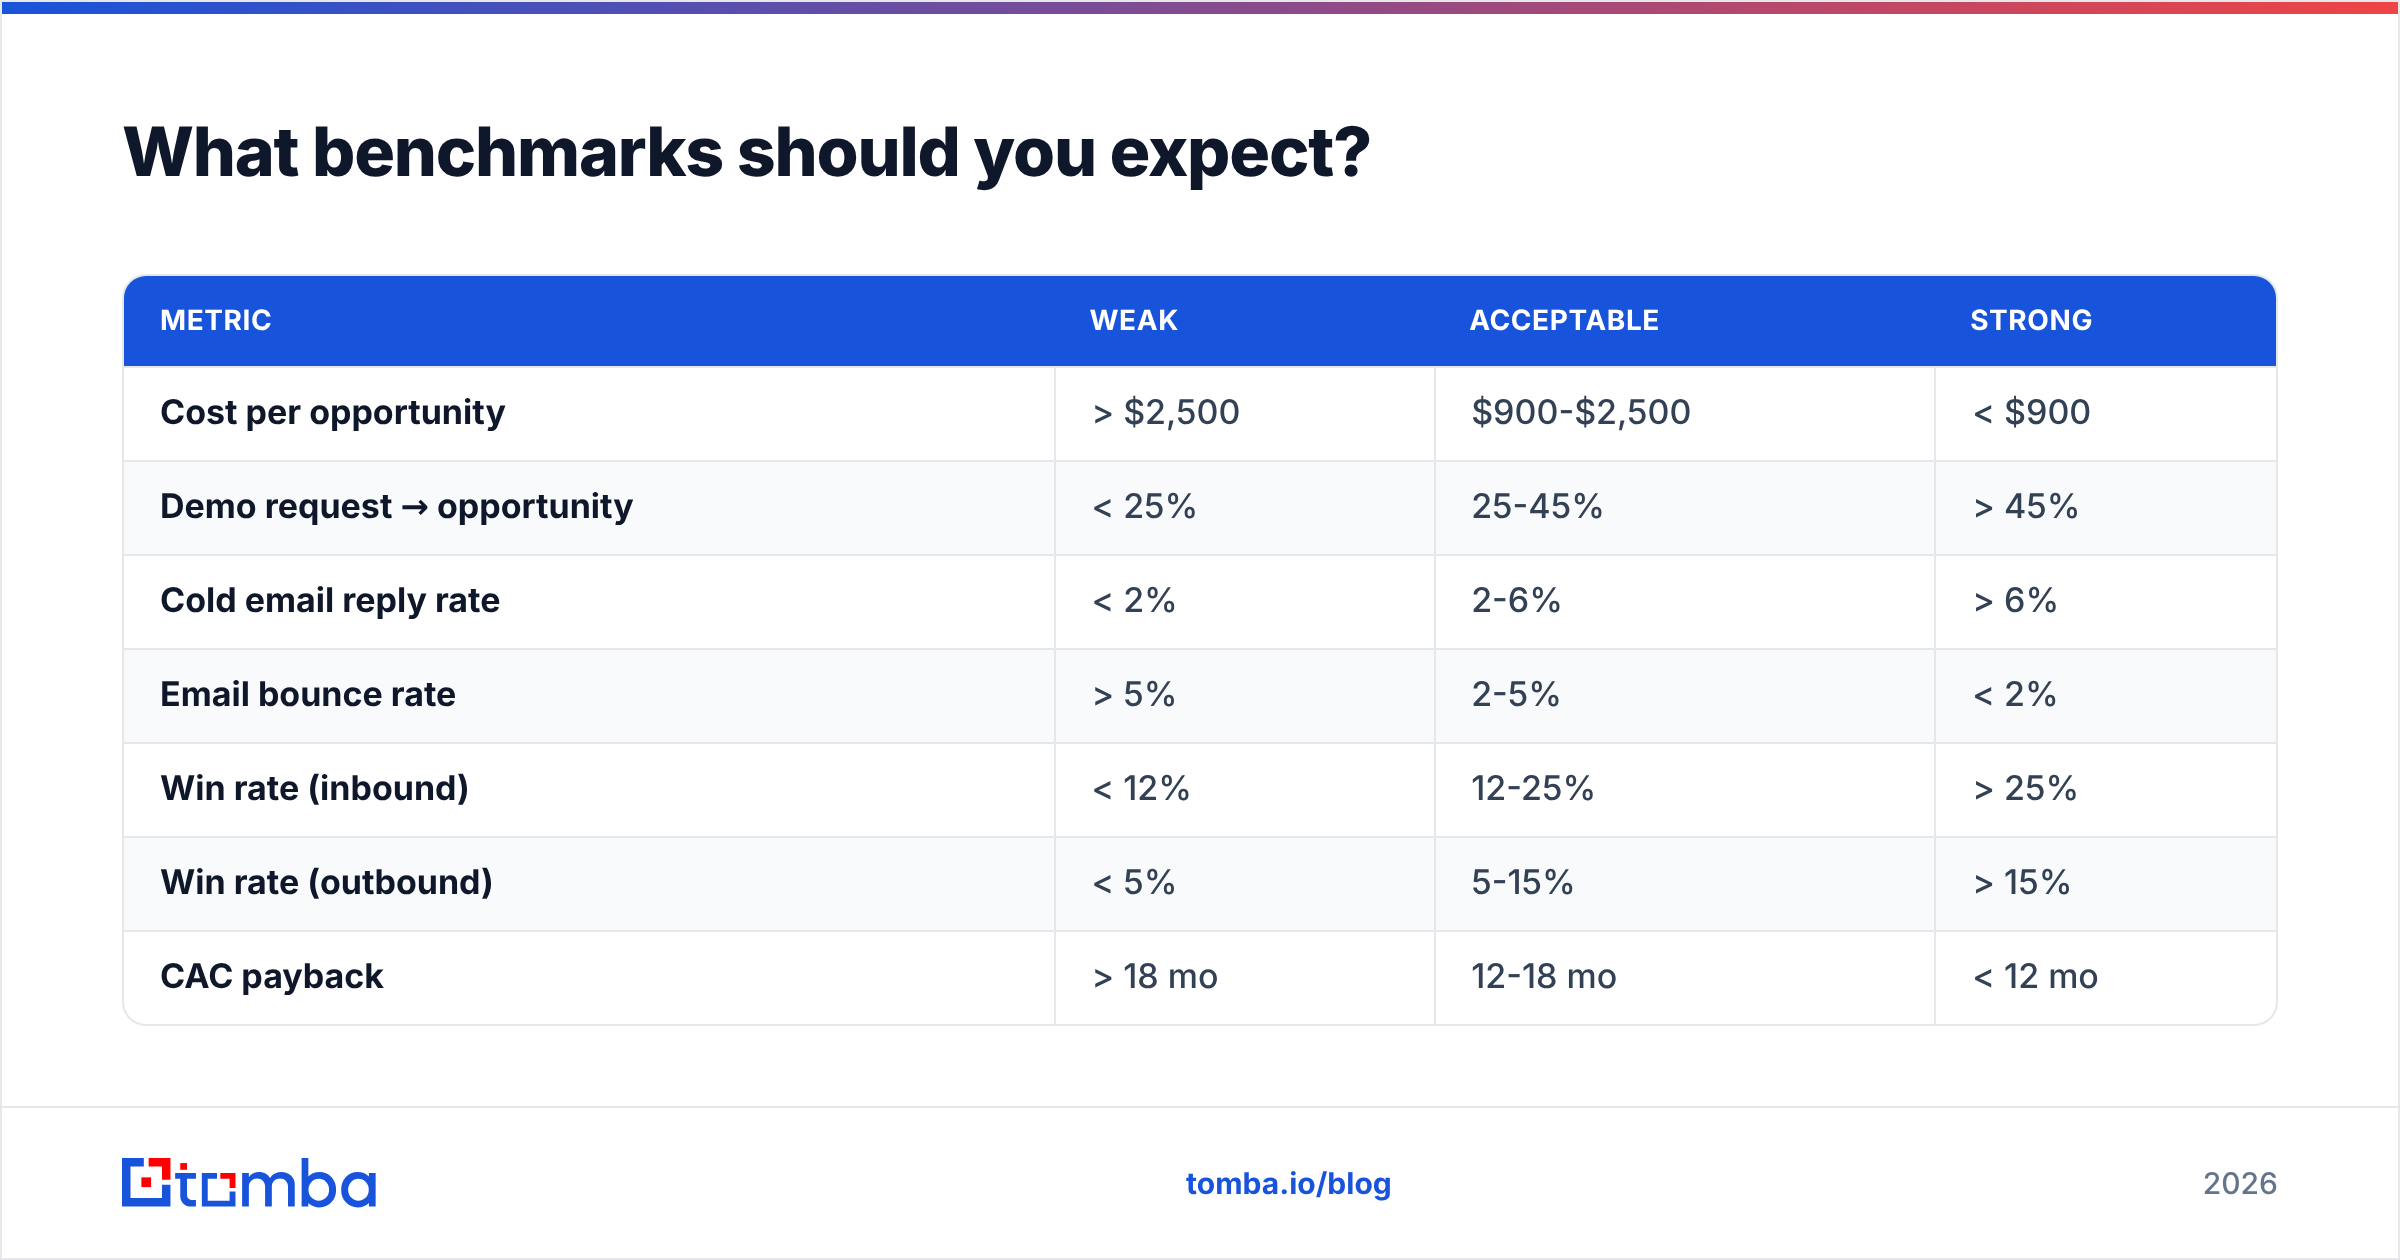
Treat these as directional ranges for mid-market B2B, not targets. Category maturity, ACV, and sales cycle all move them.
| Metric | Weak | Acceptable | Strong |
|---|---|---|---|
| Cost per opportunity | > $2,500 | $900-$2,500 | < $900 |
| Demo request → opportunity | < 25% | 25-45% | > 45% |
| Cold email reply rate | < 2% | 2-6% | > 6% |
| Email bounce rate | > 5% | 2-5% | < 2% |
| Win rate (inbound) | < 12% | 12-25% | > 25% |
| Win rate (outbound) | < 5% | 5-15% | > 15% |
| CAC payback | > 18 mo | 12-18 mo | < 12 mo |
| Self-reported vs tracked attribution gap | > 60% | 25-60% | < 25% |
That last row deserves attention. A small gap does not mean your tracking is perfect. It often means demand creation is weak, so everything really does come from trackable capture channels. A moderate gap is the healthy state for a brand building awareness.
How do you build the contact data layer behind a demand generation campaign?#
Every layer above runs on contact records. Here is the sequence that keeps them clean. It also keeps your ops person from becoming a full-time data janitor.
Step 1 — Define the target account list first. Use firmographic filters plus a trigger: a funding round, a new hire in a relevant role, a tech stack change. A 400-account list you can personalize beats a 40,000-account list you can only blast.
Step 2 — Find contacts at those accounts. Working account-first keeps the list tied to your ICP. A domain search across your target accounts returns the people and email patterns at each company. That is a different exercise from filtering a huge static database and hoping the fit is right.
Step 3 — Verify before anything sends. Every address, every time, including ones from a "verified" vendor. Verification decays, because roughly 20% of people change jobs each year. Watch catch-all domains. They accept everything at the SMTP layer and tell you nothing, which is why a catch-all verifier is a separate step.
Step 4 — Enrich for segmentation, not vanity fields. You need enough to personalize the first line and route the record. Job title, seniority, company size, and tech stack usually do it. Data enrichment that fills 40 fields you never read is overhead, not intelligence.
Step 5 — Deduplicate and re-verify on a schedule. Quarterly for active segments. Monthly for high-velocity outbound lists.
On vendor choice, different tools win at different jobs. Broad databases like Apollo or ZoomInfo are strong when you want volume and filter breadth. Verified-data specialists such as BookYourData fit when you want a bought list with a stated accuracy guarantee and no verification pipeline of your own.
API-first finders like Tomba fit when you enrich accounts you have already picked and prefer per-lookup pricing over seat-based contracts. Match the tool to the job. Running all three for the same task is how data budgets balloon.
What kills most demand generation campaigns?#
In rough order of frequency:
- Judging too early. A 90-day cycle campaign killed on day 45 because CPL looked bad. CPL was never the metric.
- Too many channels, none at depth. Five channels at 20% effort compound nothing. Two at full effort build a brand.
- Copy written for the wrong buying stage. Bottom-funnel copy in a top-funnel placement converts at nothing. Then you decide the channel does not work.
- No shared definition of "qualified." Write it down in one sentence, with a named owner. Revisit it each quarter.
- Dirty data degrading everything downstream. Bounces hurt email deliverability. Weak deliverability suppresses nurture. Then content looks broken and gets cut. Content was never the cause.
- No creative refresh cadence. Paid social creative fatigues in 4-6 weeks on a tight audience. Budget the refresh at launch.
Start your demand generation campaign with the data layer#
The structure in this guide is portable. You can run it with almost any channel mix. The contact data underneath is not portable. That is the layer where most demand generation campaigns lose 20-30% of spend to bounces, bad routing, and stale records.
Building a target account list for your next demand generation campaign? Start there. The Tomba Email Finder finds professional email addresses by domain, name, or company. Verification runs in the same workflow, so contacts arrive campaign-ready instead of needing a cleanup pass. The free tier includes 25 searches a month, so you can test accuracy on accounts you already know. Paid plans start at $49/mo — see Tomba pricing for the full breakdown. Run your current list through it first. The overlap rate tells you more about your data vendor than any benchmark table will.
Related guides#
Ready to find emails that actually work?
Join 150,000+ professionals who stopped guessing and started sending. Free credits on signup — no credit card required.
Get the Tomba newsletter
Practical outbound tactics and product updates — once every two weeks.
About the author