Demand Generation Funnel Metrics: The 2026 Measurement Guide
Most demand gen dashboards track activity, not revenue. Here are the nine funnel metrics that actually forecast pipeline in 2026, how to calculate each one, realistic benchmarks by stage, and the data problems that quietly break all of them.
TL;DR
- Most demand generation dashboards measure activity (MQLs, form fills, impressions) instead of conversion economics — which is why they look green in a quarter where pipeline dies.
- Nine metrics carry almost all the signal: stage-to-stage conversion rate, velocity by stage, pipeline coverage, cost per opportunity, CAC payback, win rate by source, contact-to-account ratio, source-level pipeline contribution, and data decay rate.
- Benchmarks only matter relative to your own trailing four quarters. A 3% visitor-to-lead rate is excellent for enterprise ACVs and terrible for PLG.
- Bad contact data silently corrupts every downstream number. If 22% of your emails bounce, your "MQL → SQL rate" is measuring your database, not your demand.
- Fix attribution last. Fix stage definitions and data hygiene first — they cost nothing and explain more variance.
What is a demand generation funnel, and what should it actually measure?#
A demand generation funnel is the sequence of measurable states a buying account passes through, from first anonymous touch to closed revenue. The key word is states, not steps — a real buyer moves back and forth, disappears for 90 days, and returns with three new stakeholders.
Think of it like an airport. You don't measure an airport's health by counting people who walk through the front doors. You measure how many make it through security, how long each queue takes, and how many miss their flight at each checkpoint. The doors are vanity. The queues are operations.
Here's the stage model most B2B teams should standardize on before touching a single dashboard:
- Known contact — you have a verified work email and a company. Not "a lead," not "a record." Verified, or it doesn't count.
- Engaged contact — two or more meaningful interactions inside a 30-day window (content download plus pricing-page visit, not two newsletter opens).
- Marketing-qualified account (MQA) — three or more engaged contacts at the same account, or one engaged contact matching your ICP firmographics plus an intent signal. Account-level, not person-level.
- Sales-accepted opportunity (SAO) — a rep has held a discovery call and confirmed budget, need, and timeline are plausible. This is your first hard gate.
- Qualified pipeline — an opportunity with a stated amount, a close date inside two quarters, and a documented next step.
- Closed-won revenue — signed, with ACV and contract term recorded so cohort math works later.
Notice what's missing: MQL. The marketing qualified lead still exists in most CRMs, but in 2026 the useful unit of measurement is the account, not the individual. Buying committees average six to ten people, and scoring them one at a time produces a funnel that looks full while no single account is actually progressing.
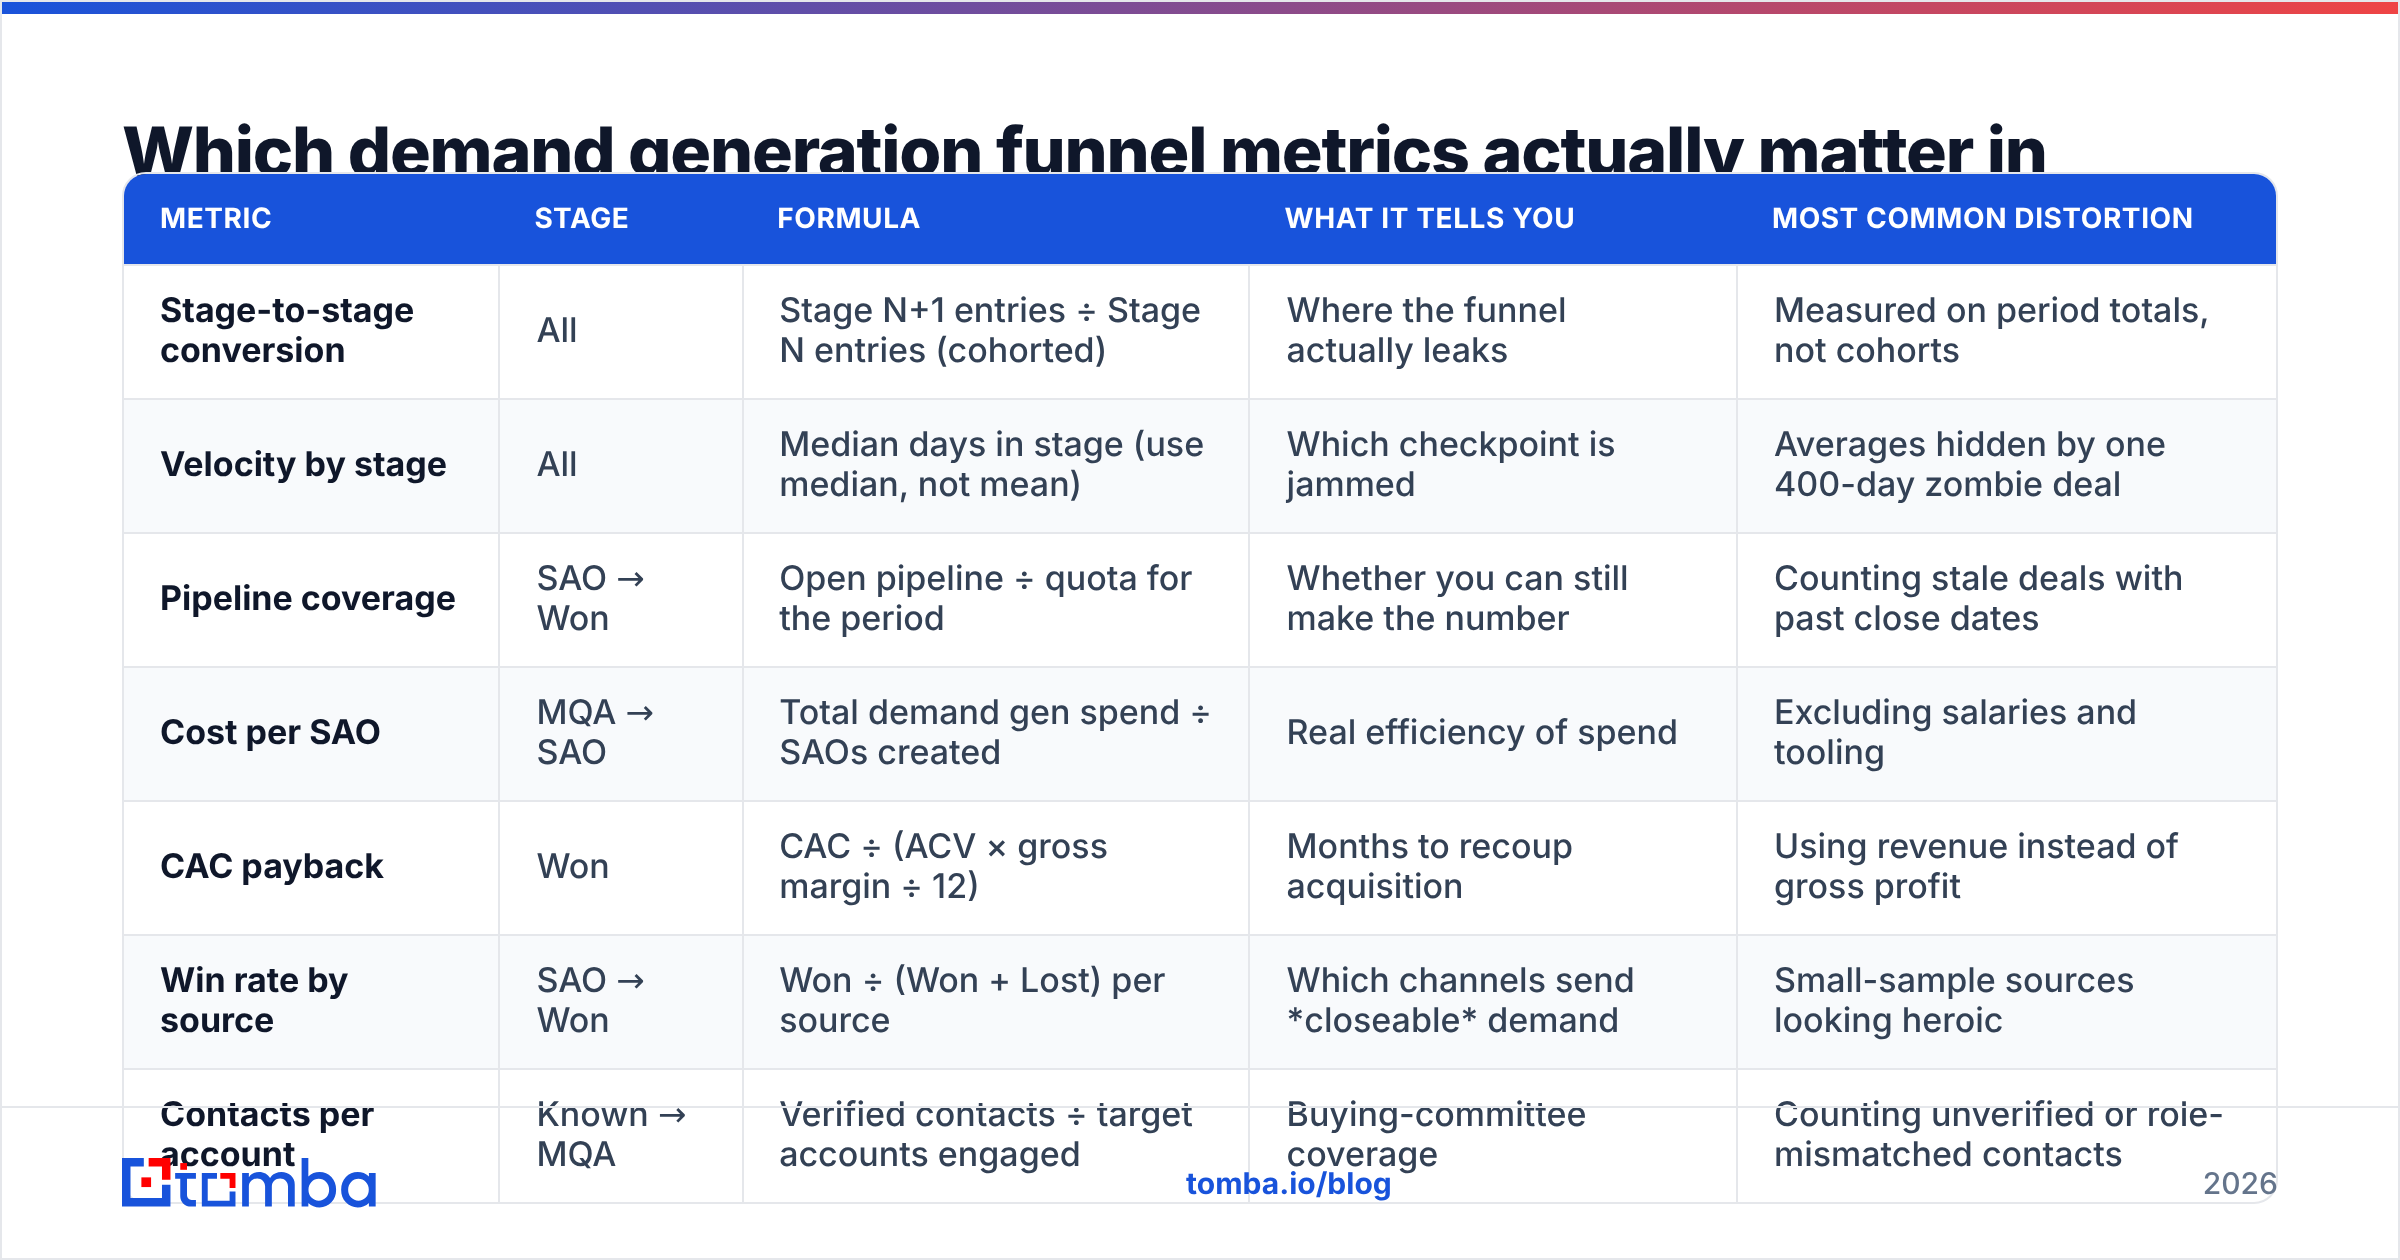
Which demand generation funnel metrics actually matter in 2026?#
Nine. Everything else is a diagnostic you pull when one of these nine moves.
| Metric | Stage | Formula | What it tells you | Most common distortion |
|---|---|---|---|---|
| Stage-to-stage conversion | All | Stage N+1 entries ÷ Stage N entries (cohorted) | Where the funnel actually leaks | Measured on period totals, not cohorts |
| Velocity by stage | All | Median days in stage (use median, not mean) | Which checkpoint is jammed | Averages hidden by one 400-day zombie deal |
| Pipeline coverage | SAO → Won | Open pipeline ÷ quota for the period | Whether you can still make the number | Counting stale deals with past close dates |
| Cost per SAO | MQA → SAO | Total demand gen spend ÷ SAOs created | Real efficiency of spend | Excluding salaries and tooling |
| CAC payback | Won | CAC ÷ (ACV × gross margin ÷ 12) | Months to recoup acquisition | Using revenue instead of gross profit |
| Win rate by source | SAO → Won | Won ÷ (Won + Lost) per source | Which channels send closeable demand | Small-sample sources looking heroic |
| Contacts per account | Known → MQA | Verified contacts ÷ target accounts engaged | Buying-committee coverage | Counting unverified or role-mismatched contacts |
| Source pipeline contribution | All | Pipeline $ per source ÷ total pipeline $ | Budget reallocation input | Last-touch attribution inflating brand search |
| Data decay rate | Known contact | Contacts invalidated per quarter ÷ total contacts | How fast your database rots | Never measured at all |
The last one is the metric almost nobody tracks and everybody suffers from. B2B contact data decays roughly 2–3% per month through job changes, domain migrations, and departures — which compounds to about a quarter of your database per year. If you're not measuring it, your funnel math is built on sand.
How do you calculate stage conversion without fooling yourself?#
Cohort it, or don't bother.
The mistake is dividing this month's SAOs by this month's MQAs. Those are different populations. An MQA created on March 28th cannot possibly become an SAO by March 31st, so March looks bad and April looks miraculous. Neither number is real.
The correct method:
- Fix the cohort by entry date. Take every MQA created in January. Follow that specific set forward.
- Set a measurement window equal to 1.5× median stage velocity. If MQA → SAO takes a median of 18 days, measure at 27 days. Anything longer is a straggler, not a trend.
- Report the number with its sample size. "31% (n=94)" is a metric. "31%" is a rumor.
- Recompute trailing four quarters every month. Single-period conversion rates on B2B volumes are mostly noise.
- Segment by ICP fit before you segment by channel. Channel differences usually turn out to be ICP-mix differences in disguise.
One more discipline: separate new business from expansion funnels completely. Expansion converts two to four times better and will drag your blended rate somewhere that describes neither motion. Forrester and Gartner have both been pushing this account-and-motion-level split for years, and it's the single highest-leverage change most reporting stacks can make in an afternoon.
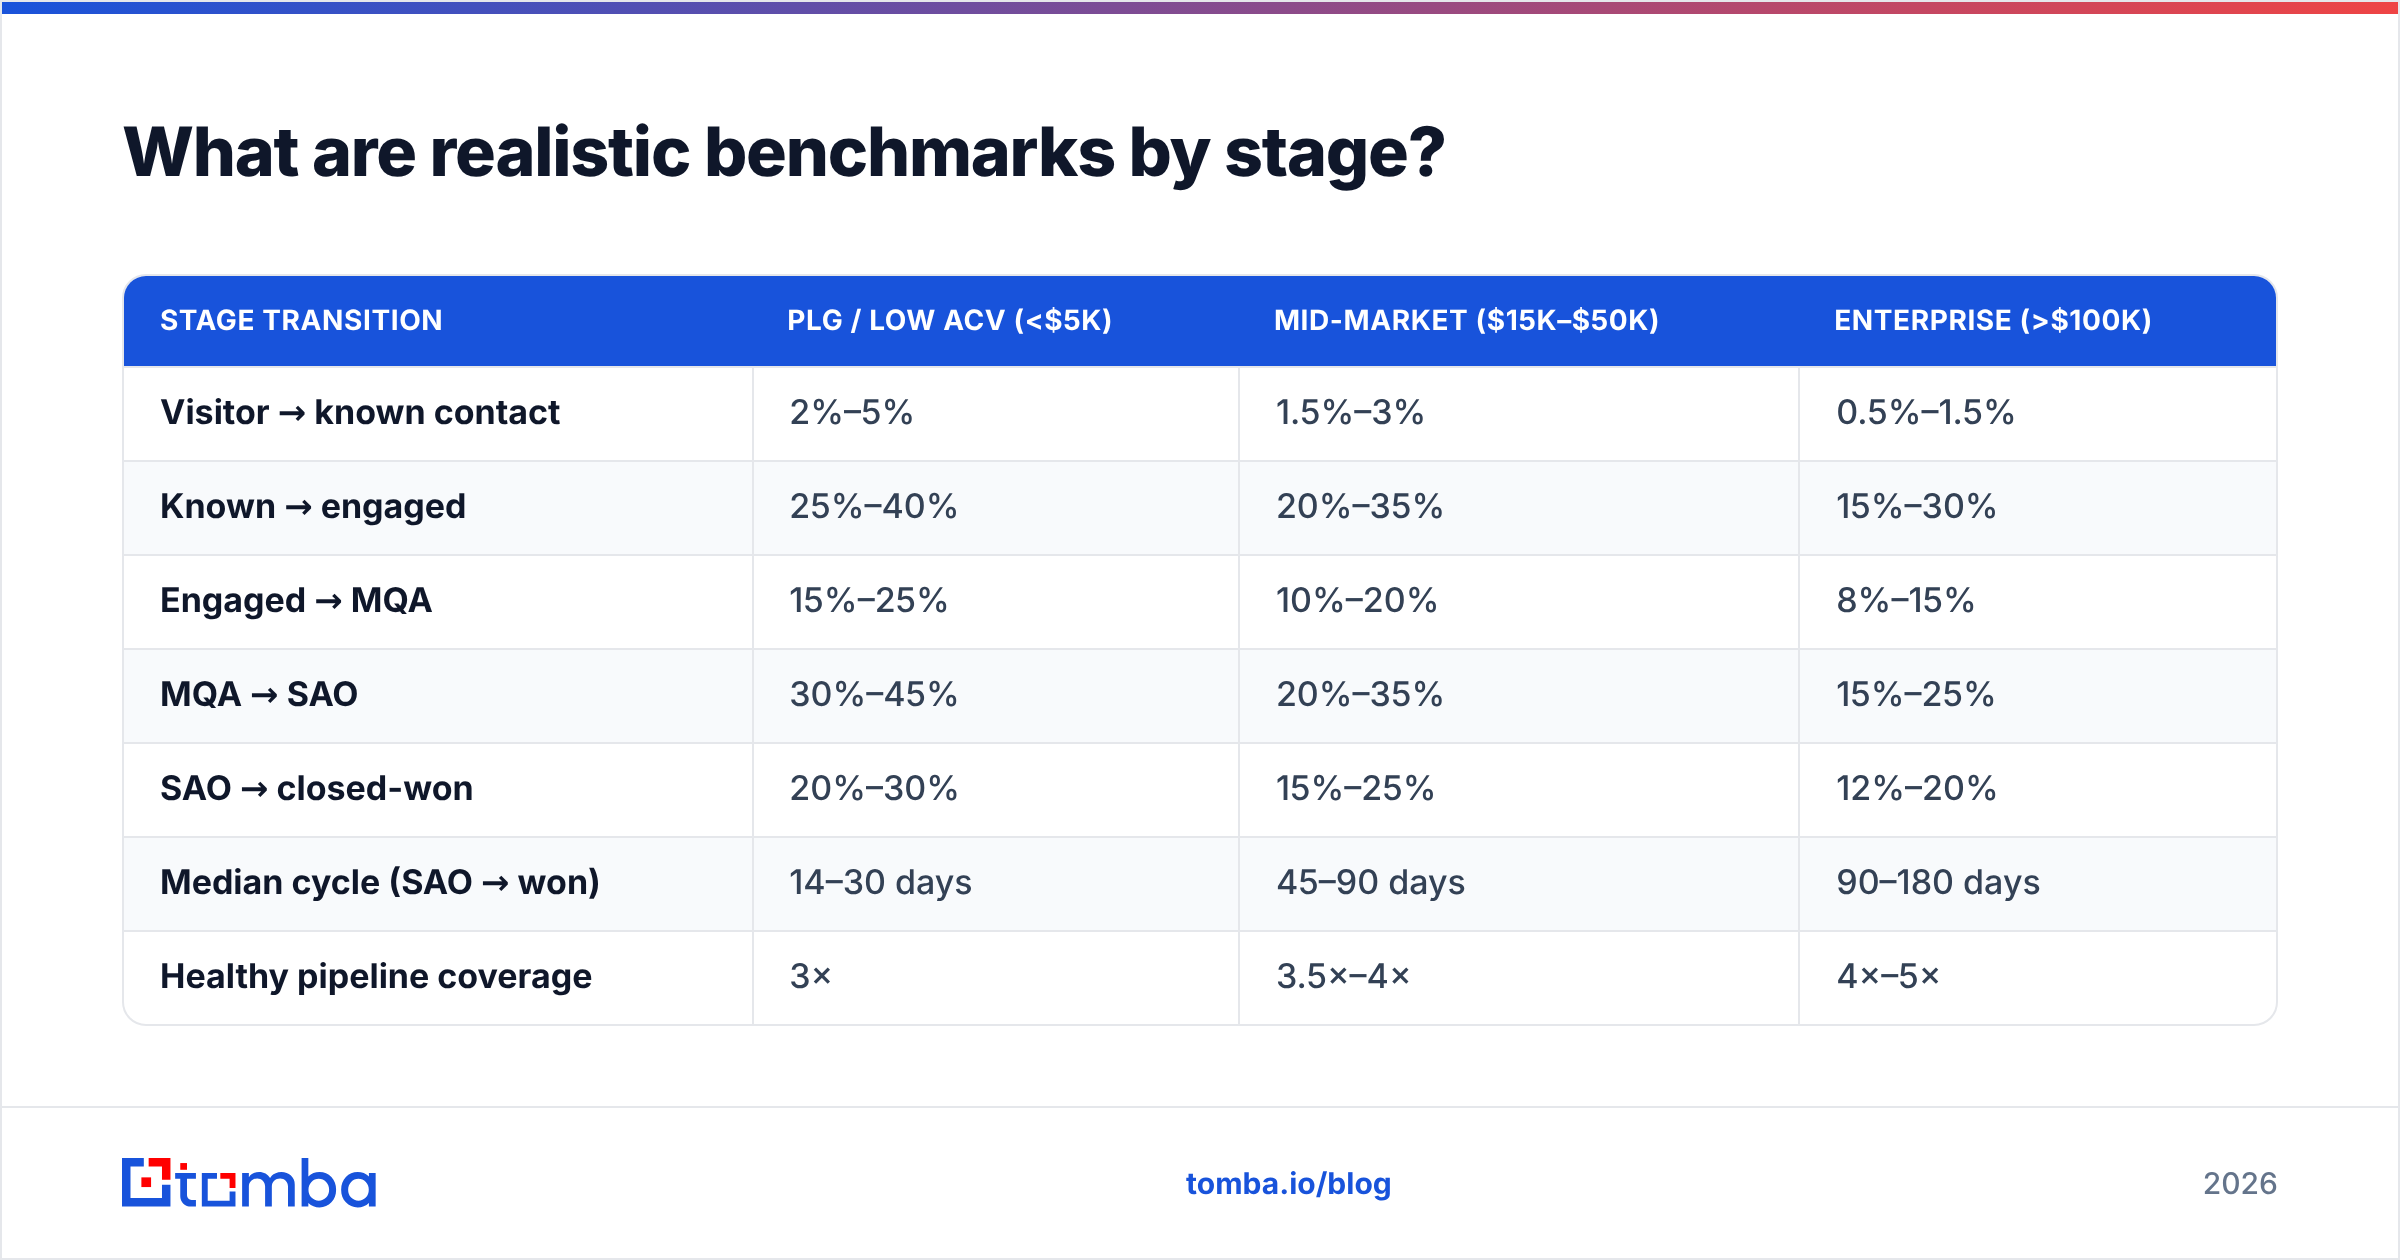
What are realistic benchmarks by stage?#
Use these as sanity ranges, not targets. Your ACV, motion, and category maturity move them enormously.
| Stage transition | PLG / low ACV (<$5K) | Mid-market ($15K–$50K) | Enterprise (>$100K) |
|---|---|---|---|
| Visitor → known contact | 2%–5% | 1.5%–3% | 0.5%–1.5% |
| Known → engaged | 25%–40% | 20%–35% | 15%–30% |
| Engaged → MQA | 15%–25% | 10%–20% | 8%–15% |
| MQA → SAO | 30%–45% | 20%–35% | 15%–25% |
| SAO → closed-won | 20%–30% | 15%–25% | 12%–20% |
| Median cycle (SAO → won) | 14–30 days | 45–90 days | 90–180 days |
| Healthy pipeline coverage | 3× | 3.5×–4× | 4×–5× |
Two readings of this table matter more than the numbers themselves.
First, enterprise funnels are narrower at every single gate but worth vastly more per unit — which is why cost per SAO is a useless standalone metric. A $2,400 SAO that closes 20% of the time at $150K ACV is dramatically better than a $180 SAO closing 22% at $4K.
Second, coverage requirements rise as cycle length rises. A 5× coverage target in a 21-day PLG cycle is over-building. A 3× target on a 150-day enterprise cycle means you're already short and don't know it yet.
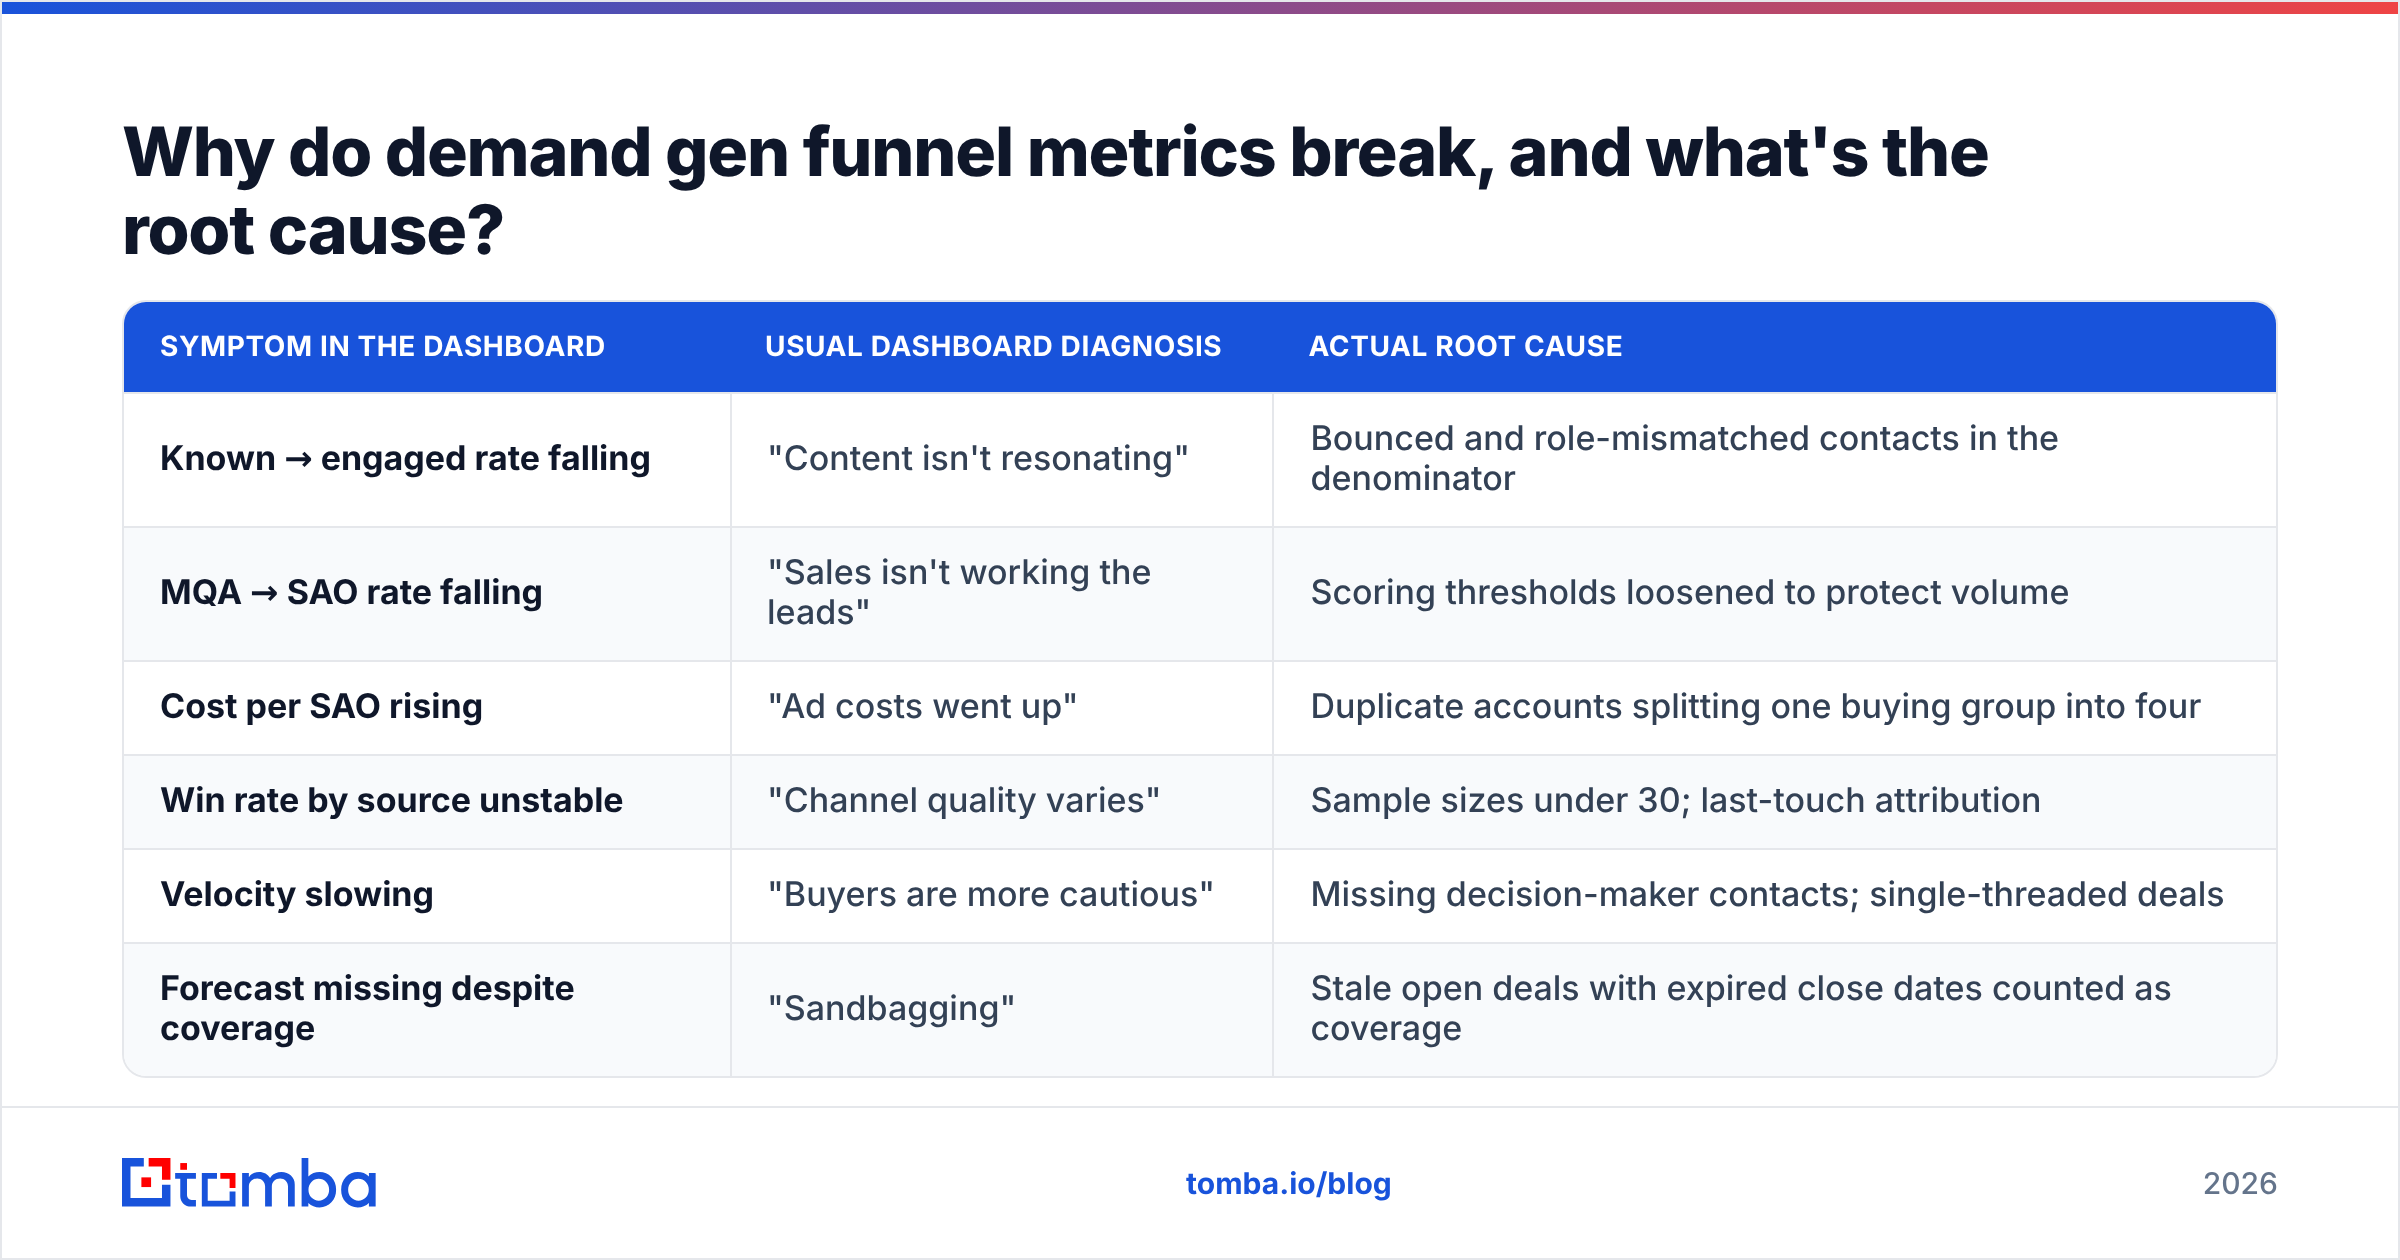
Why do demand gen funnel metrics break, and what's the root cause?#
Nine times out of ten, it's the data layer — not the dashboard layer.
Here's the failure chain. You buy or scrape a list. 20% of the addresses are invalid. Those contacts enter the funnel as "known contacts," inflating the denominator of your visitor-to-lead and known-to-engaged rates. They never engage, so your engagement rate drops. Marketing responds by loosening MQA criteria to keep volume up. Sales starts rejecting MQAs. Someone proposes a new attribution tool.
The attribution tool will not fix this. Verified contact data will.
| Symptom in the dashboard | Usual dashboard diagnosis | Actual root cause |
|---|---|---|
| Known → engaged rate falling | "Content isn't resonating" | Bounced and role-mismatched contacts in the denominator |
| MQA → SAO rate falling | "Sales isn't working the leads" | Scoring thresholds loosened to protect volume |
| Cost per SAO rising | "Ad costs went up" | Duplicate accounts splitting one buying group into four |
| Win rate by source unstable | "Channel quality varies" | Sample sizes under 30; last-touch attribution |
| Velocity slowing | "Buyers are more cautious" | Missing decision-maker contacts; single-threaded deals |
| Forecast missing despite coverage | "Sandbagging" | Stale open deals with expired close dates counted as coverage |
The fix sequence is boring and effective: verify everything on entry, deduplicate to the account level, then enforce stage definitions with automated validation rules. Run an email verifier against inbound form fills and list imports before records ever hit the CRM, and use data enrichment to fill in firmographics so ICP-fit scoring has something real to score against. Only then does attribution modeling produce numbers worth arguing about.
How should you structure the reporting stack?#
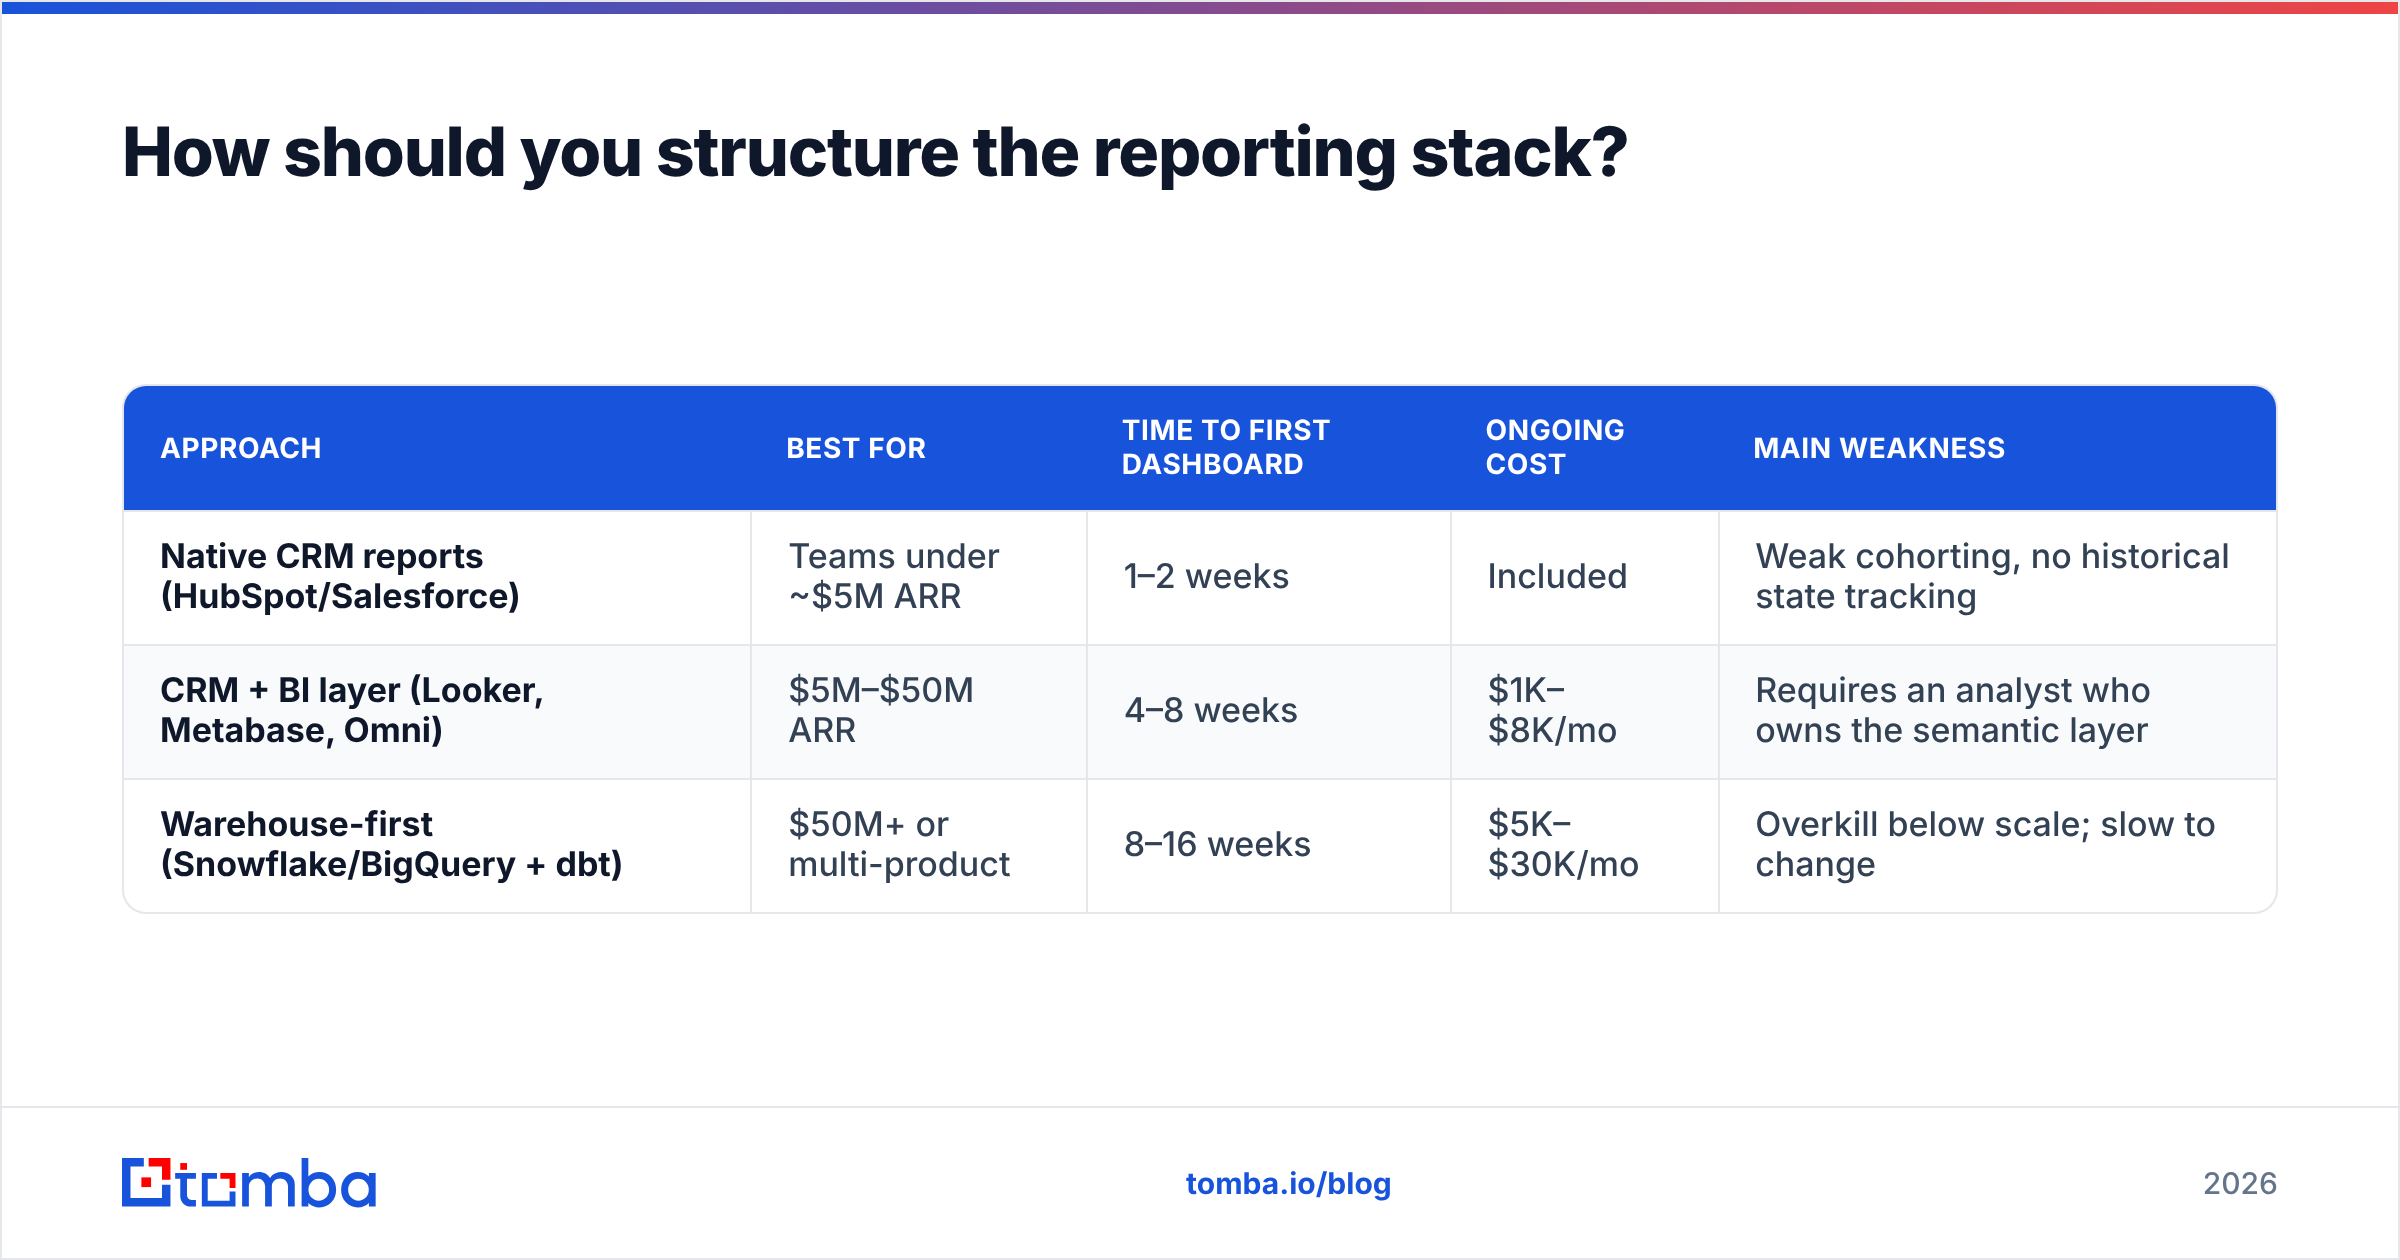
You have three realistic architectures, and the right one depends on data volume and team maturity — not on budget.
| Approach | Best for | Time to first dashboard | Ongoing cost | Main weakness |
|---|---|---|---|---|
| Native CRM reports (HubSpot/Salesforce) | Teams under ~$5M ARR | 1–2 weeks | Included | Weak cohorting, no historical state tracking |
| CRM + BI layer (Looker, Metabase, Omni) | $5M–$50M ARR | 4–8 weeks | $1K–$8K/mo | Requires an analyst who owns the semantic layer |
| Warehouse-first (Snowflake/BigQuery + dbt) | $50M+ or multi-product | 8–16 weeks | $5K–$30K/mo | Overkill below scale; slow to change |
Whichever you pick, three non-negotiables:
- Snapshot stage membership daily. Without daily snapshots you cannot reconstruct historical cohorts, and you will be permanently unable to answer "was Q1 actually better?"
- Store the source and the verification status on every contact record. Source-level analysis is impossible to retrofit.
- Define every metric once, in one place. If "SAO" means different things in the board deck and the rep dashboard, you will spend more time reconciling than deciding.
Good background reading on the operating model side: HubSpot's marketing research library for benchmark context, and G2's category grids for tooling comparisons with real user volume behind them. Both are more useful than vendor benchmark reports, which are almost always sampled from that vendor's own happiest customers.
What does a 30/60/90 rollout look like?#
Days 1–30 — Definitions and hygiene. Write one page defining all six stages with the exact CRM field values that constitute each. Get sales leadership to sign it. Run a full verification and dedup pass on your existing database, and record the invalidation percentage — that's your baseline data decay rate. Expect to lose 15%–30% of records. That loss is a gain.
Days 31–60 — Instrumentation. Turn on daily stage snapshots. Build the cohort conversion report and the velocity-by-stage report. Nothing else. Two reports, trailing four quarters, segmented by new business vs. expansion. Resist the urge to build twenty dashboards; you'll only argue about nineteen of them.
Days 61–90 — Decisions. Now add cost per SAO, win rate by source, and pipeline coverage. Hold a monthly 45-minute funnel review with marketing, sales, and revenue operations in the room. One rule for the meeting: every proposed action must name the specific stage transition it's meant to move. "Improve brand awareness" is not an action. "Raise MQA → SAO from 22% to 28% by adding a second verified contact per account before handoff" is.
That last example is where most teams find their fastest win. Single-threaded accounts convert worse and slower at every stage. Adding two to three verified stakeholders per target account before handoff moves MQA → SAO more reliably than any creative refresh.
Where do you start if you only have one week?#
Measure your data decay rate. It takes a day, costs almost nothing, and it tells you how much of every other number on your dashboard is fiction. If 20% of your contact records are dead, then a "24% MQA → SAO rate" is really closer to 30% on live data — and your team has been optimizing against a ghost.
Then rebuild the top of the funnel on contacts you can actually reach. Use Tomba Email Finder to build verified, ICP-matched contact sets by domain and role, so every record entering your funnel starts as a real, reachable person at a real target account. The free tier covers 25 searches a month if you want to test the accuracy on accounts you already know, and paid plans start at $49/mo on Starter — see Tomba pricing for the full breakdown. Clean inputs first, honest metrics second, better decisions third. That order never changes.
Related guides#
Ready to find emails that actually work?
Join 150,000+ professionals who stopped guessing and started sending. Free credits on signup — no credit card required.
Get the Tomba newsletter
Practical outbound tactics and product updates — once every two weeks.
About the author