Demand Generation Programs: A Practical 2026 Playbook
Most demand generation programs measure the wrong thing, scale the wrong channel, and blame the wrong team. Here's how to structure, staff, and measure a program that produces pipeline instead of MQL noise.
TL;DR
- A demand generation program is a funded, repeatable system that creates and captures buying demand — not a campaign calendar and not a lead-gen budget line.
- Most programs fail on the data layer, not the creative layer. If your contact records are 60% accurate, no amount of ad spend fixes attribution.
- Split spend roughly 60/30/10 across demand capture, demand creation, and experiments. Capture pays this quarter; creation pays in three.
- Measure pipeline created, cost per opportunity, and win rate by source. MQL count is a diagnostic, never a goal.
- A useful first 90 days: fix data, instrument reporting, run two channels properly, then scale the one with the lowest cost per closed-won.
What is a demand generation program?#
A demand generation program is a funded, repeatable system that creates awareness of a problem, converts that awareness into identified buyers, and hands those buyers to sales with enough context to sell. Three words matter: funded (it has its own budget line, not scraps from brand), repeatable (it runs monthly whether or not anyone is inspired), and system (channels feed one measurement model).
Think of it like a municipal water system. Demand creation is rainfall — you influence it slowly and can't invoice it. Demand capture is the reservoir and pipes — it collects what's already falling and delivers it on demand. Companies that only build pipes complain that it never rains. Companies that only seed clouds wonder why nothing comes out of the tap.
That distinction is why "demand generation" and "lead generation" are not synonyms. Lead generation is one tactic inside the capture half. A serious program owns both halves and reports on both differently: creation gets leading indicators (branded search volume, direct traffic, share of voice), capture gets lagging indicators (pipeline, cost per opportunity, win rate).
Why do most demand generation programs stall?#
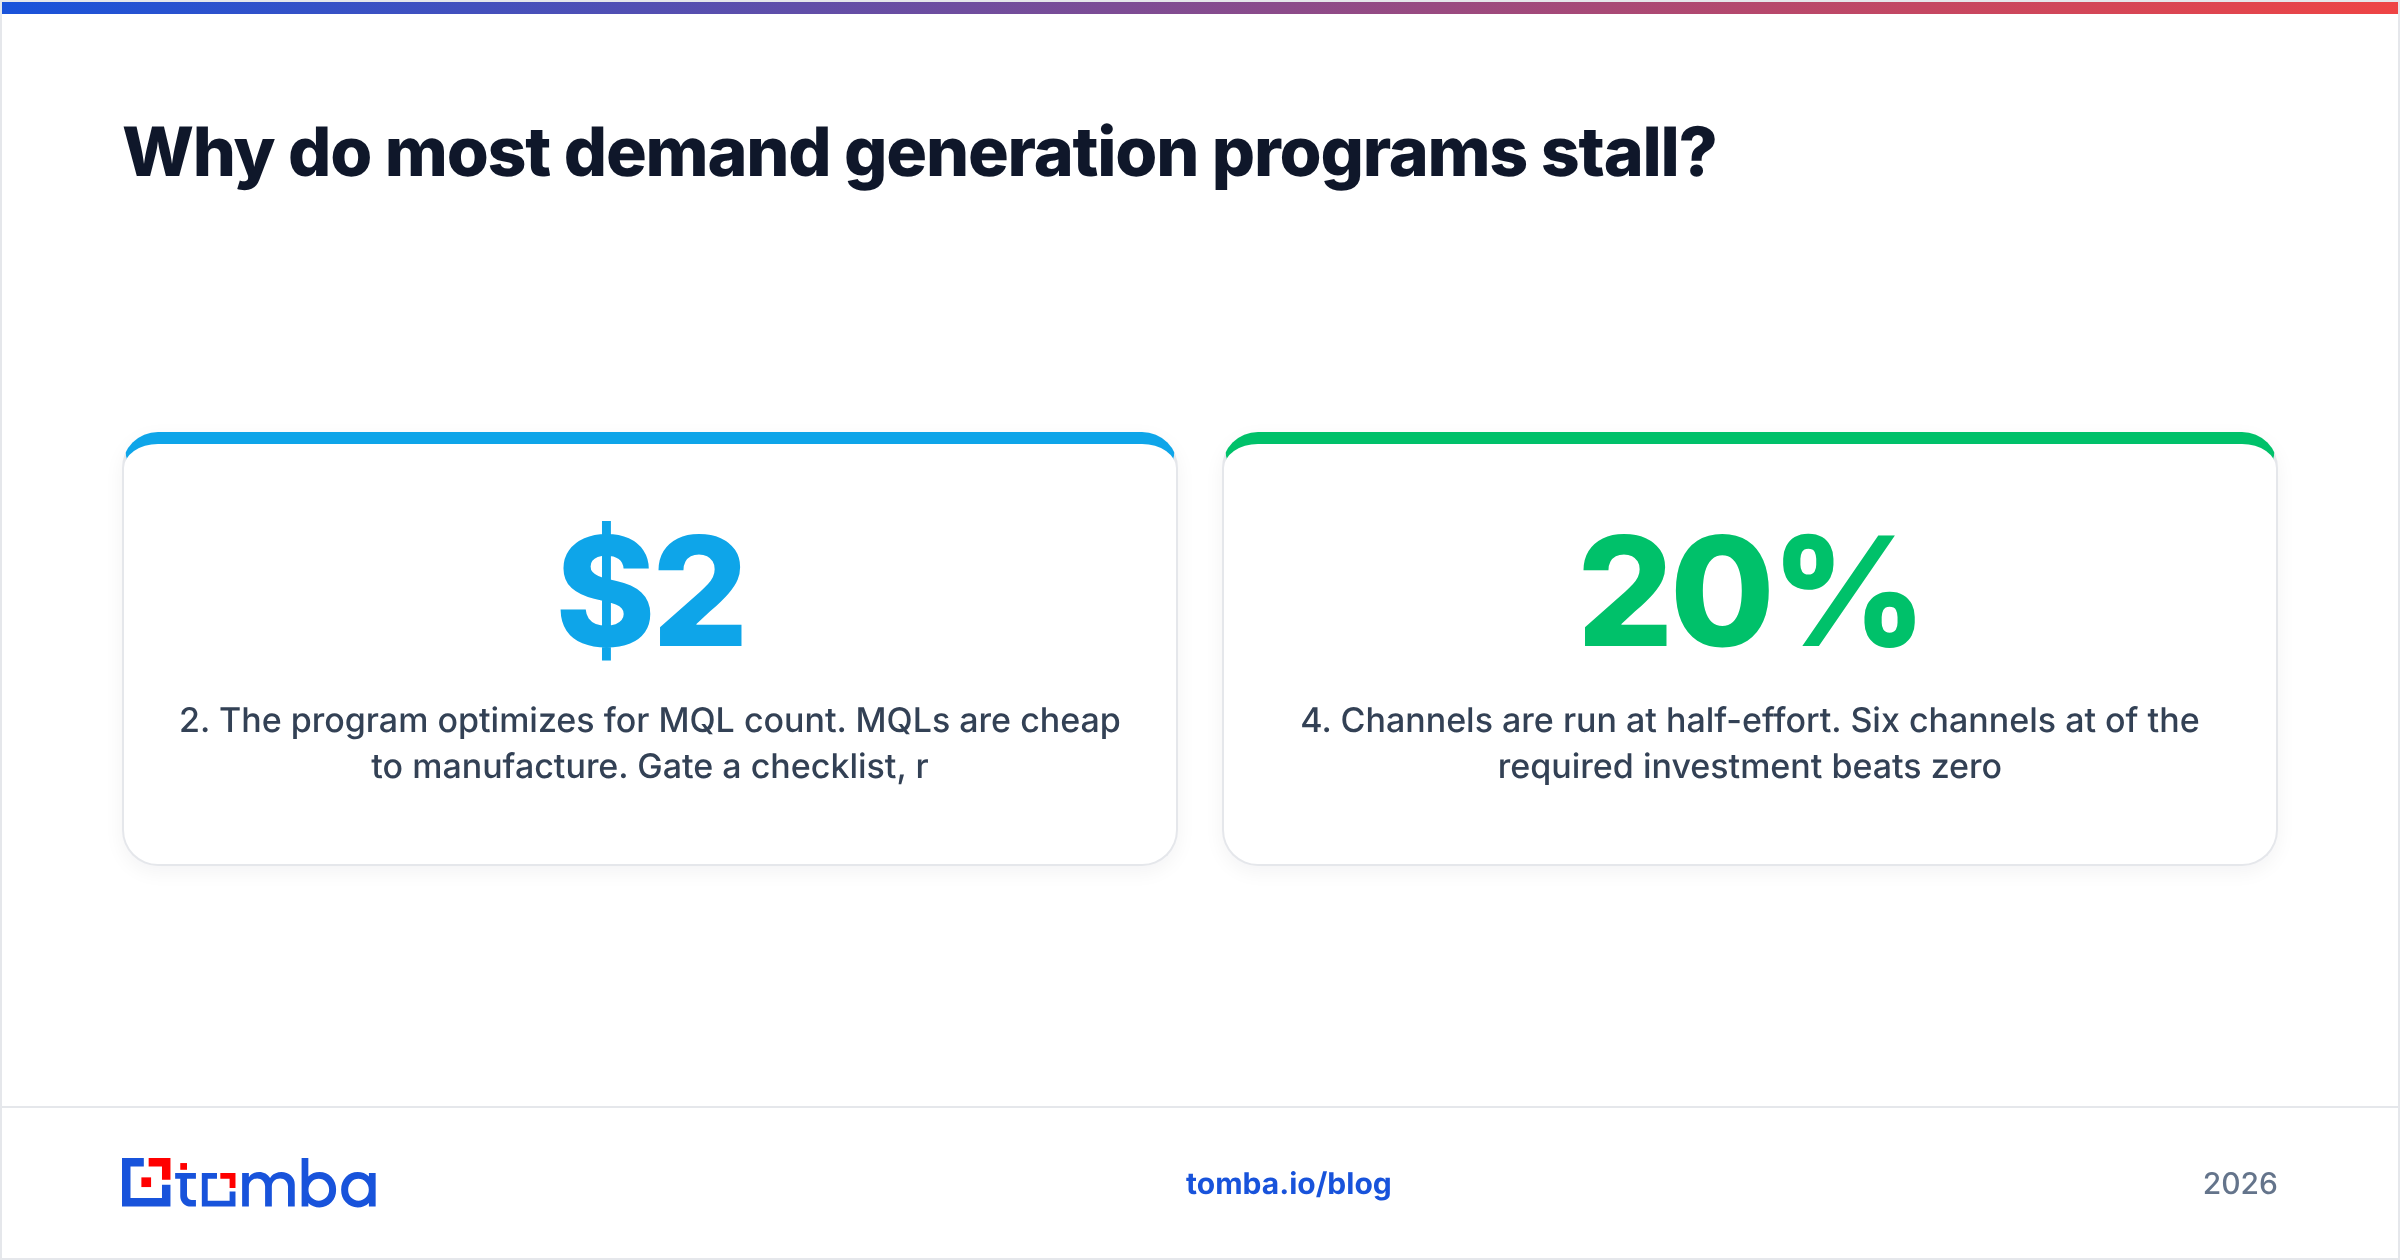
They stall for four reasons, in roughly this order of frequency.
- The data layer is broken. Form fills come in with
john@gmail.com, no company, no title. Enrichment fails, routing fails, scoring fails, and the SDR spends nine minutes per lead doing manual research. Everything downstream inherits that error. - The program optimizes for MQL count. MQLs are cheap to manufacture. Gate a checklist, run a $2 CPC campaign, and you can produce 400 of them. None convert, and by the time that's obvious, the budget is committed.
- Attribution is argued instead of instrumented. If nobody agreed on the model before the quarter started, every review becomes a negotiation between paid and content.
- Channels are run at half-effort. Six channels at 20% of the required investment beats zero channels but loses badly to two channels at 100%. Spreading budget thin is the most common self-inflicted wound in B2B.

Notice that three of the four are operational, not creative. Gartner's B2B buying research has been making the same point for years: buyers complete most of their evaluation independently, so the program's job is to be present and correct at the moments they self-serve — not to out-clever anyone with copy.
What are the core components of a demand generation program?#
Every functioning program has these six components. Missing any one of them shows up as a specific, predictable failure mode.
- ICP definition and account list — A written definition (firmographics, technographics, trigger events) plus a finite list of accounts it resolves to. Without it, targeting is vibes. Failure mode: high traffic, low conversion.
- Contact data layer — Verified emails, direct phone numbers, and enriched attributes for the buying committee at those accounts. Failure mode: bounce rates above 5%, sender reputation damage, dead sequences.
- Demand creation engine — Content, podcasts, communities, paid social, events. Measured on reach and branded demand, not on form fills. Failure mode: nobody has heard of you when the RFP is written.
- Demand capture engine — Paid search, review sites, comparison pages, SEO on high-intent terms, outbound to accounts showing intent. Failure mode: competitors buy your category term and win deals you educated.
- Routing and follow-up SLA — Who gets what, how fast, with which context. Five minutes to first touch versus one hour is a documented order-of-magnitude difference in connect rate. Failure mode: leads rot in a queue.
- Measurement model — One agreed definition of pipeline created, one attribution model, one dashboard. Failure mode: quarterly arguments instead of quarterly decisions.
If you only fix one this quarter, fix number two. It is the cheapest and it silently multiplies the other five.
How do demand generation channels compare?#
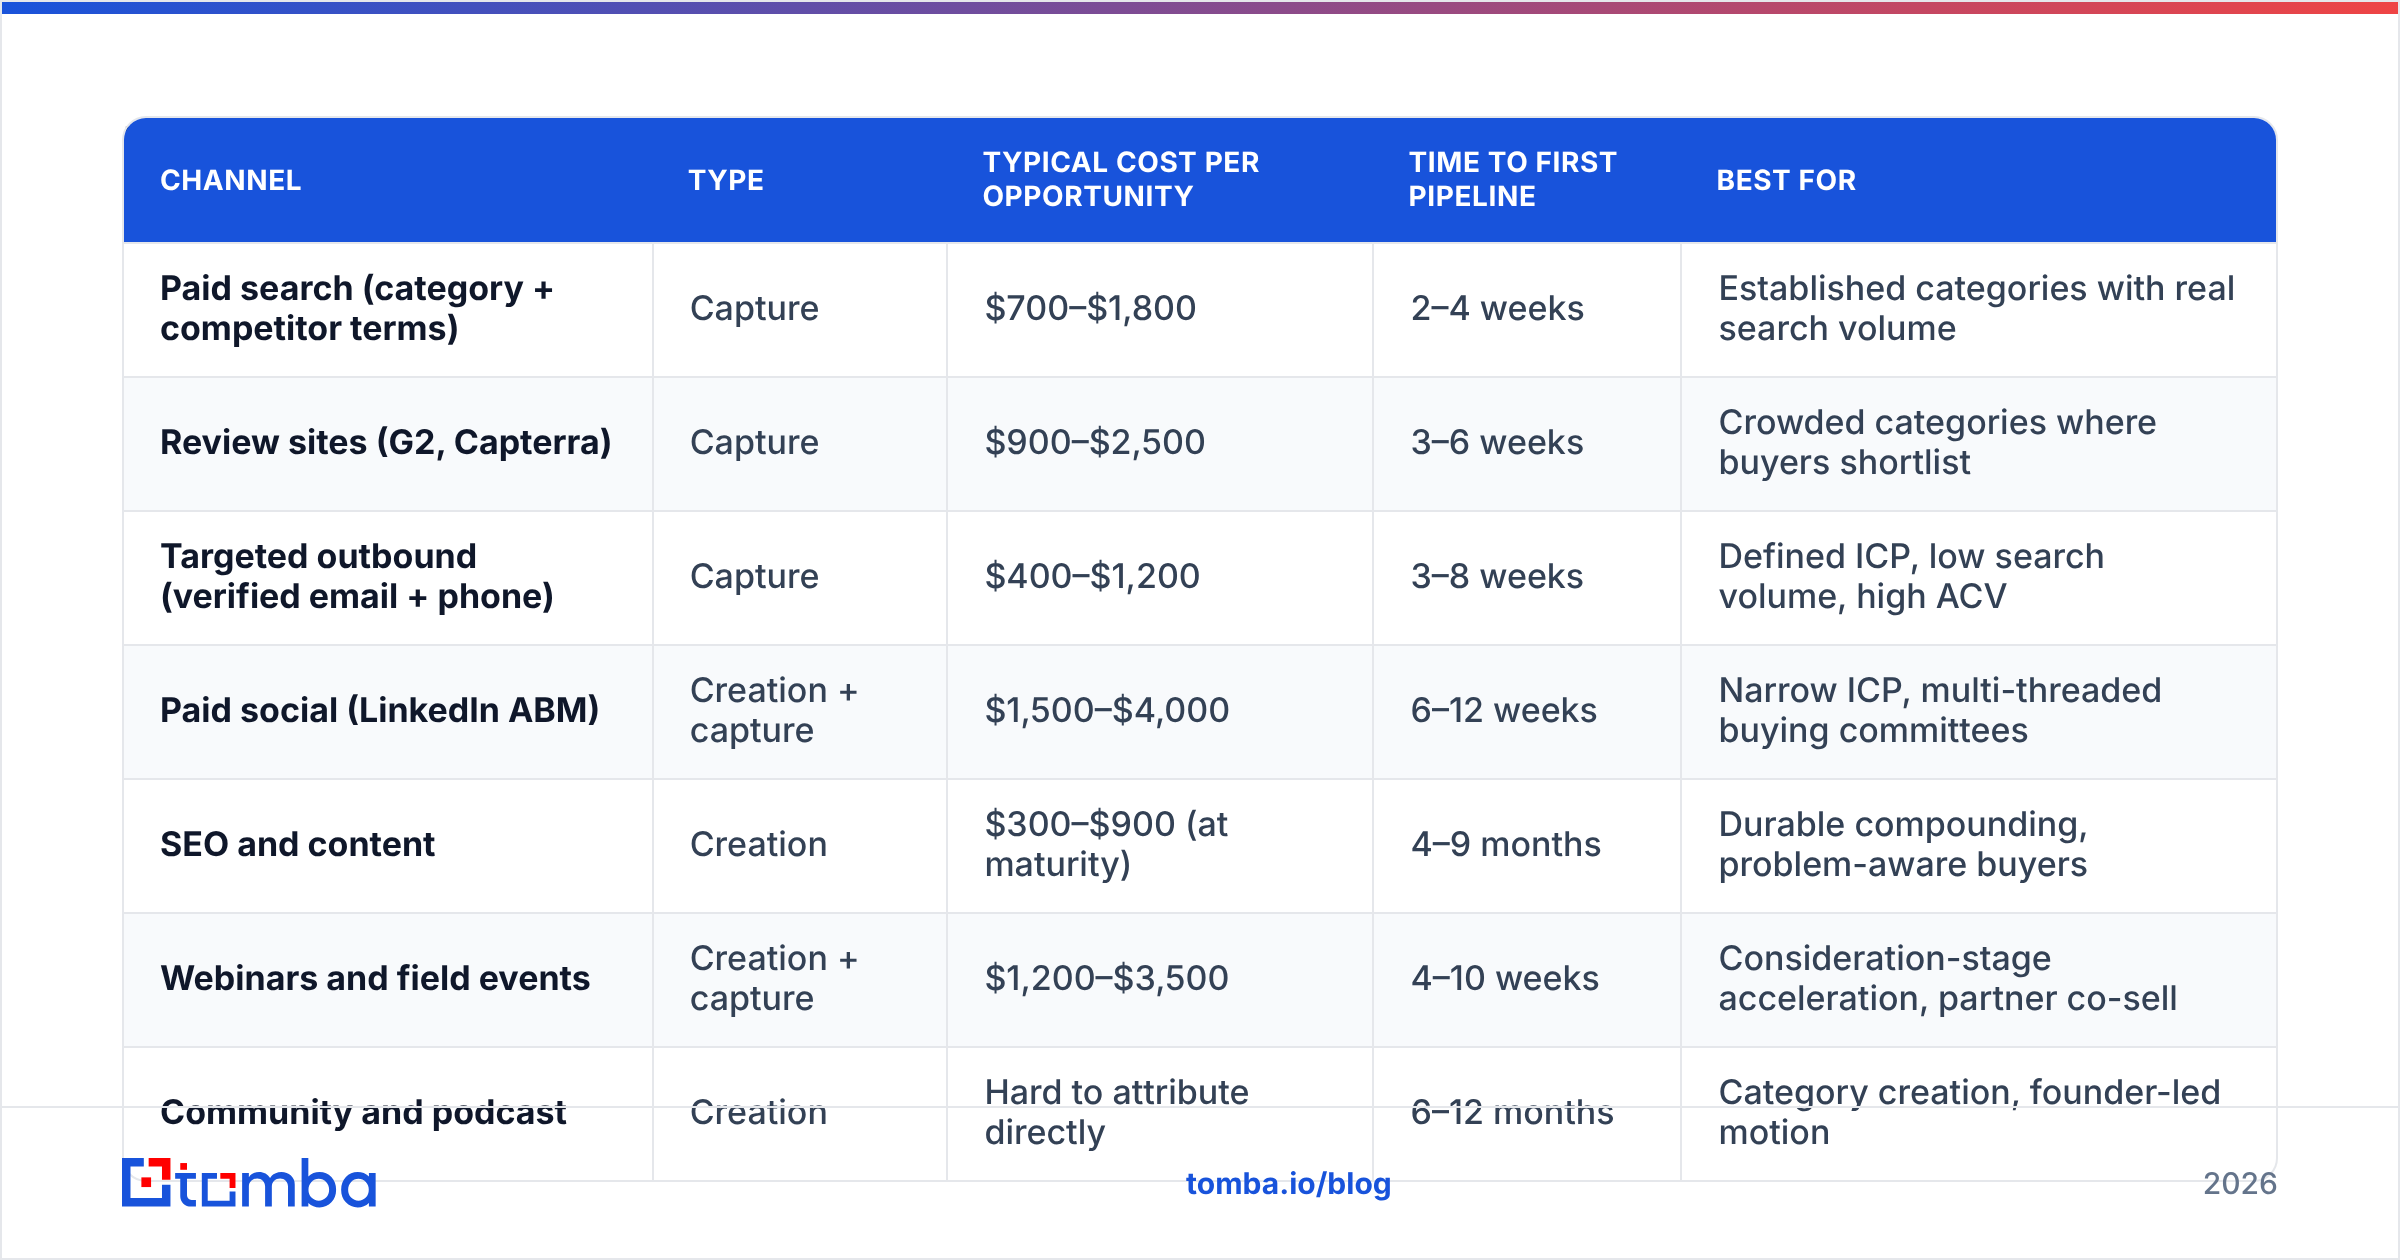
Channel selection is where most budgets go wrong. The table below reflects typical mid-market B2B SaaS economics (ACV $15k–$60k, 60–120 day cycles). Your numbers will differ, but the relative shape holds more often than not.
| Channel | Type | Typical cost per opportunity | Time to first pipeline | Best for |
|---|---|---|---|---|
| Paid search (category + competitor terms) | Capture | $700–$1,800 | 2–4 weeks | Established categories with real search volume |
| Review sites (G2, Capterra) | Capture | $900–$2,500 | 3–6 weeks | Crowded categories where buyers shortlist |
| Targeted outbound (verified email + phone) | Capture | $400–$1,200 | 3–8 weeks | Defined ICP, low search volume, high ACV |
| Paid social (LinkedIn ABM) | Creation + capture | $1,500–$4,000 | 6–12 weeks | Narrow ICP, multi-threaded buying committees |
| SEO and content | Creation | $300–$900 (at maturity) | 4–9 months | Durable compounding, problem-aware buyers |
| Webinars and field events | Creation + capture | $1,200–$3,500 | 4–10 weeks | Consideration-stage acceleration, partner co-sell |
| Community and podcast | Creation | Hard to attribute directly | 6–12 months | Category creation, founder-led motion |
Two readings of this table. First, outbound has the lowest cost per opportunity of any fast channel — but only when contact data is accurate, because the economics collapse the moment you pay for sends that bounce. Second, SEO looks like the cheapest line and is, at maturity; the trap is that "at maturity" is four to nine months away and most programs get defunded at month three.
A reasonable default allocation for a program in its first year: 60% capture, 30% creation, 10% experiments. Shift toward creation as branded search grows. If you can't name what the 10% is testing this quarter, it's not an experiment budget, it's slack.
How do you build the data layer that everything else depends on?#
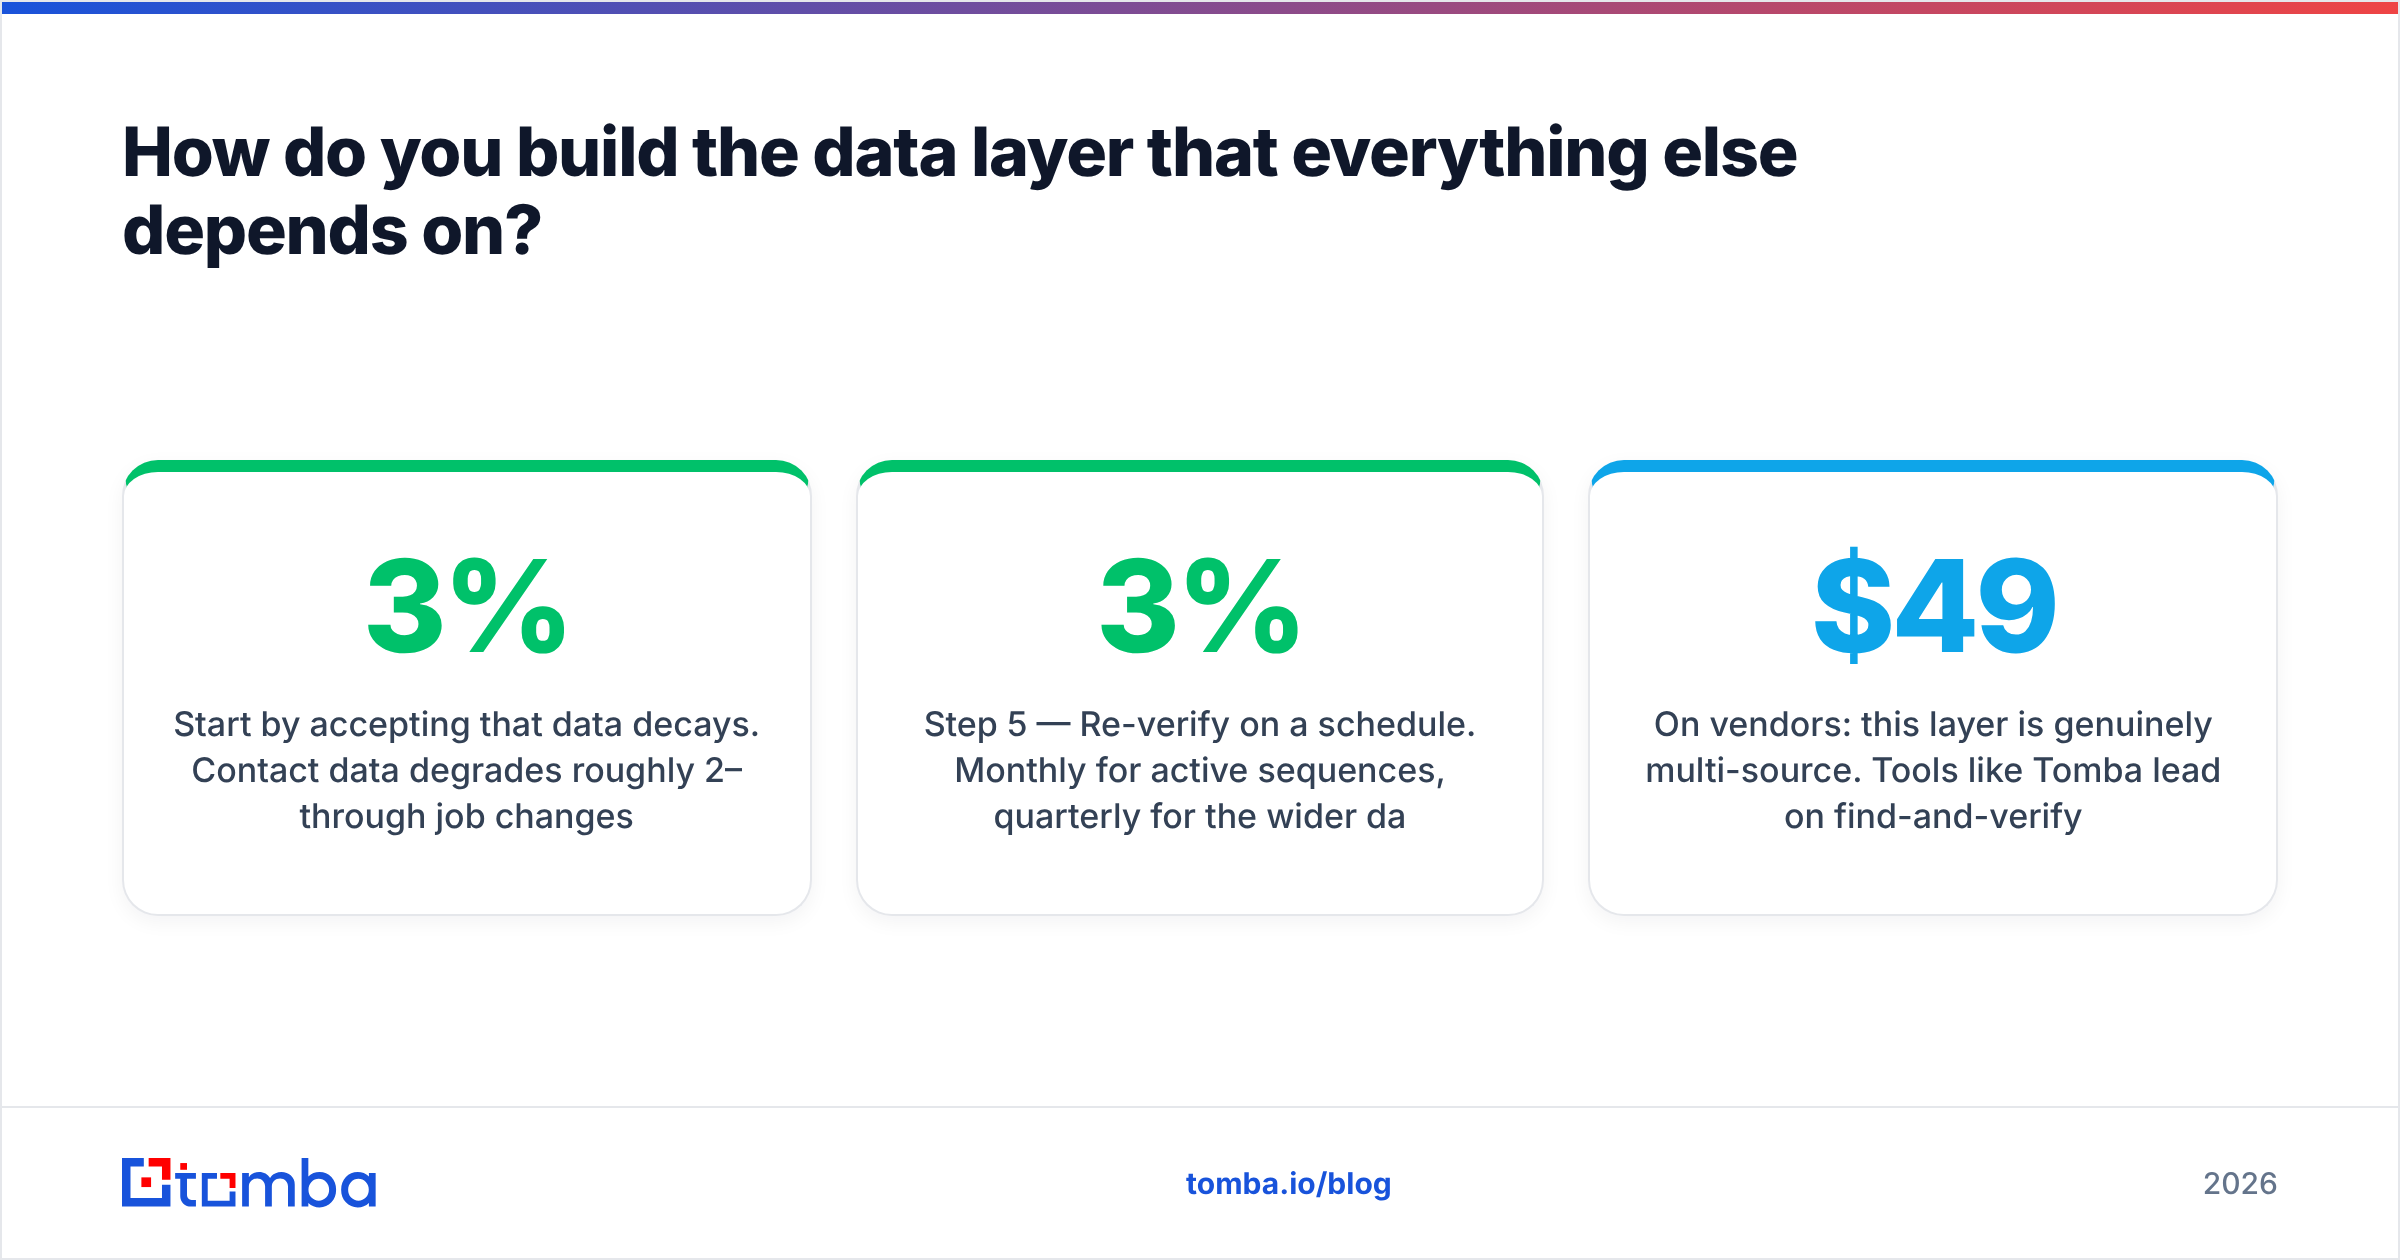
Start by accepting that data decays. Contact data degrades roughly 2–3% per month through job changes alone, which means an untouched list is about a quarter wrong within a year. A program treats data as a running process, not a purchase.
A workable sequence:
Step 1 — Define the account list. Firmographic filters plus at least one trigger (hiring for a role, new funding, tech stack change). Keep it finite. Two thousand well-chosen accounts beat forty thousand scraped ones.
Step 2 — Resolve the buying committee. For each account, identify the economic buyer, the champion, and the blocker. Use domain search to pull the contact map for a company in one call rather than guessing patterns by hand.
Step 3 — Find and verify. Run names and domains through an email finder, then push every result through an email verifier before it touches a sequence. Treat anything below "valid" as unusable, and handle catch-all domains separately rather than assuming they're safe.
Step 4 — Enrich the record. Title, seniority, department, location, company size, tech stack. Data enrichment is what makes routing and scoring possible; without it, your scoring model is scoring blanks.
Step 5 — Re-verify on a schedule. Monthly for active sequences, quarterly for the wider database. Cheap insurance against the 2–3% monthly decay.
On vendors: this layer is genuinely multi-source. Tools like Tomba lead on find-and-verify accuracy with transparent per-credit pricing (free tier at 25 searches/month, Starter $49/mo, Growth $99/mo, Pro $249/mo). Providers like BookYourData are strong when you want pre-built, human-verified list purchases with coverage guarantees rather than API-driven lookups. Most mature programs run more than one source and reconcile them — a waterfall that tries provider A, falls back to B, and verifies everything at the end typically beats any single vendor on match rate.
What should a demand generation program actually measure?#
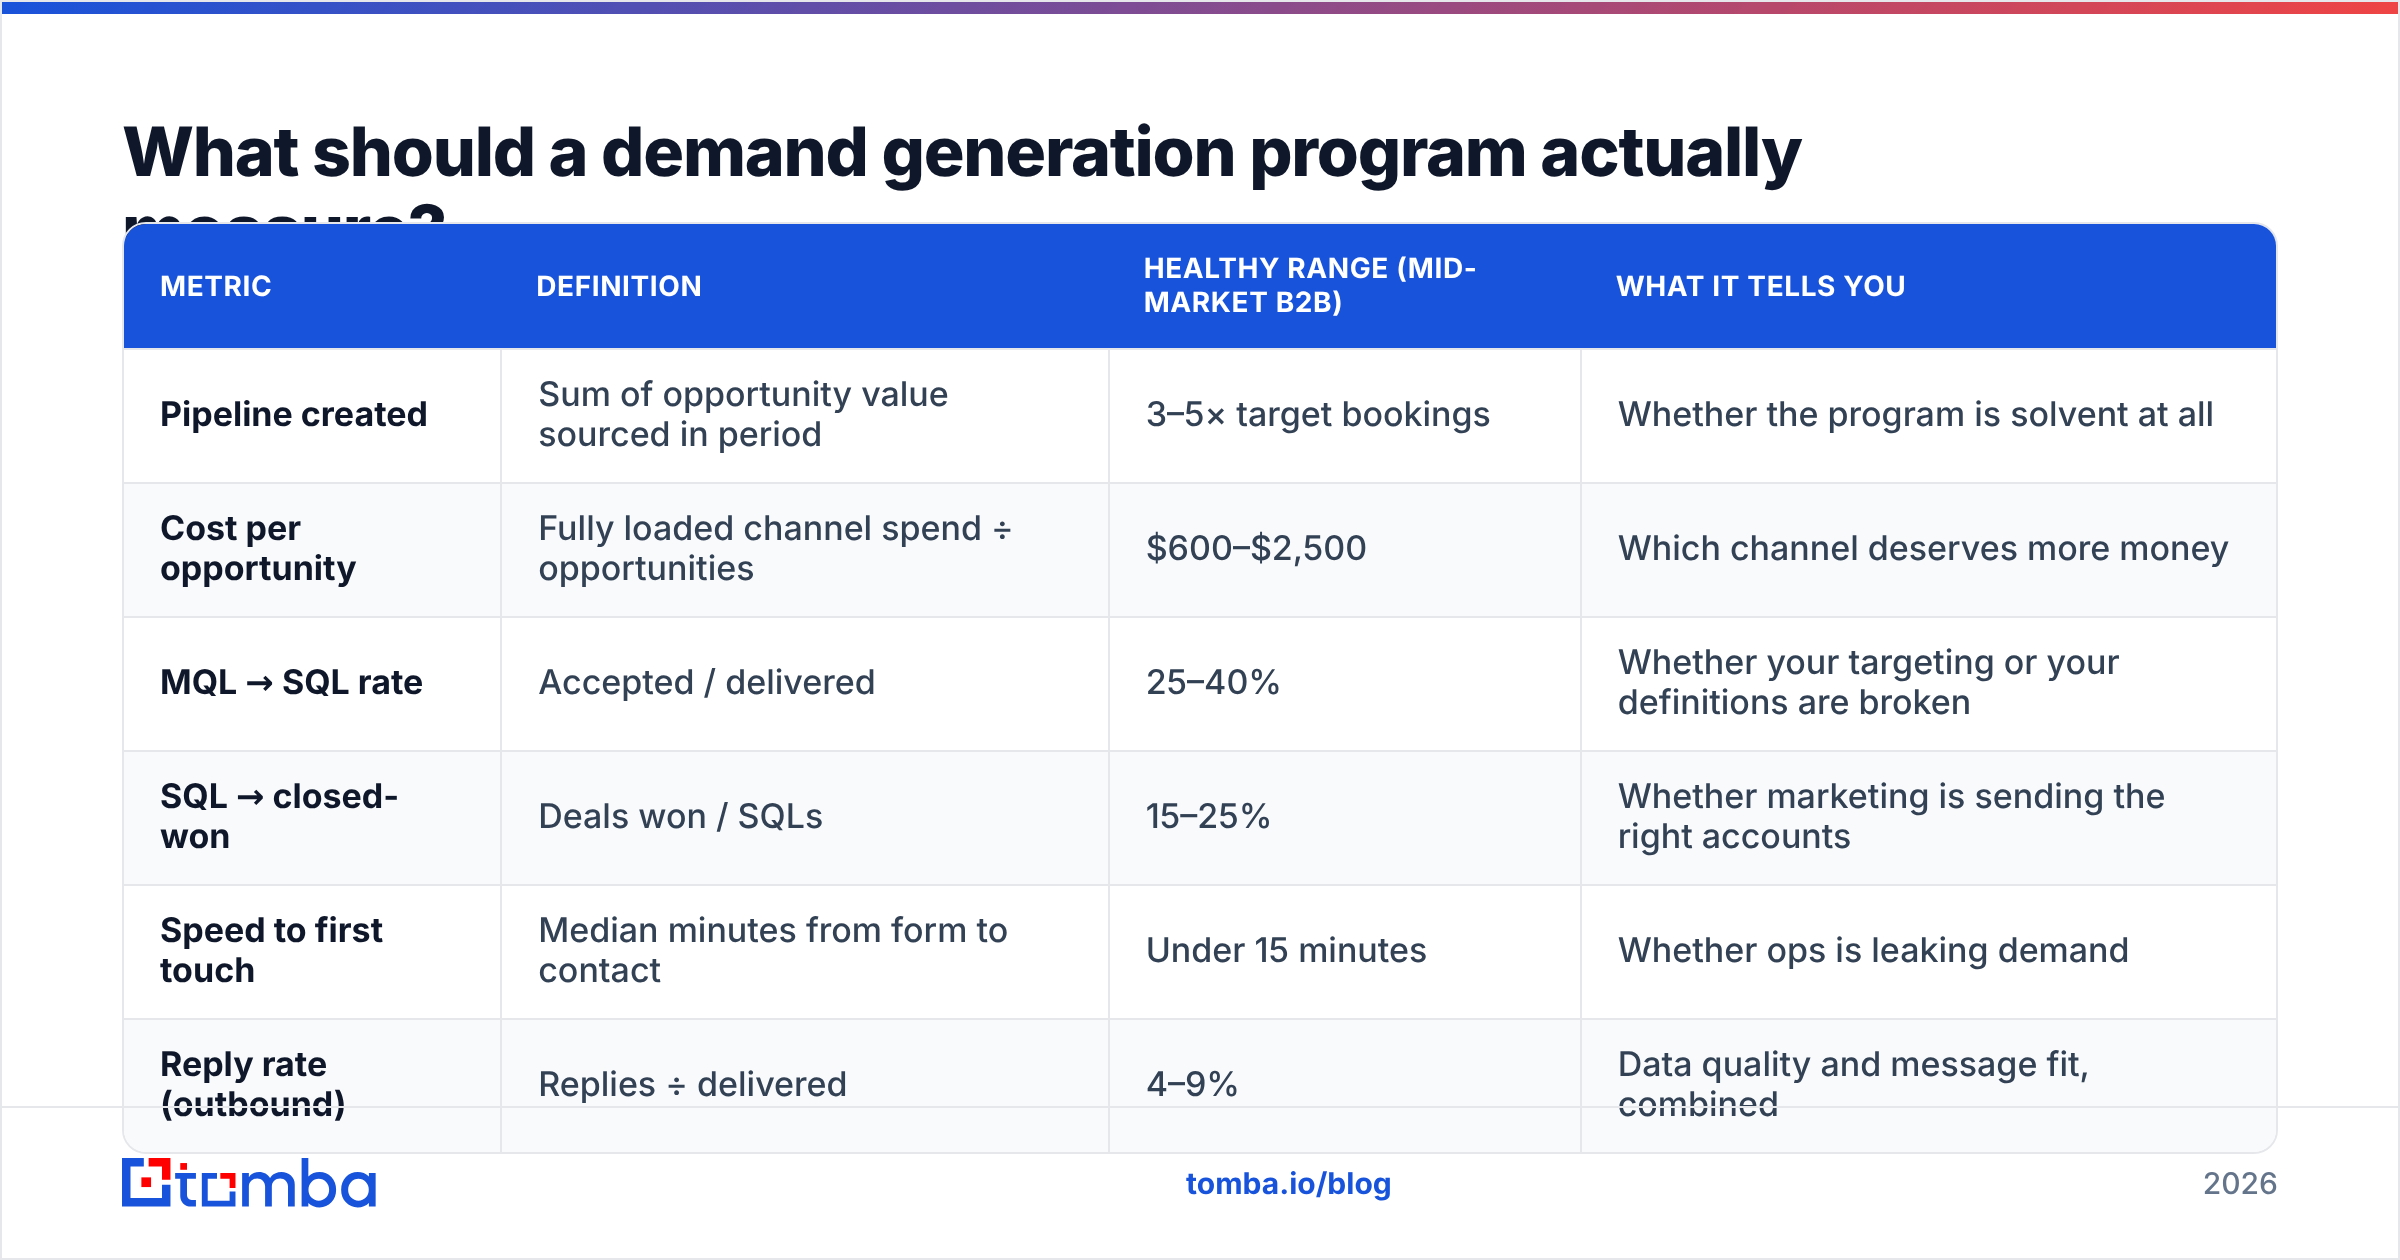
Replace the MQL dashboard with four numbers per channel.
| Metric | Definition | Healthy range (mid-market B2B) | What it tells you |
|---|---|---|---|
| Pipeline created | Sum of opportunity value sourced in period | 3–5× target bookings | Whether the program is solvent at all |
| Cost per opportunity | Fully loaded channel spend ÷ opportunities | $600–$2,500 | Which channel deserves more money |
| MQL → SQL rate | Accepted / delivered | 25–40% | Whether your targeting or your definitions are broken |
| SQL → closed-won | Deals won / SQLs | 15–25% | Whether marketing is sending the right accounts |
| Speed to first touch | Median minutes from form to contact | Under 15 minutes | Whether ops is leaking demand |
| Reply rate (outbound) | Replies ÷ delivered | 4–9% | Data quality and message fit, combined |
The pairing that matters most is cost per opportunity with SQL → closed-won by source. A channel with a $600 cost per opportunity and a 6% win rate is worse than a $2,000 channel closing at 24%. Averaged dashboards hide this; segmented ones surface it in a week. G2's category data is a useful sanity check on what buyers in your space actually shortlist, which often explains win-rate gaps better than any internal analysis.
Also track two leading indicators for the creation half: branded search volume and direct traffic. They move slowly, they resist attribution, and they are the only honest early evidence that demand creation is working. HubSpot's marketing benchmark data is a reasonable external reference point when you need to argue for patience on these.
What does a 90-day rollout look like?#
Days 1–30 — Fix the foundation. Write the ICP down. Build the account list. Audit your existing database: bounce rate, enrichment coverage, duplicate rate. Deduplicate, verify, enrich. Agree on one attribution model and one pipeline definition, in writing, with sales. Do not launch new channels this month.
Days 31–60 — Instrument and launch two channels. Build the dashboard first — if you can't see cost per opportunity by source on day 31, you'll be flying blind on day 90. Then launch exactly two channels: usually paid search on high-intent terms plus verified outbound to the account list. Set the follow-up SLA and enforce it.
Days 61–90 — Read results and concentrate. You'll have enough opportunity data to rank the two channels on cost per opportunity, and enough reply/conversion data to diagnose quality. Move budget toward the winner rather than adding a third channel. Start one creation motion — usually content on the problems your best-fit accounts already search for — knowing it won't pay inside the window.
Anything faster than this is a campaign, not a program. Anything slower usually means the data audit in month one turned up worse problems than expected, which is itself the finding.
What are the most expensive mistakes to avoid?#
- Gating everything. Gating a genuinely valuable asset is fine. Gating a two-page checklist trades reach for junk records and trains your audience to enter fake emails.
- Buying a giant unverified list. The list is cheap; the deliverability damage is not. One bad send can cost you months of inbox placement across your whole domain.
- Scoring before enriching. A lead score built on blank fields is a random number generator with a dashboard.
- Changing attribution mid-quarter. Whatever model you pick will be imperfect. Changing it mid-flight makes every comparison meaningless and destroys trust with sales.
- Cutting creation when the quarter gets tight. Capture spend borrows against demand that creation built. Cut creation for three quarters and capture costs quietly double, because you're bidding on demand competitors created.
Where should you start this week?#
Pull a random sample of 200 contacts from your CRM and verify them. If more than 15% come back invalid, risky, or unenriched, your data layer is the bottleneck — not your creative, not your channel mix, not your SDR team. That's a one-afternoon diagnostic that reframes most demand generation program debates.
If it confirms the problem, fix the input before you spend another dollar on distribution. Tomba's Email Finder resolves verified professional emails by name, domain, or company, with verification, enrichment, and bulk processing in the same workflow — so the accounts on your target list arrive in your sequences as complete, deliverable records instead of guesses. Start on the free tier (25 searches/month) to run the audit, then scale into Starter at $49/mo once you know the size of the gap.
Related guides#
Ready to find emails that actually work?
Join 150,000+ professionals who stopped guessing and started sending. Free credits on signup — no credit card required.
Get the Tomba newsletter
Practical outbound tactics and product updates — once every two weeks.
About the author