EDM Click Through Rate: How to Measure and Improve It
Most EDM click through rate benchmarks are inflated by bots, hidden by Apple, and measured against the wrong denominator. Here's how to calculate CTR honestly and lift it.
TL;DR
- EDM click through rate (CTR) = unique clicks ÷ emails delivered. Most teams accidentally divide by emails sent, which quietly deflates the number by 2-5%.
- Median B2B EDM CTR in 2026 sits around 2.0-2.6%. Anything above 4% is either excellent or bot-inflated — check before you celebrate.
- Click-to-open rate (CTOR) is the metric that actually tells you if the email worked. Open rate has been unreliable since Apple Mail Privacy Protection landed.
- Security scanners (Microsoft Defender, Proofpoint, Mimecast) click every link in your email. Untreated, they can fake 20-40% of your recorded clicks.
- The fastest real CTR lifts come from list hygiene, one primary call-to-action, and plain-text-weighted design — not from subject line A/B tests.
What is EDM click through rate?#
EDM click through rate is the share of delivered emails where at least one recipient clicked at least one link. EDM stands for "electronic direct mail" — the term is common in APAC and Australian marketing teams, and it usually means a designed, broadcast-style campaign email rather than a plain 1:1 sales email.
The formula everyone should use:
CTR = (unique clicks ÷ emails delivered) × 100
Three things break this in practice:
- Wrong denominator. Some platforms default to emails sent, not delivered. If 4% of your send bounces, your reported CTR is understated by roughly 4%. Fix the denominator before you compare yourself to anything.
- Unique vs. total clicks. Total clicks counts the same person clicking three links three times. It inflates CTR by 30-60% on multi-link newsletters. Unique clicks is the honest number.
- Bot clicks. Corporate security gateways pre-fetch and click every URL in an inbound email to sandbox it. Those clicks land in your analytics indistinguishable from human ones unless your ESP filters them.
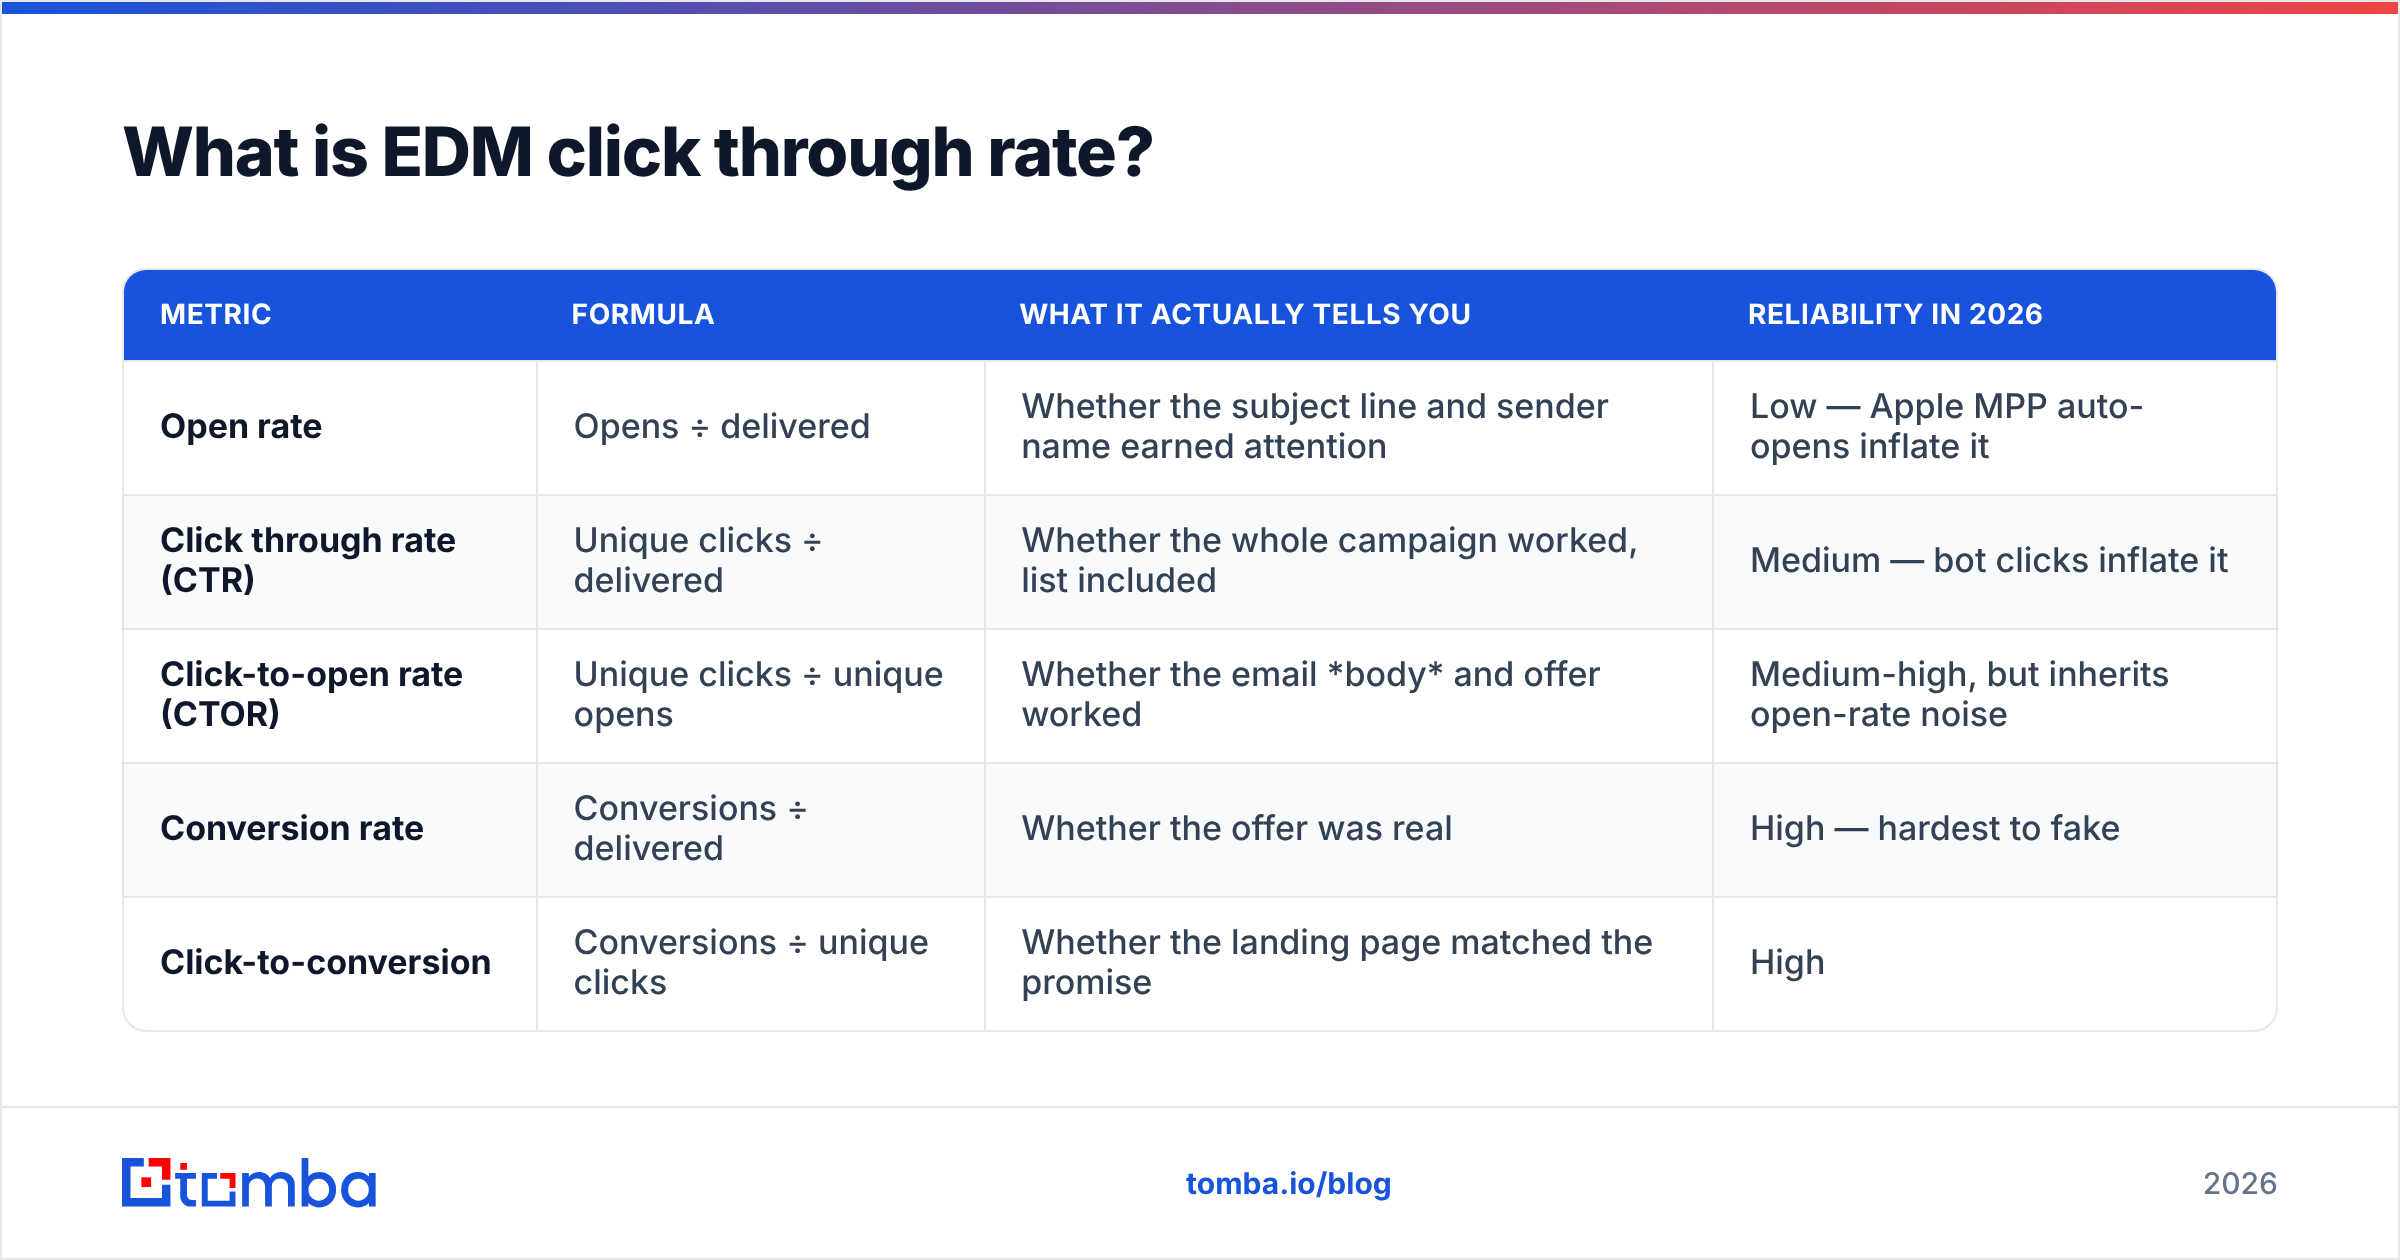
Here is how the three core engagement metrics relate:
| Metric | Formula | What it actually tells you | Reliability in 2026 |
|---|---|---|---|
| Open rate | Opens ÷ delivered | Whether the subject line and sender name earned attention | Low — Apple MPP auto-opens inflate it |
| Click through rate (CTR) | Unique clicks ÷ delivered | Whether the whole campaign worked, list included | Medium — bot clicks inflate it |
| Click-to-open rate (CTOR) | Unique clicks ÷ unique opens | Whether the email body and offer worked | Medium-high, but inherits open-rate noise |
| Conversion rate | Conversions ÷ delivered | Whether the offer was real | High — hardest to fake |
| Click-to-conversion | Conversions ÷ unique clicks | Whether the landing page matched the promise | High |
If you can only watch two numbers, watch CTR and click-to-conversion. CTR tells you the email pulled; click-to-conversion tells you the pull was qualified rather than accidental.
What is a good EDM click through rate in 2026?#
The honest answer: it depends far more on your list source than your creative. A 5,000-contact opt-in list from your own product signups will out-click a 200,000-contact purchased list by a factor of five, with identical copy.
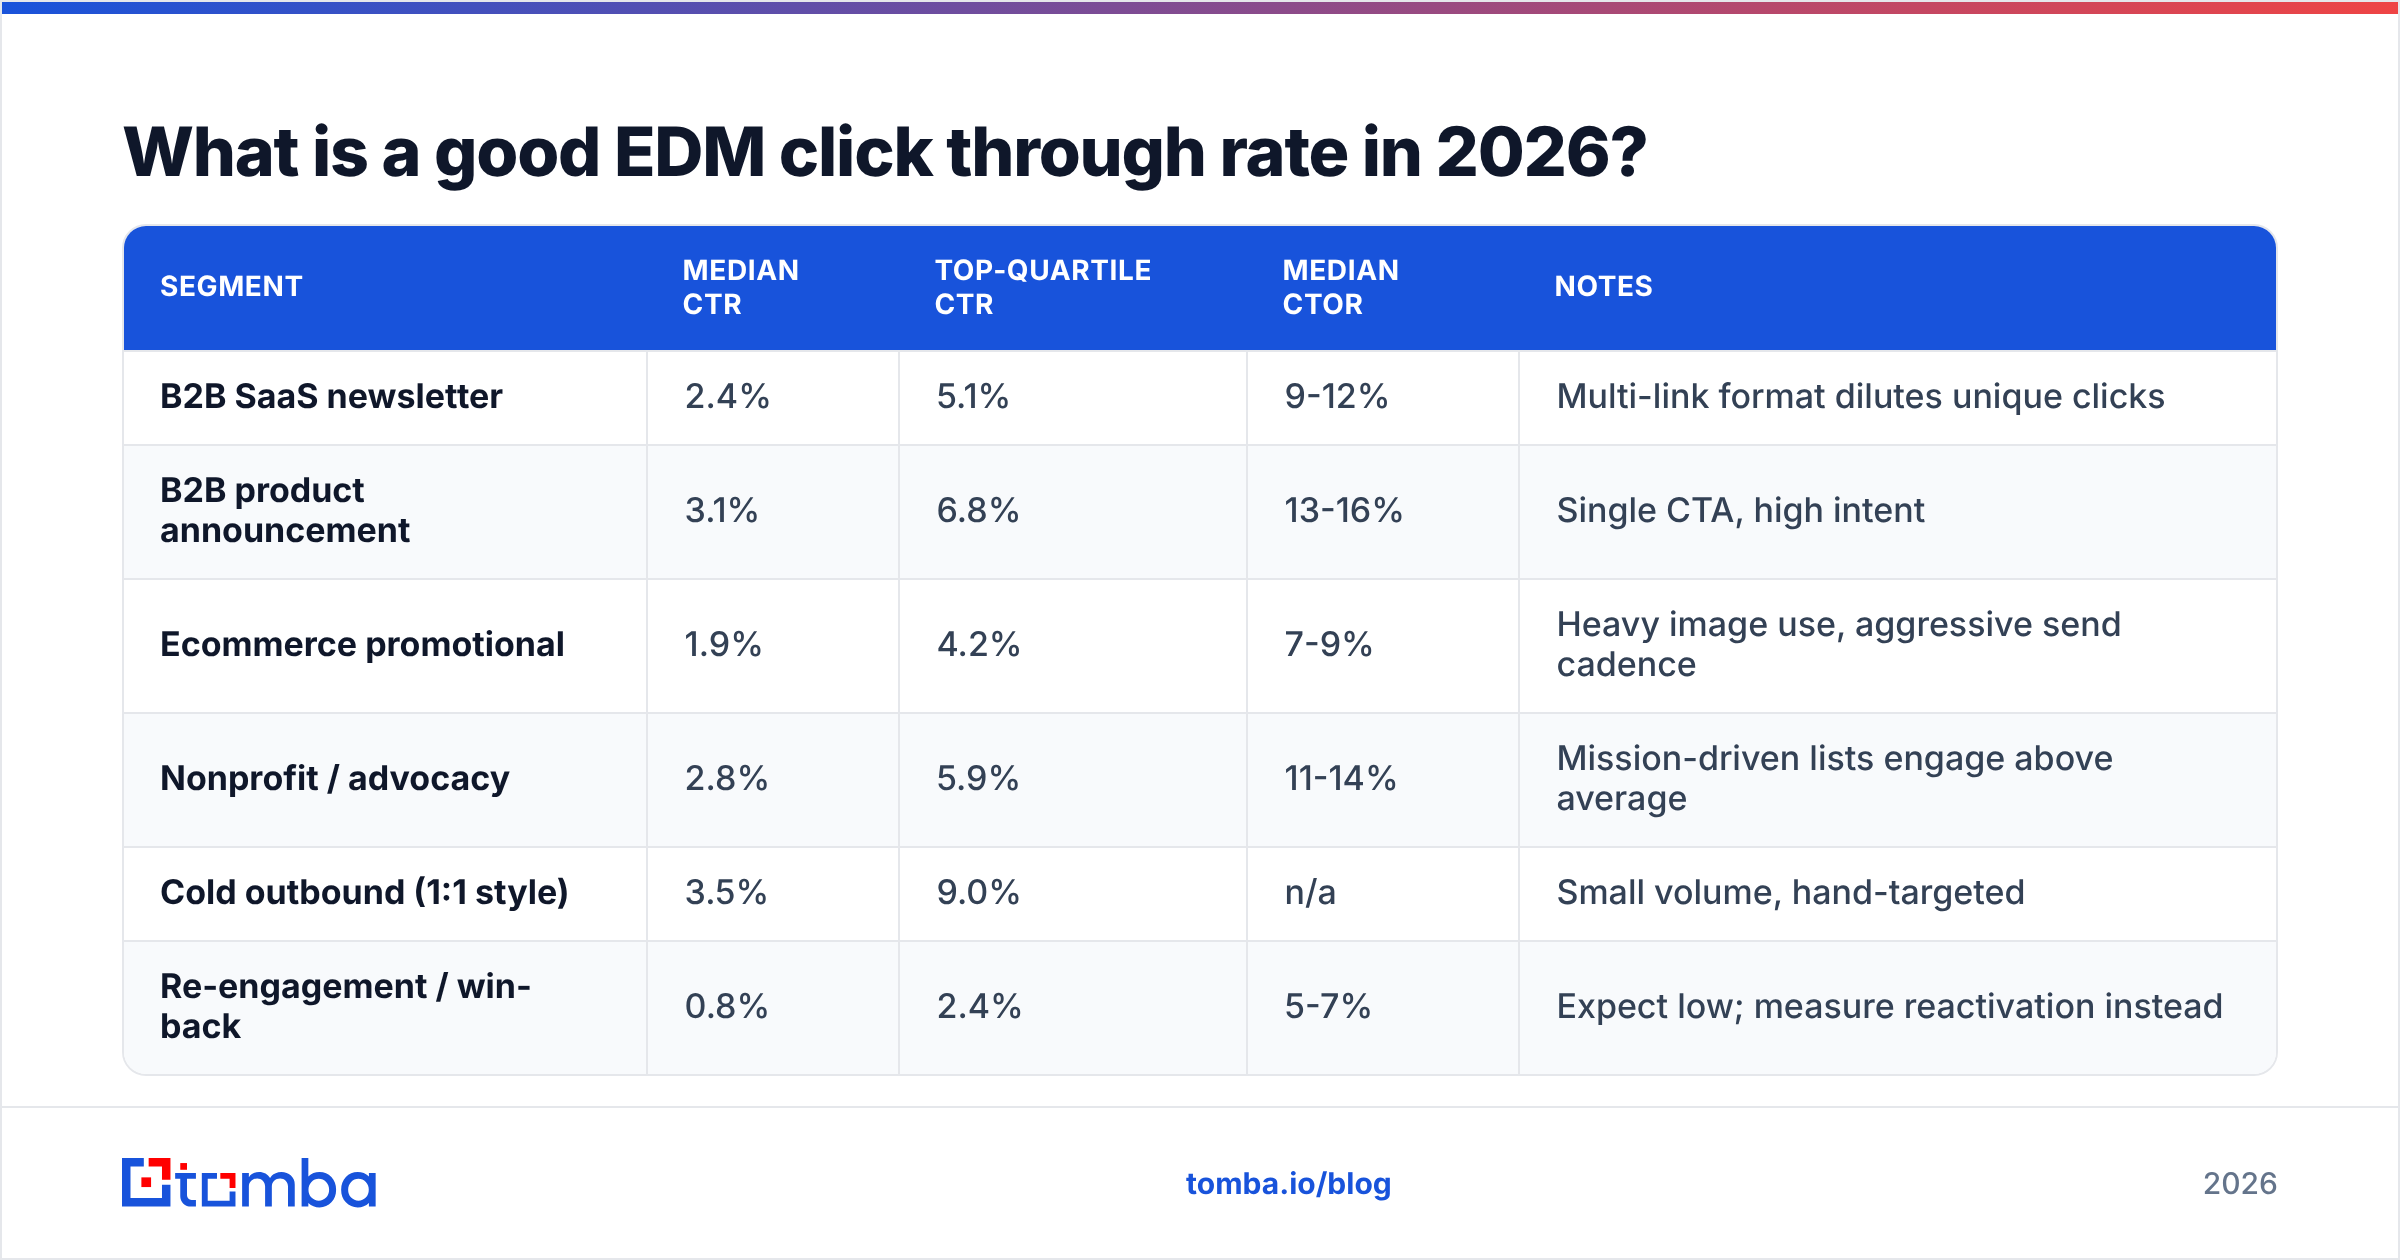
That said, here's where credible 2026 benchmark ranges land across industry reports from HubSpot, Mailchimp's published benchmarks, and vendor aggregate data:
| Segment | Median CTR | Top-quartile CTR | Median CTOR | Notes |
|---|---|---|---|---|
| B2B SaaS newsletter | 2.4% | 5.1% | 9-12% | Multi-link format dilutes unique clicks |
| B2B product announcement | 3.1% | 6.8% | 13-16% | Single CTA, high intent |
| Ecommerce promotional | 1.9% | 4.2% | 7-9% | Heavy image use, aggressive send cadence |
| Nonprofit / advocacy | 2.8% | 5.9% | 11-14% | Mission-driven lists engage above average |
| Cold outbound (1:1 style) | 3.5% | 9.0% | n/a | Small volume, hand-targeted |
| Re-engagement / win-back | 0.8% | 2.4% | 5-7% | Expect low; measure reactivation instead |
Two cautions on this table. First, "top quartile" in most published benchmark studies is computed across senders who use that ESP — a self-selecting group. Second, any dataset that predates aggressive bot-click filtering runs 15-30% high on CTR.
A useful sanity check: if your CTR is above 8% on a list larger than 20,000 contacts, you almost certainly have unfiltered scanner traffic. Segment your clicks by user agent and time-to-click. Clicks that land within 3 seconds of delivery, from datacenter IP ranges, in perfect sequential link order, are machines.
Why is your EDM click through rate lower than the benchmark?#
Work through these in order. The list ones move the needle most; the creative ones move it least.
- Your list has decayed. B2B contact data goes stale at roughly 22-30% per year — people change jobs, companies rebrand, domains get consolidated. Every dead address is a guaranteed non-click sitting in your denominator. Run a quarterly pass with an email verifier and suppress anything that returns invalid or risky.
- You're landing in Promotions or spam. A click can't happen in a folder nobody opens. Check your email deliverability fundamentals — SPF, DKIM, DMARC alignment, and whether your sending domain sits on any blocklists. Use a free spam checker on the exact HTML you're about to broadcast.
- You have too many calls to action. Six links spread across a newsletter split attention. Unique CTR usually rises when you cut to one primary action plus one secondary, even though total clicks fall.
- Your CTA is an image. Roughly 43% of B2B recipients read with images blocked by default on first open. If your button is a PNG, a large minority sees a broken box. Use bulletproof HTML/CSS buttons or a plain hyperlinked text line.
- The offer doesn't match the segment. A pricing page link sent to a list that has never heard of you is a mismatch. Segment by lifecycle stage before you segment by industry.
- You're sending too often to too few people who care. Frequency fatigue shows up as flat opens and collapsing clicks. That gap — opens holding, clicks falling — is the clearest fatigue signal you have.
How do you separate bot clicks from human clicks?#
Three filters, applied in this order:
- Time-to-click threshold. Discard clicks recorded under 5 seconds after delivery timestamp. No human opens, reads, and decides that fast.
- Link-order pattern. A recipient that clicks link 1, 2, 3, 4, 5 within the same second is a scanner walking your HTML.
- User agent + ASN. Datacenter ASNs (AWS, Azure, Microsoft security ranges) with headless user agents are scanners. Most major ESPs now ship a "filter known bot clicks" toggle — turn it on, then re-baseline your historical numbers so you're not comparing filtered to unfiltered periods.
Expect your reported CTR to drop 10-30% the day you enable filtering. That drop is not a regression. It's the first honest number you've had.
How do you actually improve EDM click through rate?#
Fix the list before you touch the copy#
This is where the largest, most reliable gains are, and it's the least fun part.
Start by knowing who is actually on your list. If you're building or expanding a B2B send list, source contacts by verified company domain rather than scraping whatever you can find. A domain search pulls the real, pattern-confirmed addresses at a target company, which means you start with a list that can receive mail instead of one you have to clean after the damage is done.
Then apply hygiene on a schedule:
- Verify at capture. Validate the address in the form, not three months later.
- Verify in bulk quarterly. Push the whole list through a bulk verify pass and suppress invalids.
- Handle catch-all domains separately. Catch-all servers accept everything, so standard verification returns "unknown." A dedicated catch-all verifier resolves a meaningful share of those instead of forcing you to guess.
- Sunset the non-clickers. If someone hasn't clicked in 180 days across 12+ sends, they're suppressing your CTR and your sender reputation simultaneously. Move them to a low-frequency track or remove them.
Design for the click, not for the screenshot#
- One primary CTA, repeated 2-3 times. Top, middle, bottom — same destination, same promise, different wording. This reliably out-performs three different offers.
- Text links beat buttons in B2B. In plain, sales-style EDMs, a hyperlinked sentence often out-clicks a designed button, because it reads as a colleague's message rather than a broadcast.
- Keep the primary CTA above the 600px fold on mobile. Over 60% of B2B email is first opened on a phone.
- Write the link text as the outcome, not the mechanic. "See the 2026 benchmark data" beats "Click here" and beats "Read more."
- Ship a real plain-text alternative. A weak multipart/alternative text part hurts both rendering and inbox placement.
Test the things that move CTR, not the things that are easy to test#
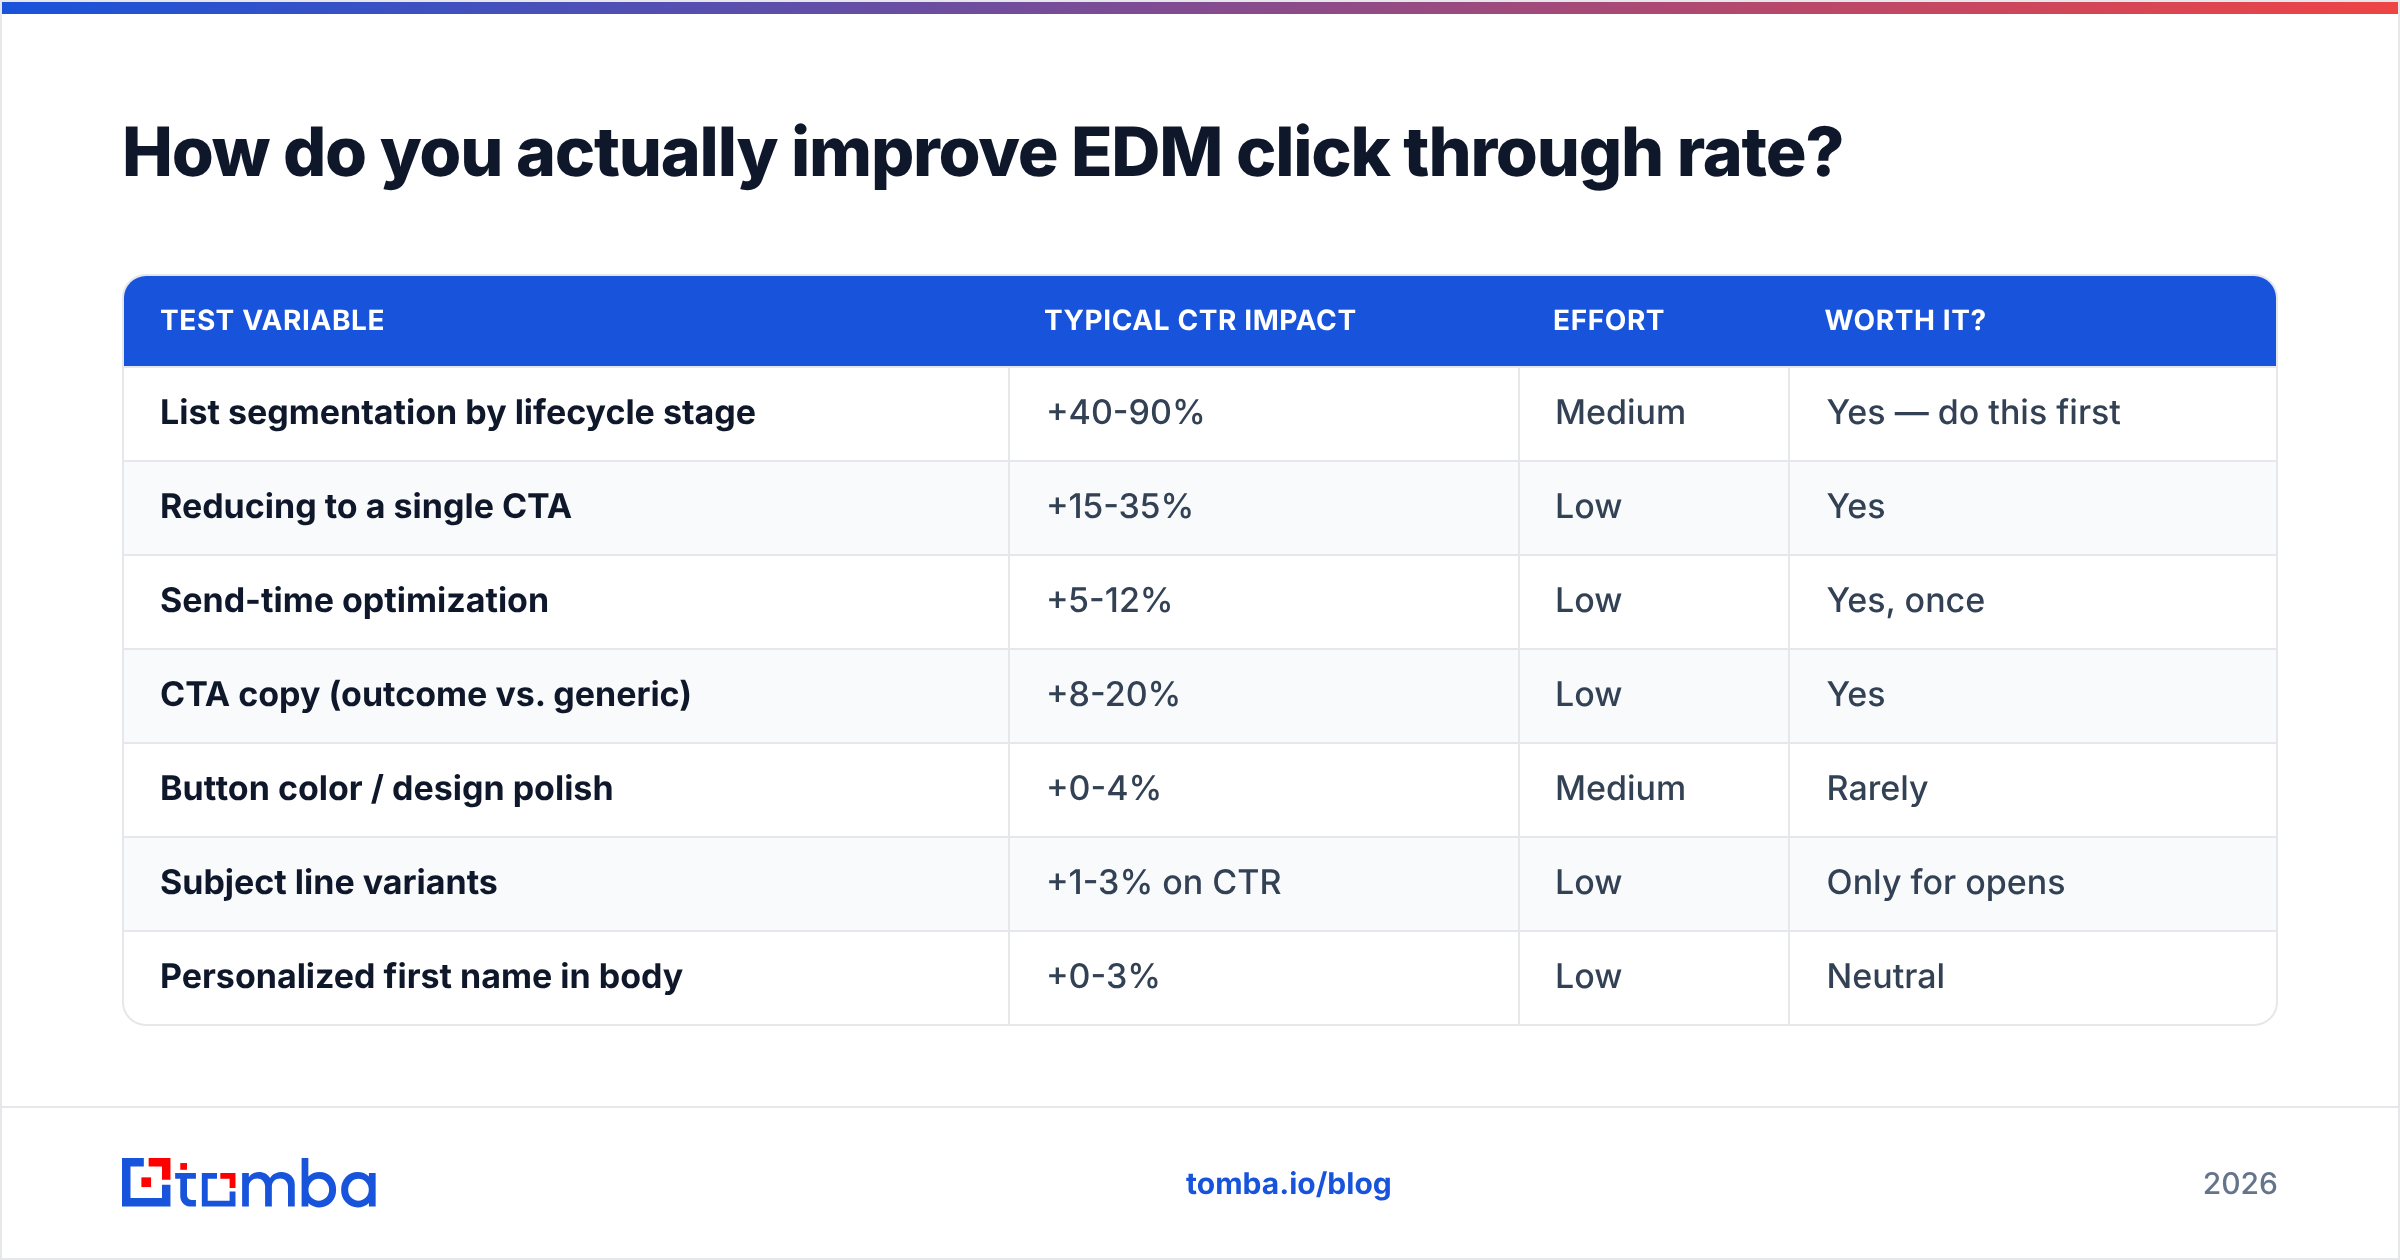
Subject line tests move opens. They barely move CTR, and with MPP noise the open signal you're optimizing is partly synthetic. Rank your test backlog like this:
| Test variable | Typical CTR impact | Effort | Worth it? |
|---|---|---|---|
| List segmentation by lifecycle stage | +40-90% | Medium | Yes — do this first |
| Reducing to a single CTA | +15-35% | Low | Yes |
| Send-time optimization | +5-12% | Low | Yes, once |
| CTA copy (outcome vs. generic) | +8-20% | Low | Yes |
| Button color / design polish | +0-4% | Medium | Rarely |
| Subject line variants | +1-3% on CTR | Low | Only for opens |
| Personalized first name in body | +0-3% | Low | Neutral |
Run tests on a minimum of 1,000 recipients per variant if you want a difference under 20% to be trustworthy. Below that, you're reading noise. G2's email marketing category data is a reasonable place to sanity-check whether your ESP can actually run a properly split test rather than a sequential one.
Attach clicks to revenue#
CTR that doesn't convert is vanity. Wire UTM parameters into every EDM link and push click events into your CRM so you can see which segments click and buy. If a segment clicks at 6% and converts at 0.1%, you've optimized for curiosity. Cut it. A segment clicking at 1.8% and converting at 4% is your real audience — send more to them, more often.
How does EDM CTR compare with cold outbound CTR?#
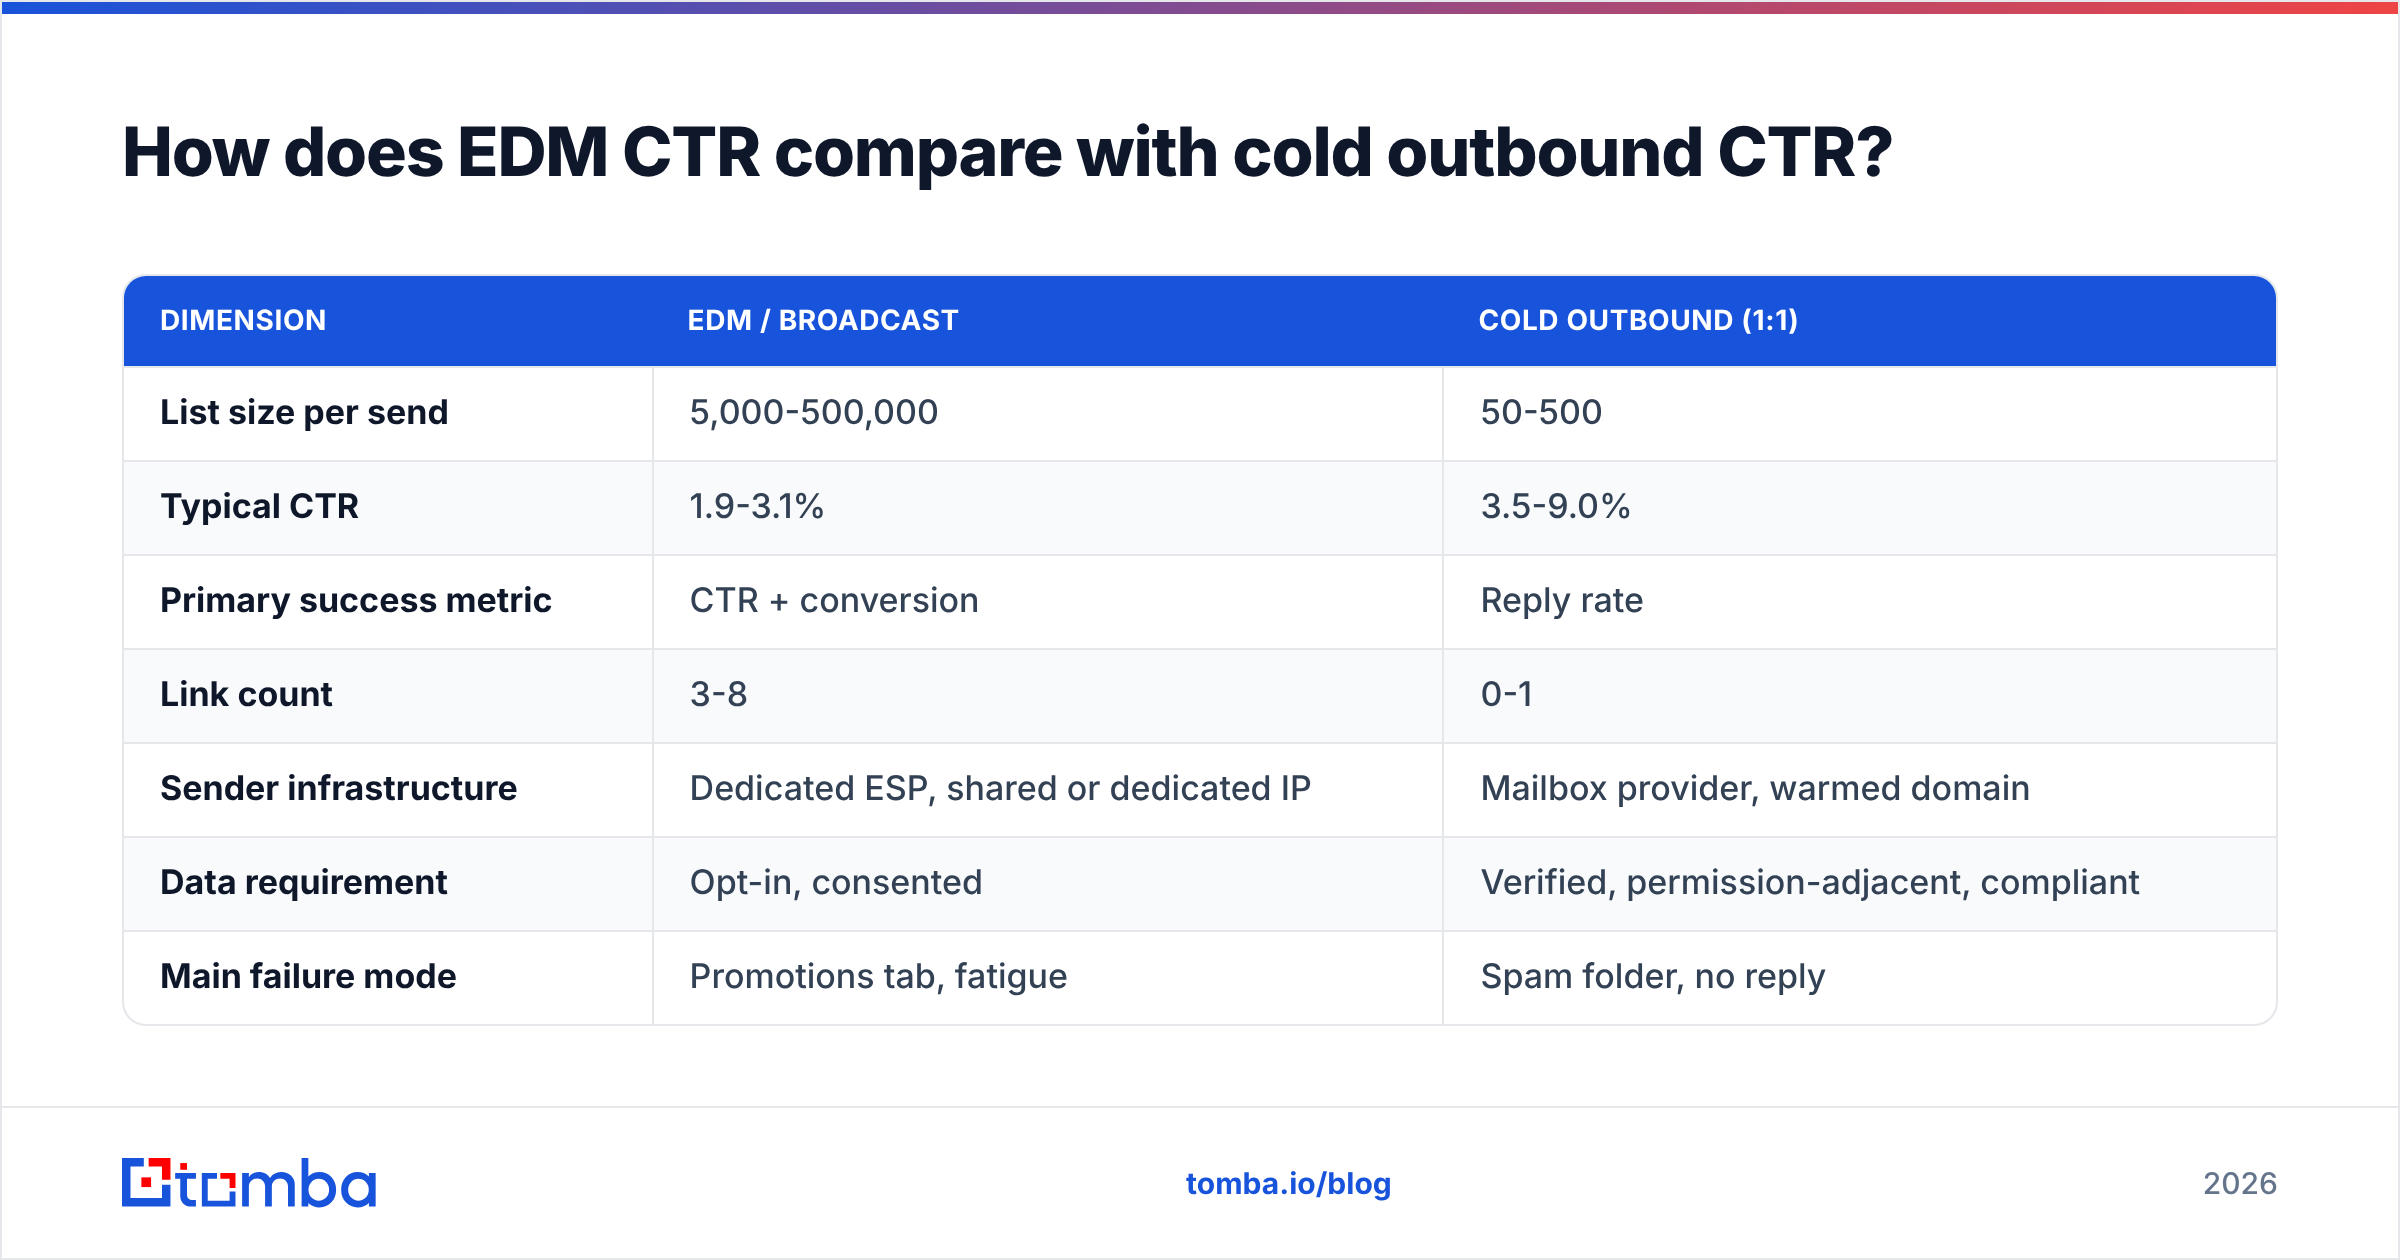
These are different games and shouldn't share a dashboard.
| Dimension | EDM / broadcast | Cold outbound (1:1) |
|---|---|---|
| List size per send | 5,000-500,000 | 50-500 |
| Typical CTR | 1.9-3.1% | 3.5-9.0% |
| Primary success metric | CTR + conversion | Reply rate |
| Link count | 3-8 | 0-1 |
| Sender infrastructure | Dedicated ESP, shared or dedicated IP | Mailbox provider, warmed domain |
| Data requirement | Opt-in, consented | Verified, permission-adjacent, compliant |
| Main failure mode | Promotions tab, fatigue | Spam folder, no reply |
The overlap is the data layer. Both fail identically when the addresses are wrong. Whether you're broadcasting to 80,000 or sequencing 200, verified contacts are the precondition, not an optimization.
If you run both motions, keep separate sending domains. A broadcast list with 15% unknowns will drag your cold outbound domain's sender reputation down with it, and you'll spend a quarter wondering why your 1:1 emails stopped landing.
What should you track weekly?#
Keep the dashboard to six numbers:
- Delivered rate — below 97%, stop and fix the list.
- Unique CTR (bot-filtered) — your headline number.
- CTOR — isolates creative performance from list performance.
- Click-to-conversion — proves the click was qualified.
- Unsubscribe + complaint rate — above 0.1% complaints, reduce frequency now.
- List decay rate — invalids found per verification run, tracked over time.
That sixth one is the one nobody tracks and everybody needs. If your quarterly verification pass is surfacing 8% invalids, your CTR ceiling is capped by data quality, and no amount of copy work will lift it.
Where does this leave you?#
Your EDM click through rate is a data-quality metric wearing a marketing costume. The creative work matters — one CTA, outcome-driven link text, mobile-first layout — but it operates on top of a list. A clean list with mediocre copy beats a decayed list with excellent copy, every time, and by a wider margin than most teams expect.
Start by measuring honestly: delivered as the denominator, unique clicks as the numerator, bot filtering on. Then fix the list. Then fix the email.
If your list is the bottleneck — and after a proper verification pass it usually is — start at the source. Tomba's Email Finder builds B2B contact lists from verified company domains rather than scraped guesses, with confidence scoring on every address so you know what you're sending to before you send it. The free tier gives you 25 searches a month to test your worst-performing segment; paid plans start at $49/mo on Tomba pricing with bulk processing and API access. Clean the denominator, and the click rate takes care of itself.
Related guides#
Ready to find emails that actually work?
Join 150,000+ professionals who stopped guessing and started sending. Free credits on signup — no credit card required.
Get the Tomba newsletter
Practical outbound tactics and product updates — once every two weeks.
About the author