EDM Open Rate Average in 2026: Benchmarks by Industry
The average EDM open rate now sits around 22% — but Apple's Mail Privacy Protection quietly inflated that number. Here are the real 2026 benchmarks by industry, plus the metrics worth tracking instead.
TL;DR
- The average EDM open rate across industries in 2026 lands between 19% and 24%, with government, education, and nonprofit senders at the top and retail/e-commerce near the bottom.
- That number is inflated by 8-15 percentage points for most lists because Apple Mail Privacy Protection and similar proxies pre-fetch tracking pixels whether or not a human ever looked at the message.
- Open rate is now a directional health signal, not a KPI. Click-to-open rate, reply rate, and unsubscribe rate carry the real information.
- List quality beats subject-line tinkering. A list with 12% dead addresses caps your realistic open rate before you write a single word.
- If your open rate dropped without a content change, look at authentication, bounce rate, and list decay — in that order.
What is an EDM open rate, and how is it actually calculated?#
EDM stands for electronic direct mail — the term used across APAC and Australian marketing teams for what North America usually calls email marketing: a designed, broadcast-style campaign sent to an opted-in list.
The open rate is simple arithmetic with a messy denominator:
Open rate = (unique opens / emails delivered) × 100Two details decide whether your number means anything:
- Delivered, not sent. If your platform divides by sent, every hard bounce drags the rate down. Most modern ESPs use delivered. Check yours before comparing against any benchmark.
- Unique, not total. Total opens counts the same subscriber reopening a message three times. Unique counts them once. Benchmarks are almost always unique.
The measurement itself is a 1×1 transparent tracking pixel embedded in the HTML. When the recipient's client loads images, the pixel request hits your ESP's server and gets logged as an open. That mechanism — a request for a remote image — is exactly why the metric has degraded. A plain-text email cannot be tracked at all. An image-blocking client registers zero opens from an engaged reader. And a privacy proxy registers an open from someone who never woke their phone.
Anyone quoting an open rate without stating which of those conditions applies is quoting noise. The Open rate entry on Wikipedia has covered this caveat since long before privacy proxies made it acute.
What is the average EDM open rate in 2026?#
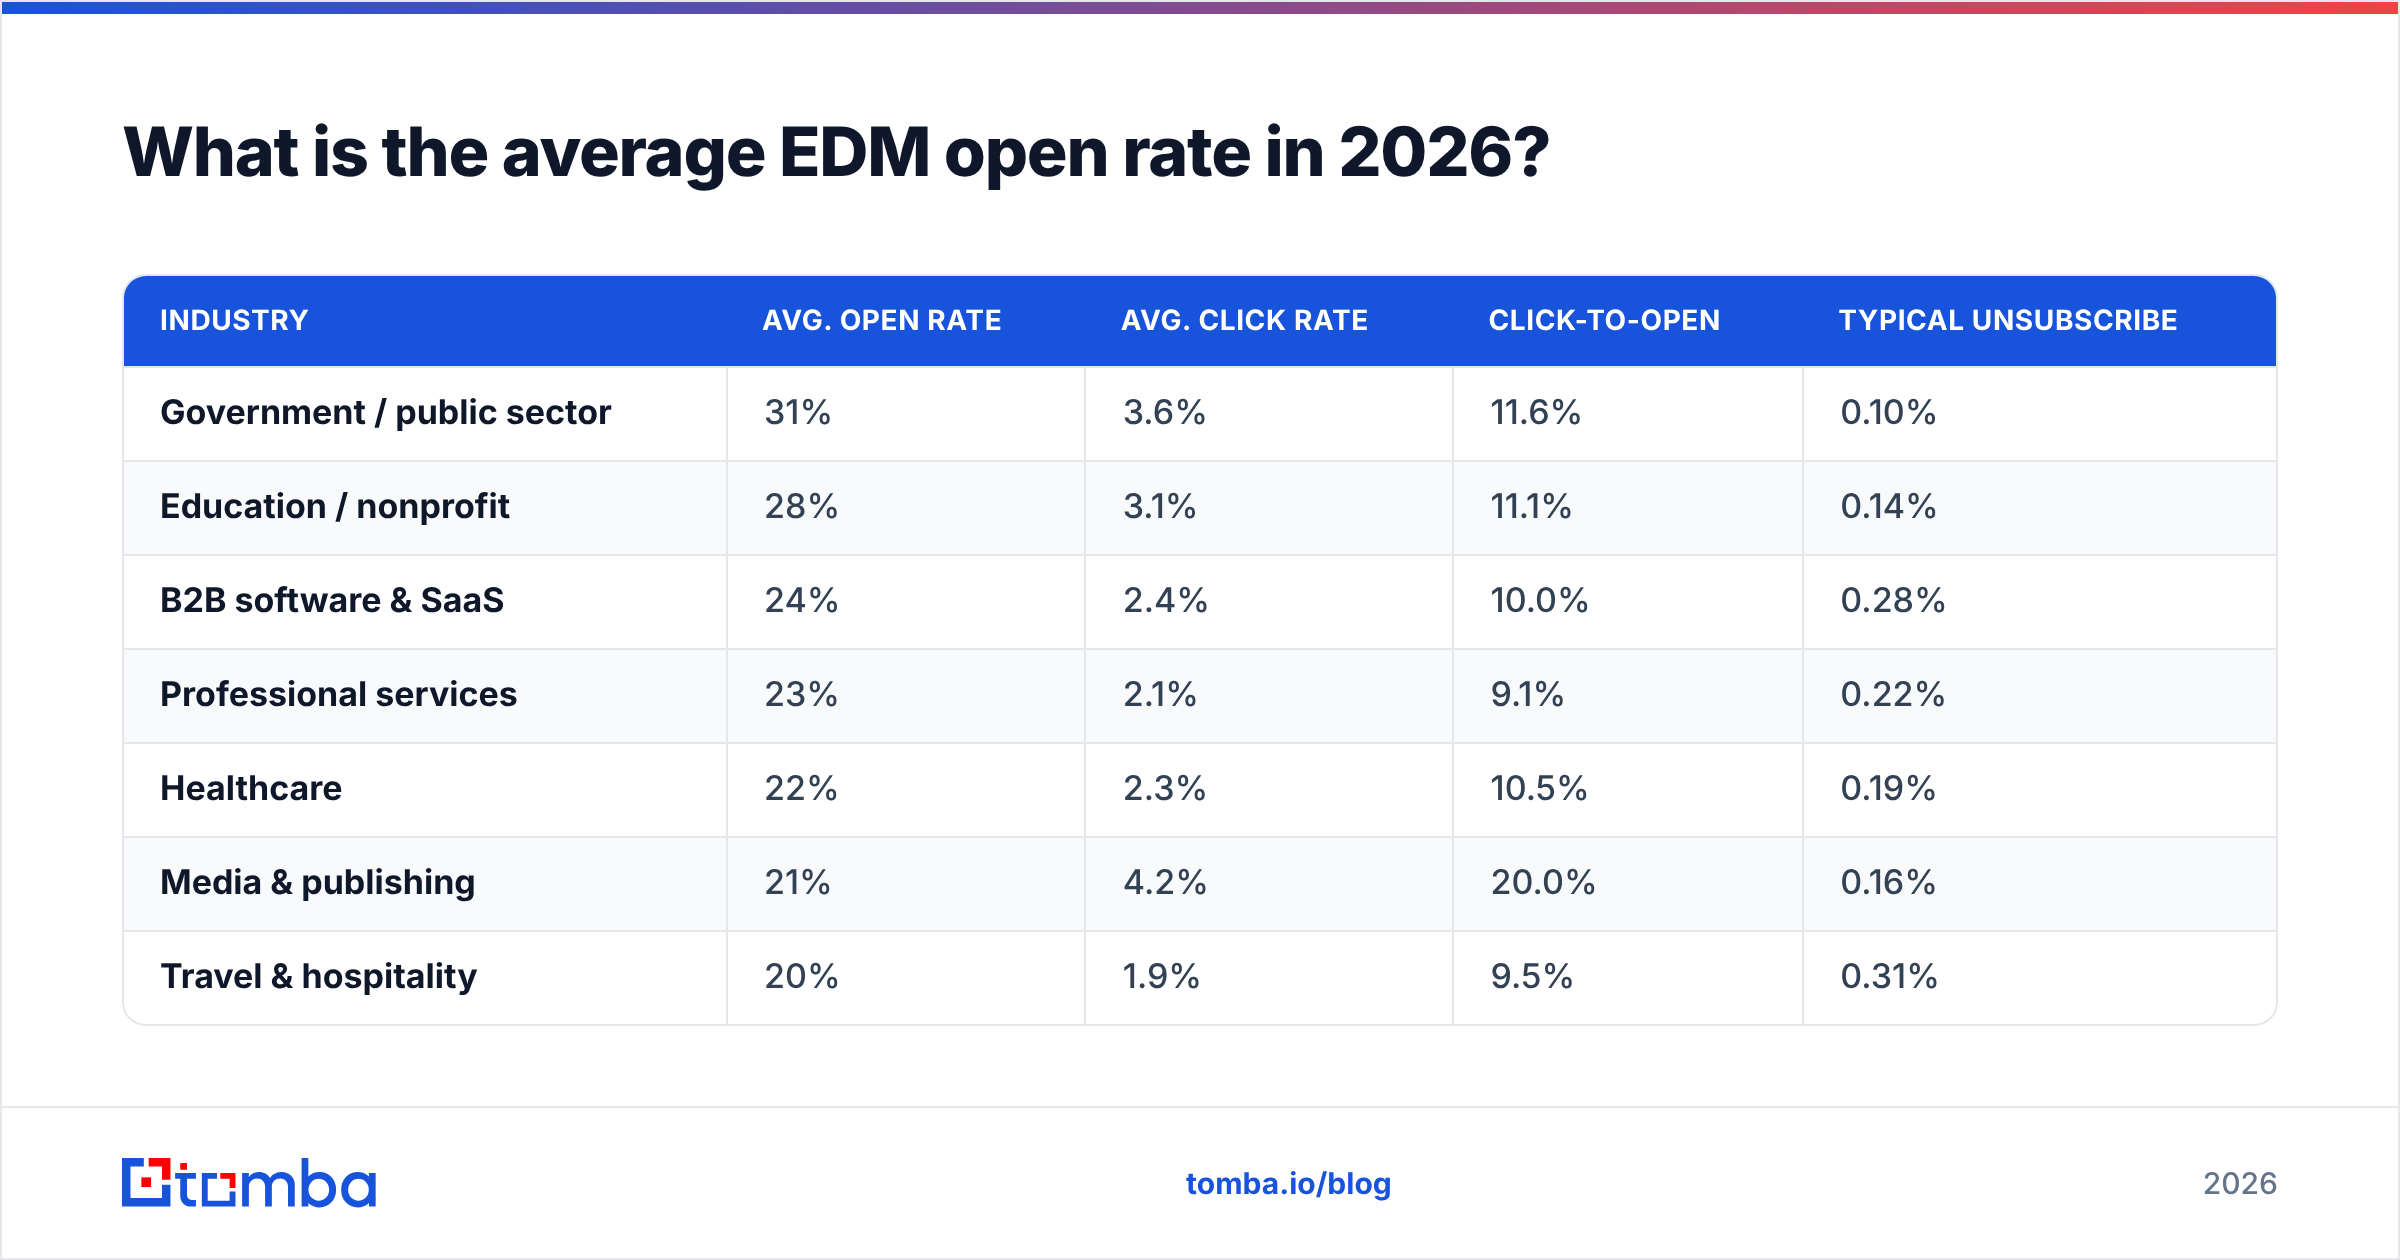
Across aggregated ESP reporting, the blended average sits at roughly 22%, with a median closer to 21%. But blended averages hide more than they reveal — a B2B SaaS newsletter and a flash-sale retail blast are not playing the same game.
| Industry | Avg. open rate | Avg. click rate | Click-to-open | Typical unsubscribe |
|---|---|---|---|---|
| Government / public sector | 31% | 3.6% | 11.6% | 0.10% |
| Education / nonprofit | 28% | 3.1% | 11.1% | 0.14% |
| B2B software & SaaS | 24% | 2.4% | 10.0% | 0.28% |
| Professional services | 23% | 2.1% | 9.1% | 0.22% |
| Healthcare | 22% | 2.3% | 10.5% | 0.19% |
| Media & publishing | 21% | 4.2% | 20.0% | 0.16% |
| Travel & hospitality | 20% | 1.9% | 9.5% | 0.31% |
| Retail / e-commerce | 18% | 1.6% | 8.9% | 0.35% |
Read these as ranges, not targets. Mailchimp publishes similar cuts in its email marketing benchmarks, and HubSpot's marketing statistics library tracks the same directional pattern: transactional-adjacent and mission-driven senders outperform promotional senders by 8-12 points, consistently, across every year anyone has measured.
Three structural factors explain most of the spread:
- Send frequency. A weekly sender averages higher opens than a daily sender to the same list. Daily senders trade open rate for total volume — often correctly.
- List acquisition source. Double opt-in lists open 10-15 points higher than co-registration or lead-magnet lists. The subscriber remembers asking.
- Recipient device mix. Lists skewing heavily toward Apple Mail report inflated opens. Lists dominated by Outlook desktop with image blocking on report deflated opens.
Why did open rates suddenly jump after Apple's privacy changes?#
Because Apple started opening your email for people who never did.
Mail Privacy Protection routes messages through a proxy that pre-loads all remote content — including your tracking pixel — before the user ever taps the notification. Every MPP-enabled recipient registers as an open on delivery. Gmail's image caching does something similar, though less aggressively, and corporate security gateways that scan links and images add another layer of phantom activity.
The practical consequences:
- If 40% of your list uses Apple Mail with MPP on, and half of those would not have opened organically, your reported rate overstates human opens by roughly 20 percentage points.
- Open-based automations break. "Didn't open in 3 days → resend with new subject" now excludes people who genuinely ignored you.
- Open-based segmentation degrades. Your "most engaged" segment fills with proxy traffic.
- Time-of-open data is worthless for MPP recipients — the timestamp reflects proxy fetch, not human behavior.
The honest response is not to stop measuring opens. It is to stop treating them as a conversion metric. Track opens as a trend line against your own baseline: a sudden 30% drop still tells you something broke — usually authentication or reputation — even if the absolute value is fiction.
How do EDM open rates compare to cold email open rates?#
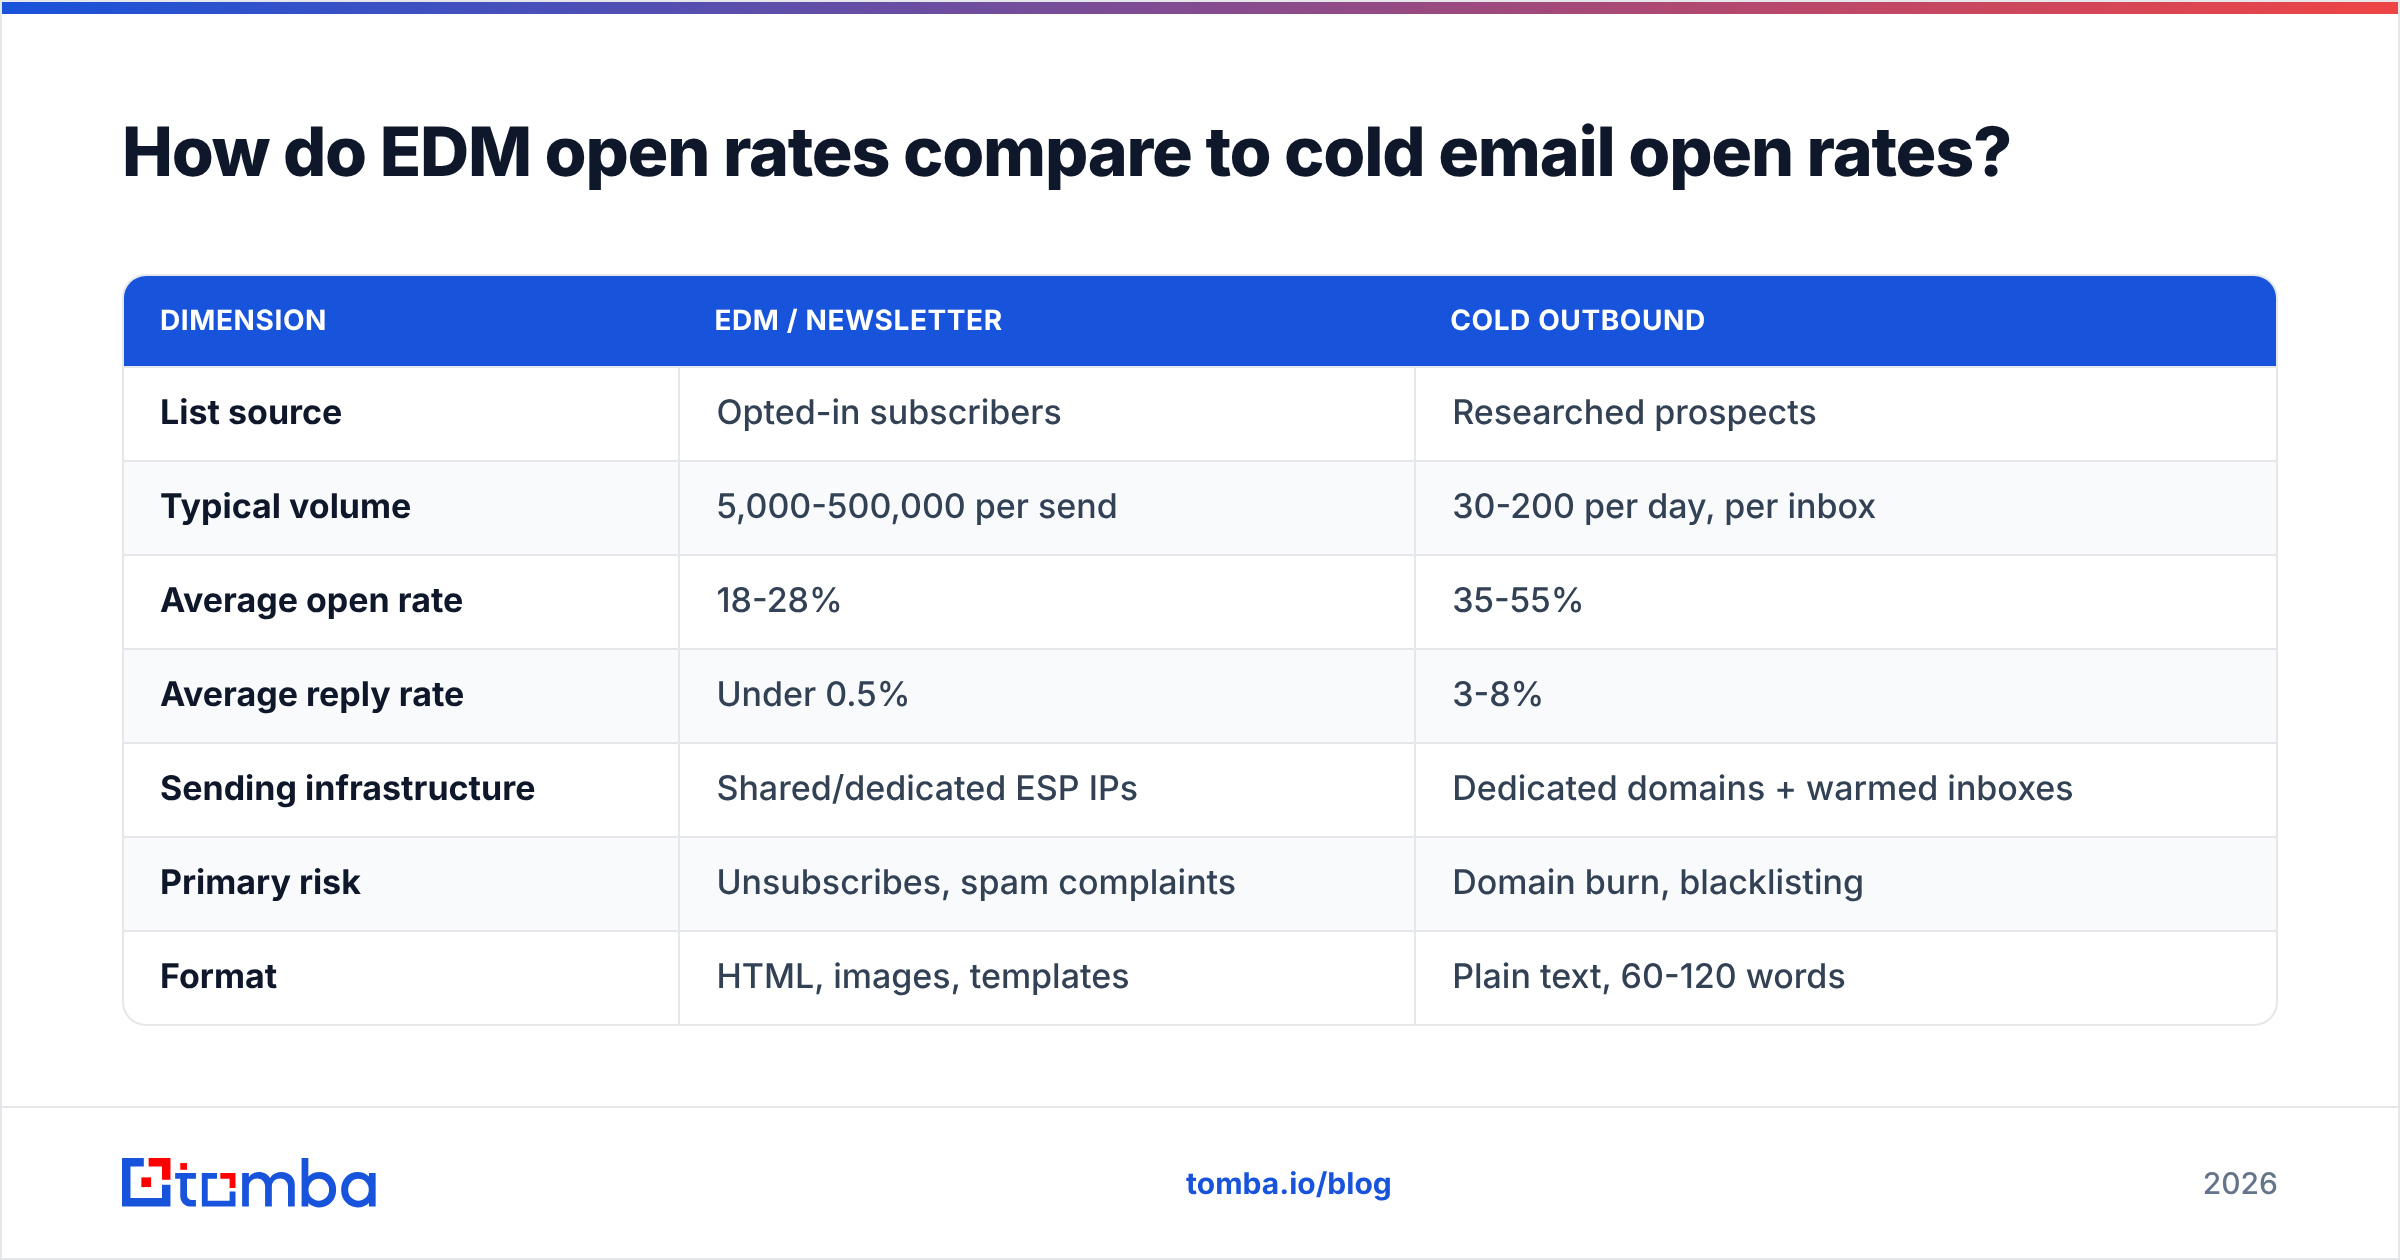
They are different animals with different physics, and mixing their benchmarks is the single most common reporting error I see.
| Dimension | EDM / newsletter | Cold outbound |
|---|---|---|
| List source | Opted-in subscribers | Researched prospects |
| Typical volume | 5,000-500,000 per send | 30-200 per day, per inbox |
| Average open rate | 18-28% | 35-55% |
| Average reply rate | Under 0.5% | 3-8% |
| Sending infrastructure | Shared/dedicated ESP IPs | Dedicated domains + warmed inboxes |
| Primary risk | Unsubscribes, spam complaints | Domain burn, blacklisting |
| Format | HTML, images, templates | Plain text, 60-120 words |
| Success metric | Click-to-open rate | Positive reply rate |
Cold email posts higher open rates for two reasons that have nothing to do with better copy. First, plain-text sends land in the Primary tab far more often than image-heavy HTML. Second, the volumes are small enough that per-inbox reputation stays clean.
The trap: an agency benchmarks a client's 20% newsletter open rate against a 45% cold-outbound figure from a case study and declares the newsletter broken. It isn't. A 20% opt-in newsletter with a 12% click-to-open rate is performing well.
What actually moves your EDM open rate?#
In rough order of leverage, based on what changes when you fix each one:
- List hygiene. Dead addresses bounce, bounces damage reputation, and damaged reputation lands the rest of your list in spam. A list with 10%+ invalid contacts caps your ceiling before copy matters. Run every list through an email verifier before a large send — especially lists older than six months, which decay at roughly 22-30% per year as people change jobs.
- Authentication. SPF, DKIM, and DMARC are table stakes at Google and Yahoo for bulk senders. Missing or misaligned records don't lower your open rate gently — they route you to spam wholesale. A quick SPF record check costs two minutes and prevents the most expensive failure mode in email.
- Sender name recognition. "Sarah at Northwind" beats "Northwind Marketing Team" in nearly every A/B test worth running. Recipients scan the from-line before the subject line.
- Subject line specificity. Not cleverness — specificity. "Your Q3 usage report is ready" outperforms "Big news inside!" because it makes a checkable promise. Run candidates through a subject line tester before committing a 50,000-recipient send.
- Send cadence consistency. Subscribers who expect you on Tuesday morning open on Tuesday morning. Irregular senders get filtered as unfamiliar.
- Preheader text. The most under-used real estate in email. Mobile clients show 35-90 characters of it. Leaving it as "View in browser" wastes an entire second headline.
Notice that four of the six are infrastructure and list decisions, not creative ones. That ratio matches what actually happens when teams try to lift a stuck open rate: the copy rewrite moves it 1-2 points, and the list cleanup moves it 6-9.
Which metrics should replace open rate on your dashboard?#
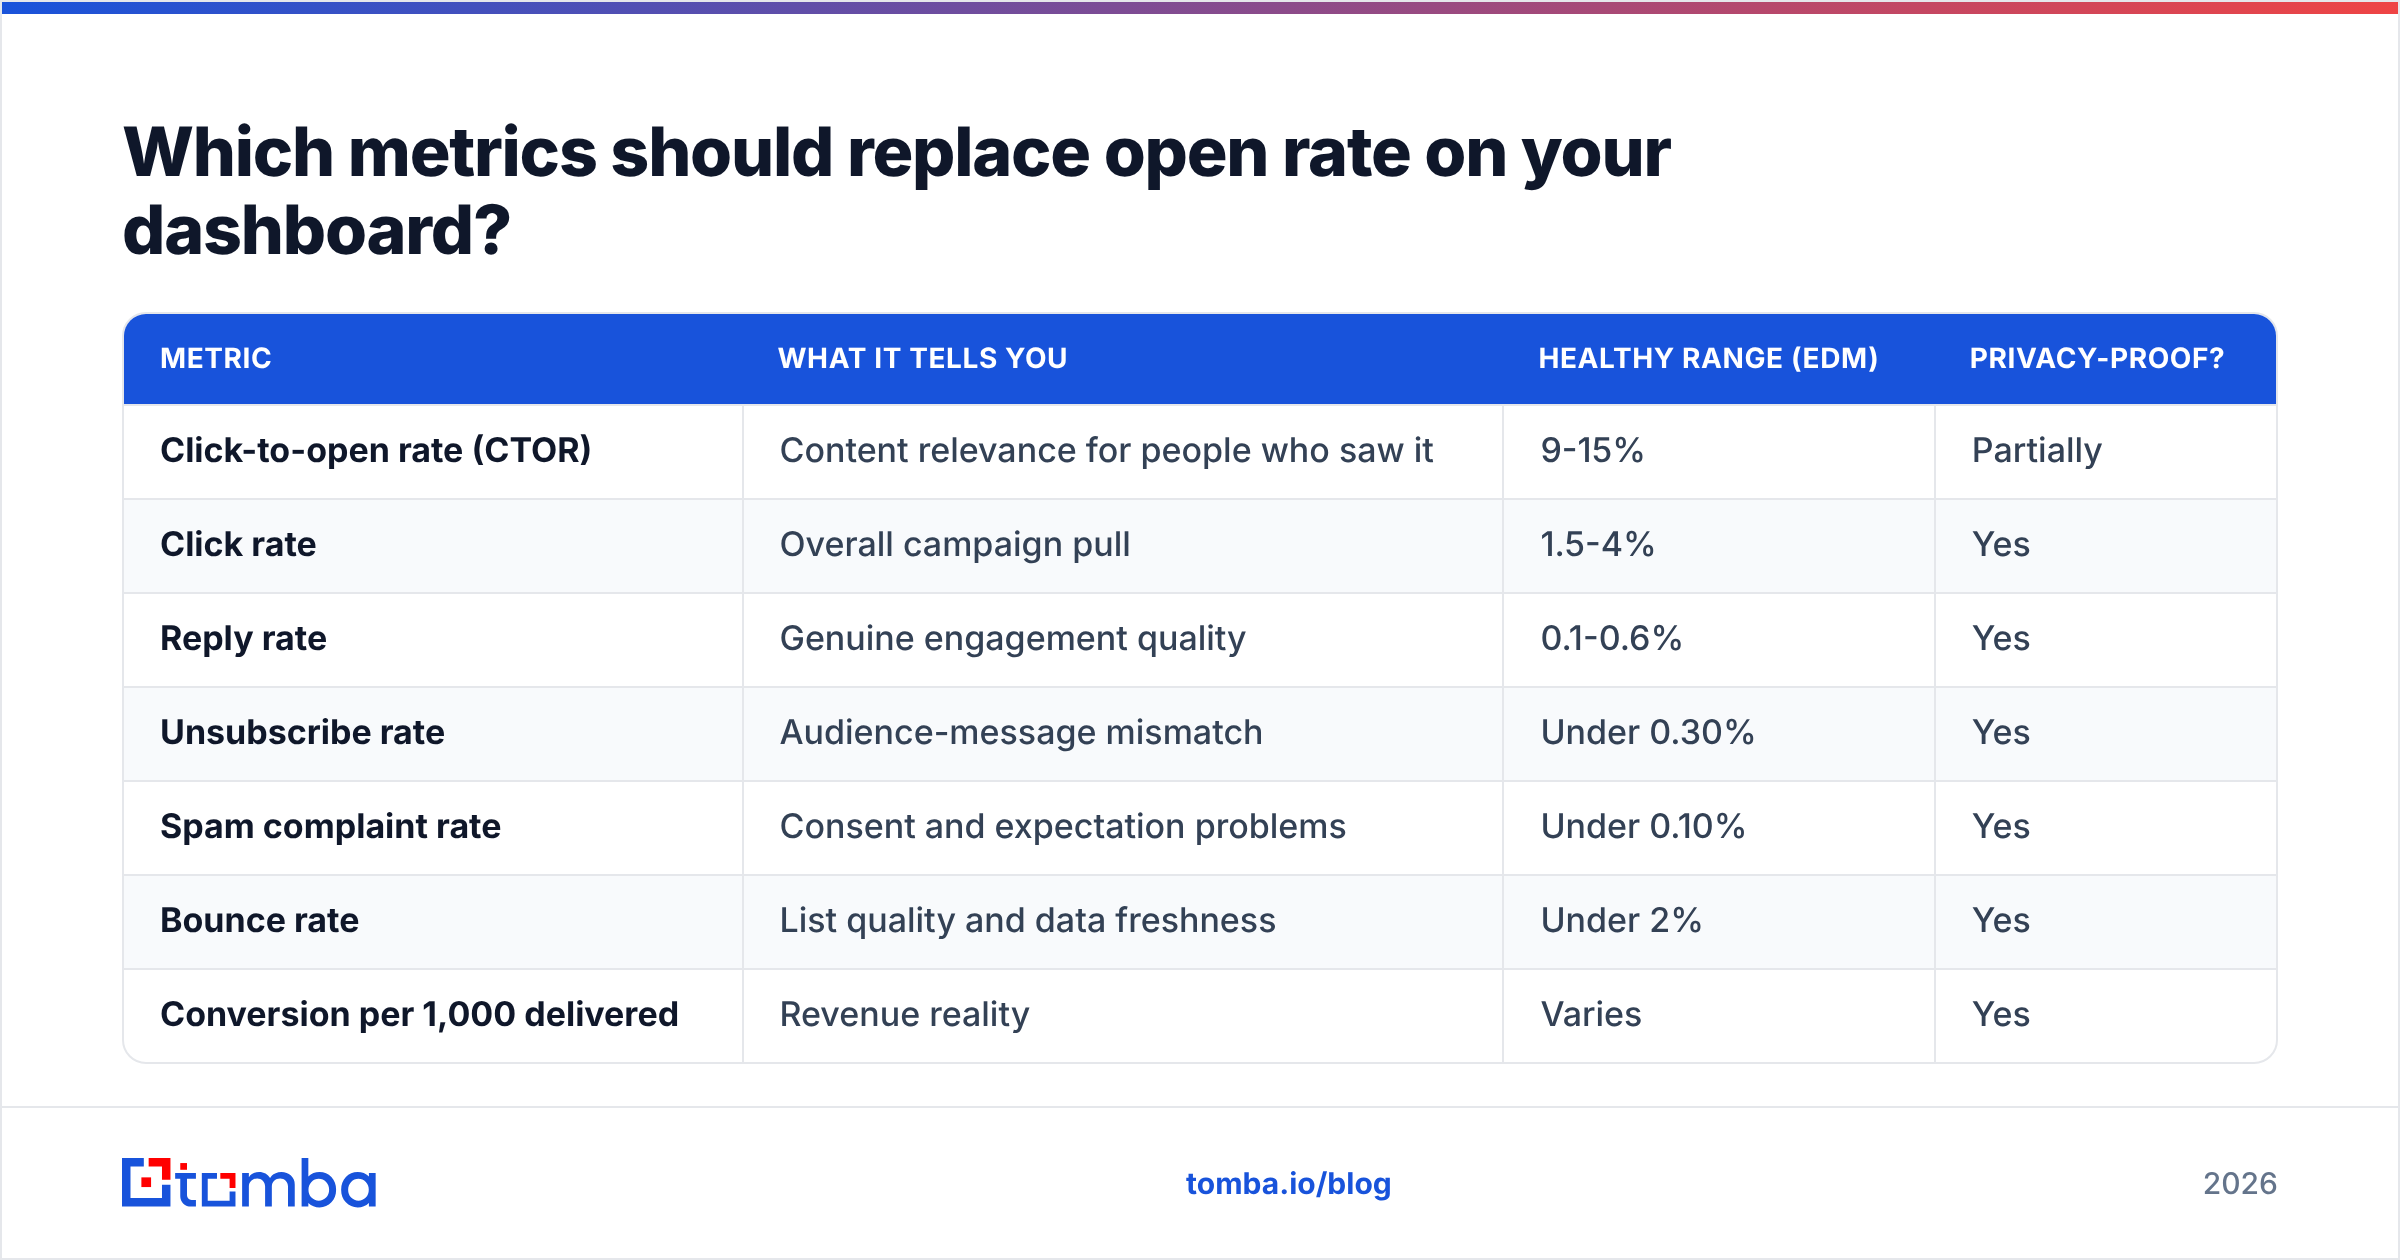
Keep the open rate visible — demote it. Promote these:
| Metric | What it tells you | Healthy range (EDM) | Privacy-proof? |
|---|---|---|---|
| Click-to-open rate (CTOR) | Content relevance for people who saw it | 9-15% | Partially |
| Click rate | Overall campaign pull | 1.5-4% | Yes |
| Reply rate | Genuine engagement quality | 0.1-0.6% | Yes |
| Unsubscribe rate | Audience-message mismatch | Under 0.30% | Yes |
| Spam complaint rate | Consent and expectation problems | Under 0.10% | Yes |
| Bounce rate | List quality and data freshness | Under 2% | Yes |
| Conversion per 1,000 delivered | Revenue reality | Varies | Yes |
CTOR is the practical workhorse. Because both numerator and denominator inherit the same proxy inflation, the ratio stays roughly comparable across time even when the raw numbers drift. If your CTOR is falling while opens hold steady, your content is losing relevance — no other metric surfaces that as cleanly.
Spam complaint rate deserves a hard threshold, not a range. Google and Yahoo both treat 0.30% as a red line for bulk senders and 0.10% as the target. Cross it and open rate becomes irrelevant, because you're not in the inbox at all. Anyone unfamiliar with the mechanics should start with the fundamentals of email deliverability before tuning creative.
How do you audit an underperforming EDM list?#
Work from infrastructure outward. Most teams do the reverse and waste a quarter on subject-line tests.
Step 1 — Confirm delivery, not opens. Pull your bounce and complaint rates first. Bounce above 3% or complaints above 0.15% means the problem is upstream of anything you write.
Step 2 — Check authentication alignment. SPF pass, DKIM signed with your sending domain, DMARC policy published. Misalignment is common after an ESP migration and invisible until volume climbs.
Step 3 — Segment by list age. Split by subscription date: 0-6 months, 6-18 months, 18+ months. If the oldest cohort opens at a third of the newest, you have decay, not a content problem. Sunset or re-permission that cohort.
Step 4 — Verify and re-enrich. Run the full list through validation, remove hard invalids, and quarantine catch-all domains for separate handling — those need a catch-all verifier rather than standard SMTP checks, since the server accepts everything regardless of whether the mailbox exists.
Step 5 — Rebuild the contactable core. For B2B lists specifically, a meaningful share of "dead" addresses are live people at new companies. Re-finding a current work address for a known contact recovers a subscriber who already knows your brand — a far better prospect than a cold name. That is where a bulk email finder does more for your open rate than any subject-line generator will.
Step 6 — Only now, test creative. With a clean list and clean authentication, subject-line and send-time tests produce signal instead of noise.
What open rate should you actually target?#
Set the target against your own trailing 90-day baseline, segmented, not against an industry average pulled from a blog post — including this one.
A workable framework:
- Below 15%: something is structurally wrong. Audit deliverability and list quality before touching creative.
- 15-25%: normal range for most promotional EDM programs. Optimize CTOR here, not opens.
- 25-35%: strong. Your list is well-qualified and expects you. Protect it — don't scale volume carelessly.
- Above 40% on a large list: verify before celebrating. Either your list is unusually engaged, or proxy inflation is doing the work.
The most useful number in that list is the one you measure against yourself. A 19% open rate that has held steady for eight quarters on a growing list is a healthier program than a 34% rate on a list that shrinks every month.
Where should you start?#
Fix the list before you fix the copy. Open rate is downstream of who is actually reachable — every point of invalid data becomes a bounce, every bounce becomes reputation damage, and reputation damage becomes the spam folder for people who would have opened.
If you're rebuilding a decayed B2B list or filling gaps left after a verification pass, start with the Tomba Email Finder. It finds current professional addresses by domain, name, or company, and pairs with built-in verification so contacts enter your ESP already validated rather than bouncing on send. The free tier covers 25 searches a month to test against a sample of your list; paid plans start at $49/mo, with Growth at $99/mo and Pro at $249/mo — full Tomba pricing is public, no demo call required.
Clean the data, then argue about subject lines.
Related guides#
Ready to find emails that actually work?
Join 150,000+ professionals who stopped guessing and started sending. Free credits on signup — no credit card required.
Get the Tomba newsletter
Practical outbound tactics and product updates — once every two weeks.
About the author