Email Analytics Software in 2026: Metrics, Tools, and Setup
Open rates stopped being honest years ago. Here's what email analytics software can still measure reliably in 2026, which tools do it best, and how to build a reporting stack that survives a CFO's questions.
TL;DR
- Email analytics software measures what happens after send: delivery, engagement, replies, and revenue attribution. The measurement quality varies wildly by metric.
- Open rate has been structurally broken since Apple Mail Privacy Protection started pre-fetching pixels. Treat it as a directional signal, never a KPI.
- The metrics that still hold up: delivered rate, bounce rate, reply rate, click-to-reply ratio, spam complaint rate, and pipeline created per 1,000 sends.
- Tool choice depends on whether you send marketing broadcasts (Mailchimp, HubSpot, Klaviyo), cold outbound sequences (Instantly, Smartlead, Saleshandy), or transactional volume (SendGrid, Postmark).
- Bad list data corrupts every downstream number. Verifying before send is the cheapest analytics upgrade you will ever buy.
What is email analytics software?#
Email analytics software is any tool that captures, aggregates, and reports on the events an email generates after it leaves your outbox — accepted, delivered, bounced, opened, clicked, replied, unsubscribed, complained, converted.
Think of it like a delivery-tracking app for parcels. The courier scans the package at each hop, and you get a timeline. Email works the same way: your sending platform records SMTP responses and webhook events, then rolls them into a dashboard. The difference is that some of those scans are now performed by robots that never touched the package — which is exactly why 2026 reporting requires more care than 2019 reporting did.
Most teams end up with analytics from three overlapping places:
- The sending platform — your ESP or sequencer reports its own events (Instantly, HubSpot, Mailchimp, Outreach).
- The inbox provider — Google Postmaster Tools and Microsoft SNDS report spam rates, reputation, and authentication pass rates from the receiving side.
- The CRM — HubSpot or Salesforce ties an email touch to a deal, which is the only place revenue attribution can actually live.
If you only look at the first one, you are grading your own homework.
Which email metrics still mean anything in 2026?#
Here is the honest hierarchy, ordered from most trustworthy to least.
- Delivered rate (accepted / sent). The most reliable number in the stack because it comes from an SMTP response, not a tracking pixel. Below 95% means a data problem or a reputation problem, and you should stop sending until you know which.
- Hard bounce rate. Also SMTP-derived, also honest. Above 3% and mailbox providers start throttling you. Above 5% and you are actively burning the domain.
- Reply rate. A human typed words back. There is no way to fake this, no privacy proxy that inflates it. For outbound, this is the KPI.
- Spam complaint rate. Reported by Google Postmaster and Microsoft SNDS. Google's stated threshold is 0.3%; realistically you want to stay under 0.1%.
- Click rate. Partially reliable. Bots and security scanners click links, so filter out clicks that fire within two seconds of an "open" from the same IP block.
- Open rate. Structurally inflated. Apple Mail Privacy Protection pre-loads images through a proxy, so an Apple Mail recipient registers an open whether or not a human ever looked. On lists skewed toward consumer or exec Apple Mail users, reported opens can run 20-40 points above reality.
The practical rule: use opens for relative comparison inside a single campaign against a single audience segment (subject line A vs B, same day, same list), and never in a board deck.
What are the categories of email analytics software?#
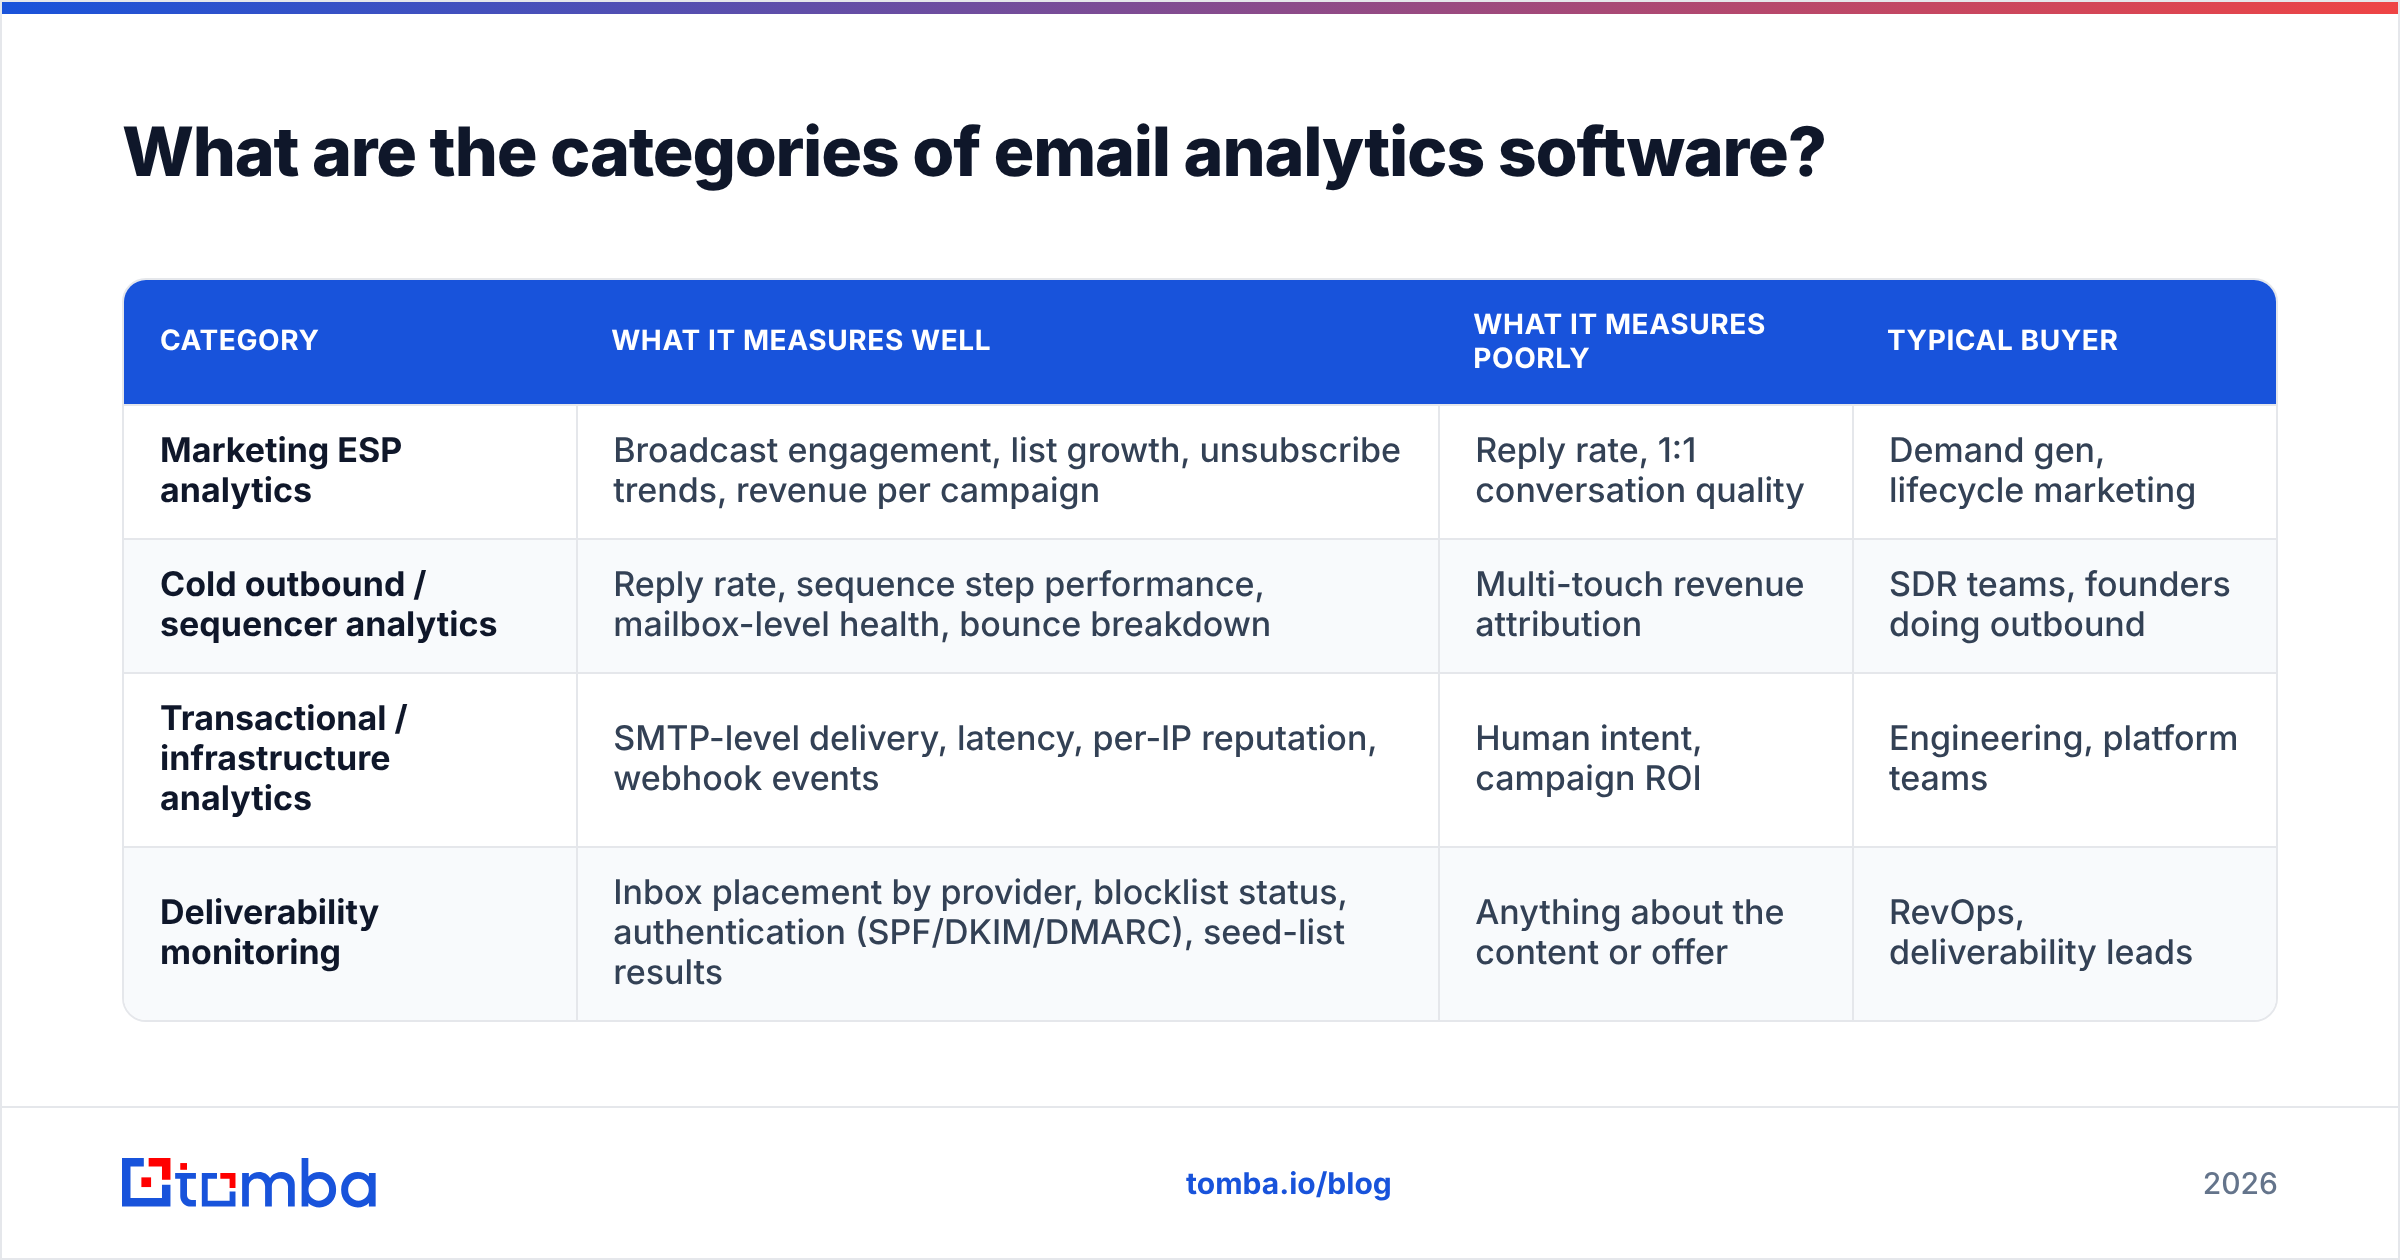
Different sending motions produce different event streams, so the tooling splits cleanly into four buckets.
| Category | What it measures well | What it measures poorly | Typical buyer |
|---|---|---|---|
| Marketing ESP analytics | Broadcast engagement, list growth, unsubscribe trends, revenue per campaign | Reply rate, 1:1 conversation quality | Demand gen, lifecycle marketing |
| Cold outbound / sequencer analytics | Reply rate, sequence step performance, mailbox-level health, bounce breakdown | Multi-touch revenue attribution | SDR teams, founders doing outbound |
| Transactional / infrastructure analytics | SMTP-level delivery, latency, per-IP reputation, webhook events | Human intent, campaign ROI | Engineering, platform teams |
| Deliverability monitoring | Inbox placement by provider, blocklist status, authentication (SPF/DKIM/DMARC), seed-list results | Anything about the content or offer | RevOps, deliverability leads |
Most serious senders run one tool from bucket 1 or 2 plus one from bucket 4. Running two tools from the same bucket is how you end up with two dashboards that disagree and a weekly argument about which is right.
How do the main email analytics tools compare?#
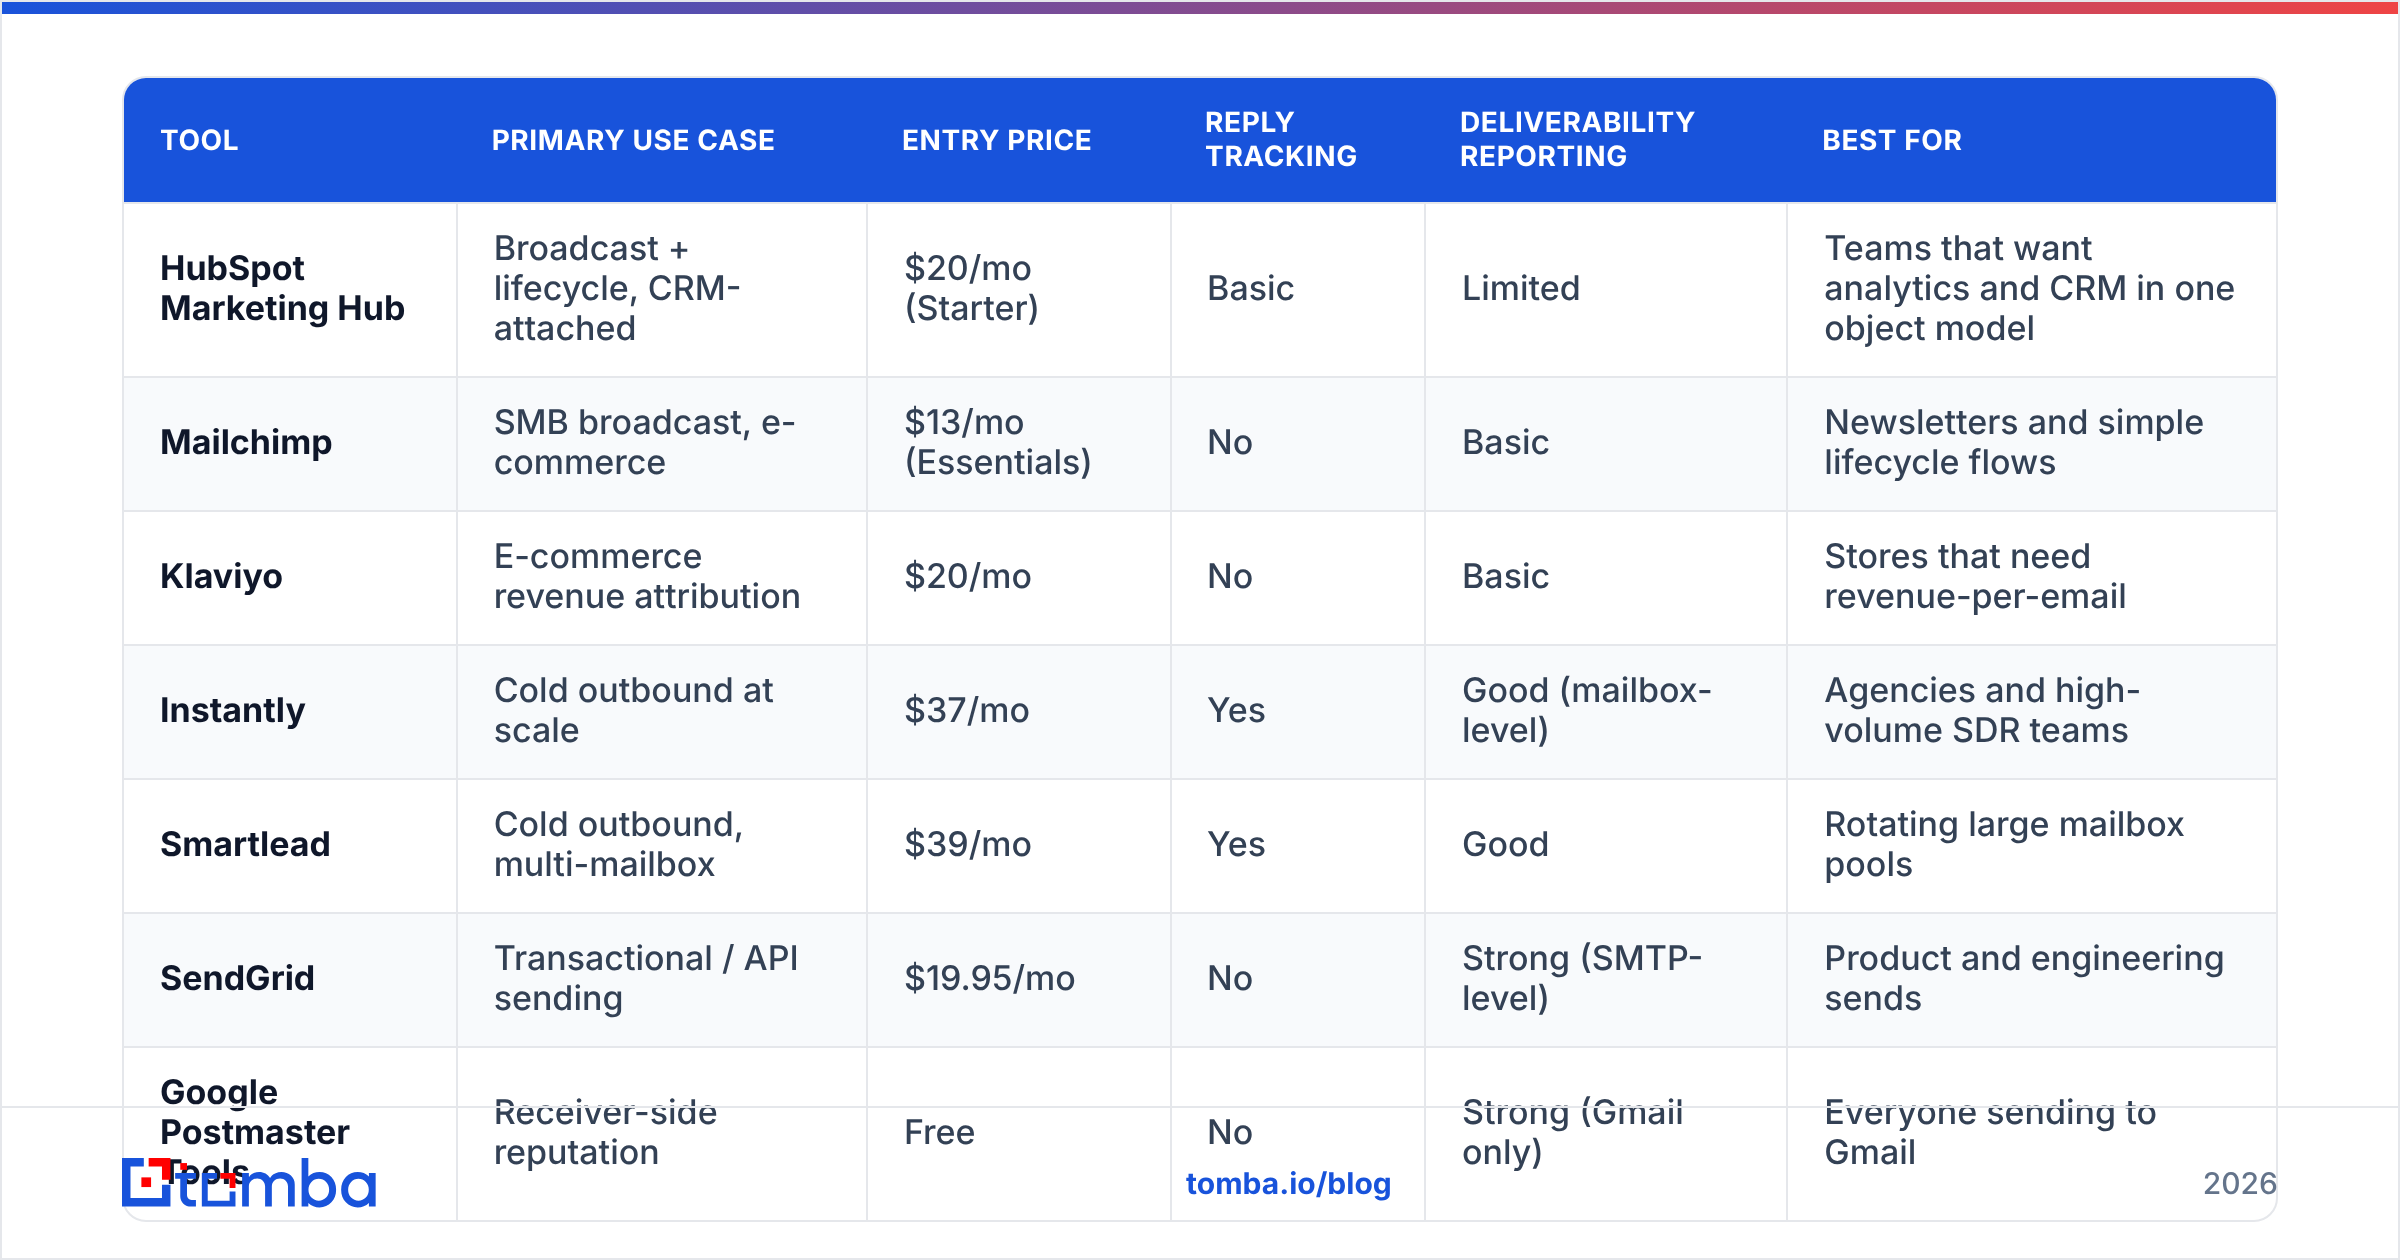
Prices below are published list prices as of mid-2026 for the entry paid tier; every vendor has volume-based escalators, so confirm on the vendor page before you budget.
| Tool | Primary use case | Entry price | Reply tracking | Deliverability reporting | Best for |
|---|---|---|---|---|---|
| HubSpot Marketing Hub | Broadcast + lifecycle, CRM-attached | $20/mo (Starter) | Basic | Limited | Teams that want analytics and CRM in one object model |
| Mailchimp | SMB broadcast, e-commerce | $13/mo (Essentials) | No | Basic | Newsletters and simple lifecycle flows |
| Klaviyo | E-commerce revenue attribution | $20/mo | No | Basic | Stores that need revenue-per-email |
| Instantly | Cold outbound at scale | $37/mo | Yes | Good (mailbox-level) | Agencies and high-volume SDR teams |
| Smartlead | Cold outbound, multi-mailbox | $39/mo | Yes | Good | Rotating large mailbox pools |
| SendGrid | Transactional / API sending | $19.95/mo | No | Strong (SMTP-level) | Product and engineering sends |
| Google Postmaster Tools | Receiver-side reputation | Free | No | Strong (Gmail only) | Everyone sending to Gmail |
Two notes people miss. First, the sequencers in this table report reply rate natively because reply detection is their whole value proposition; the marketing ESPs mostly do not, because broadcast email was never meant to be replied to. Second, Postmaster Tools is free, takes twenty minutes to set up with a DNS TXT record, and gives you the only spam-complaint number Gmail will ever admit to. If you send to Gmail and you have not connected it, that is your highest-ROI next action. You can browse the current email marketing category on G2 for a broader vendor field, and HubSpot's email product docs if CRM-attached reporting is your priority.
Why does your analytics dashboard look worse than your actual performance?#
Usually because the denominator is contaminated. Every rate metric is a fraction, and list quality quietly wrecks both halves of it.
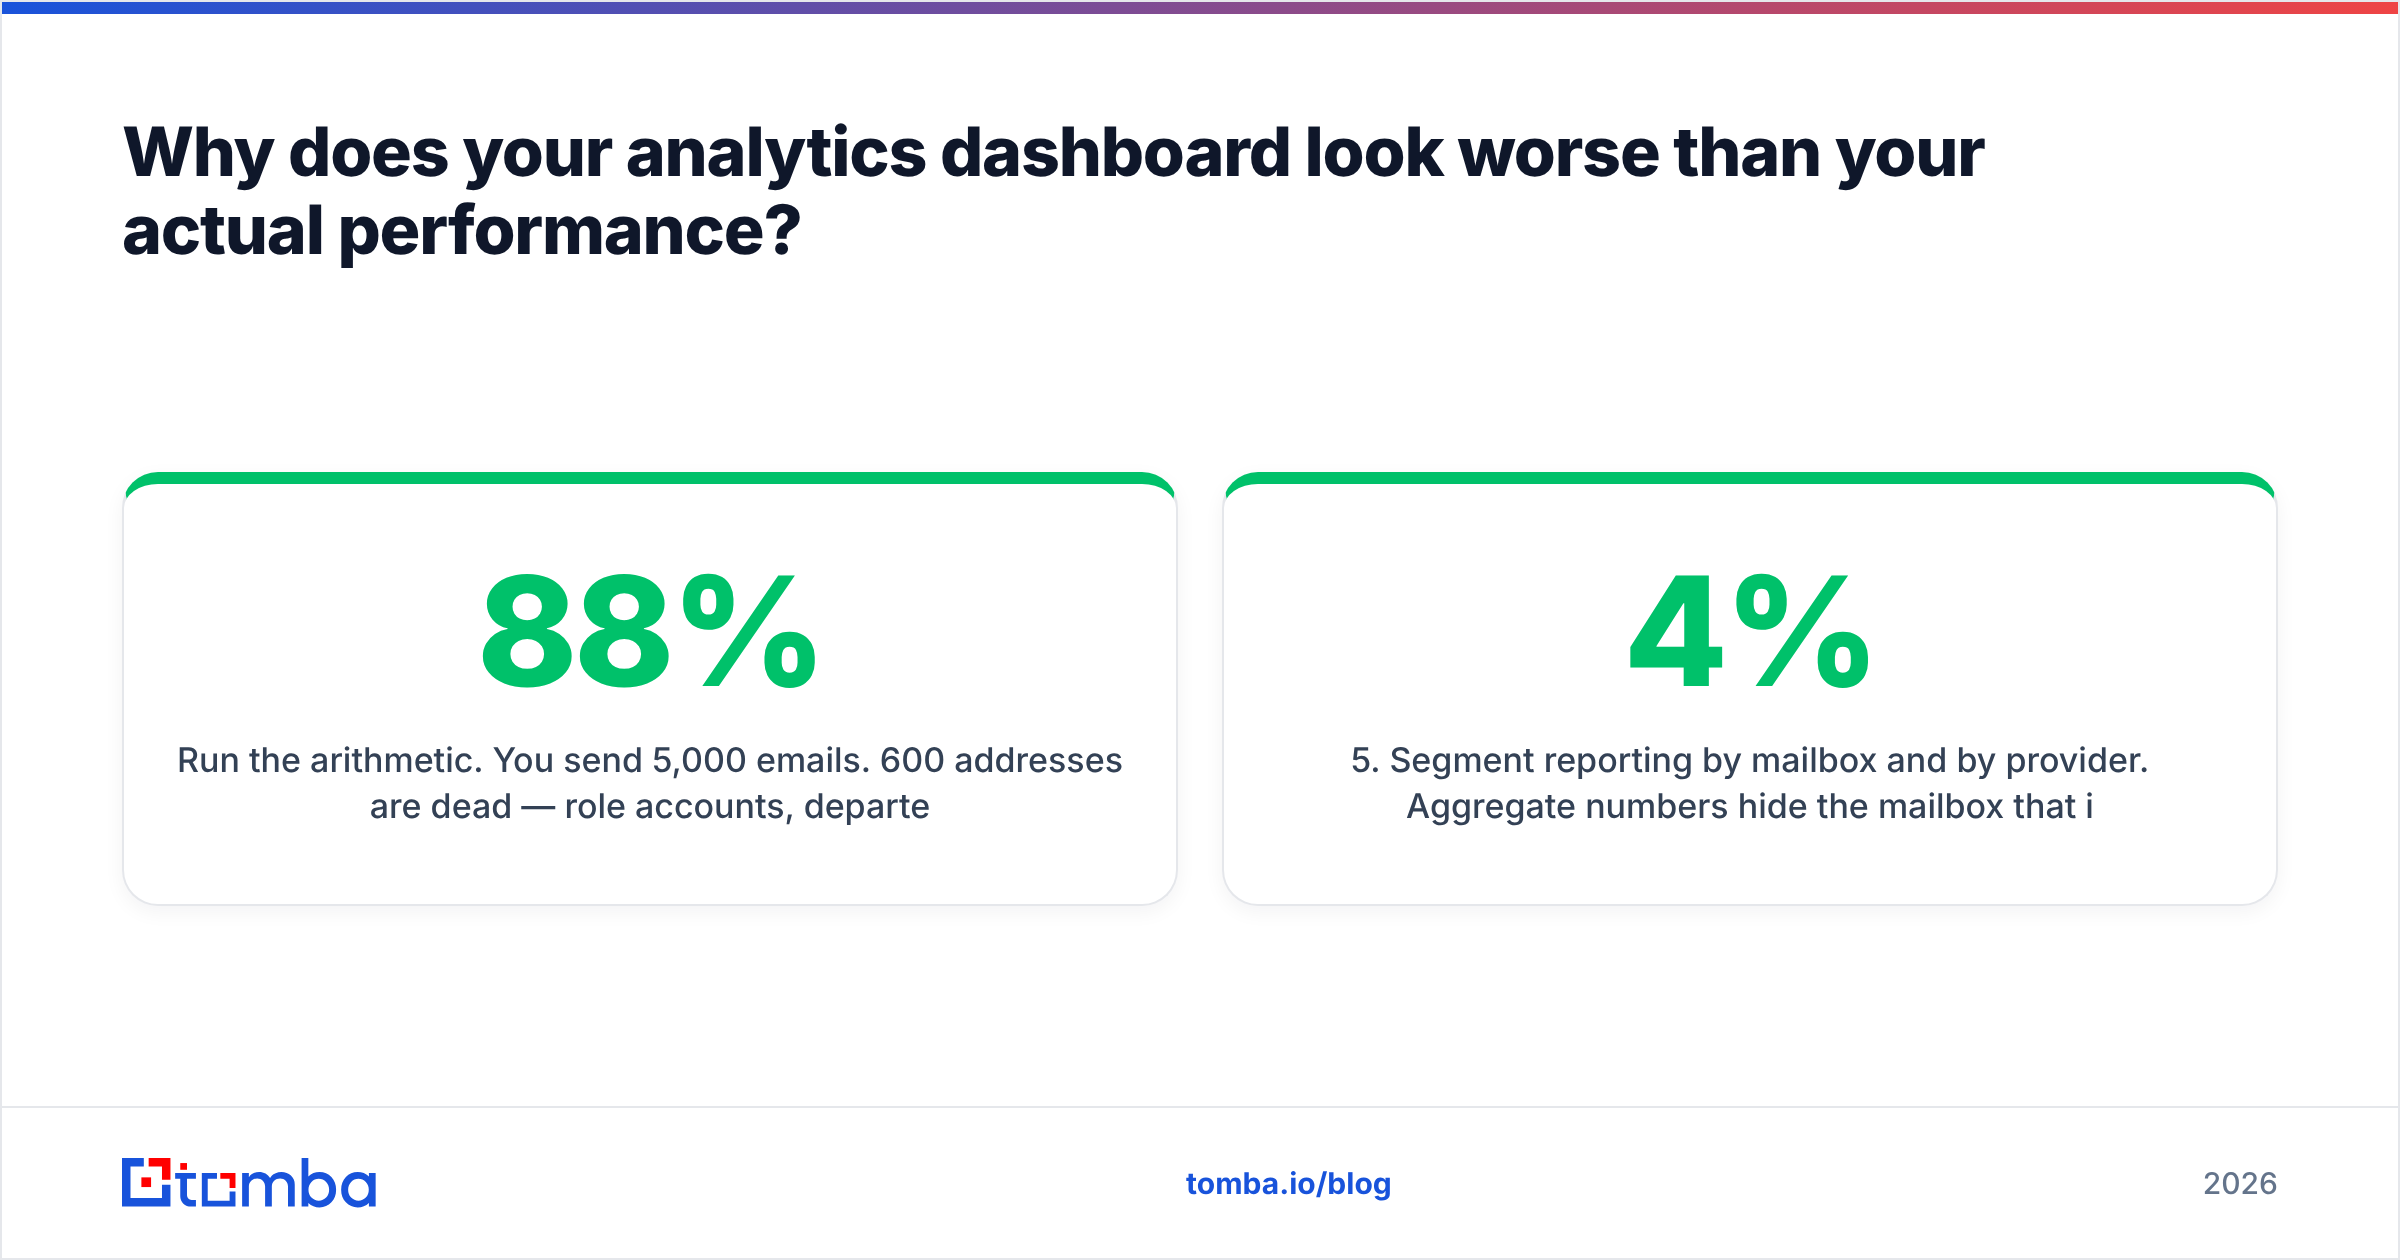
Run the arithmetic. You send 5,000 emails. 600 addresses are dead — role accounts, departed employees, typos, spam traps someone scraped into the file. Those 600 hard-bounce. Your delivered rate reads 88%, your bounce rate reads 12%, and Gmail starts filtering you within two campaigns. Meanwhile your reply rate is computed against 5,000 sends instead of the 4,400 real humans, so it reads 2.7% when the true engaged-audience rate was 3.1%.
Now you make a decision on those numbers. You conclude the messaging is weak and rewrite the sequence. The messaging was fine. The list was garbage.

The fix order matters:
- Verify before send, not after bounce. A pre-send email verifier pass removes invalid, role-based, and disposable addresses before they can register as bounces. Bounces you never generate cannot hurt your reputation.
- Handle catch-all domains explicitly. Catch-all servers accept everything, so they neither bounce nor confirm. Segment them, send them a lower volume, and use a catch-all verifier to score them rather than treating them as either valid or invalid.
- Deduplicate across sources. If the same person exists in your CRM export and your event list, you double-count sends and halve your apparent engagement rate.
- Authenticate the domain. SPF, DKIM, and DMARC are prerequisites for accurate reporting, not just delivery. Providers report authentication failures separately, and an unauthenticated domain gets inconsistent placement that looks like content failure in your dashboard. Run a sender reputation checker and confirm your records before diagnosing anything else.
- Segment reporting by mailbox and by provider. Aggregate numbers hide the mailbox that is on fire. Gmail at 4% reply and Outlook at 0.2% reply is not an average problem, it is an Outlook placement problem.
For large lists, run the whole hygiene pass in one go with a bulk verify job rather than trickling addresses through one at a time.
How do you build an email analytics stack that is not lying to you?#
Five components, in build order.
- Event capture at the source. Whatever sends the mail owns the raw event log. Make sure webhooks are enabled and stored somewhere you control — not just displayed in a vendor UI you will lose access to when you churn.
- Receiver-side truth. Google Postmaster Tools plus Microsoft SNDS. These tell you what the inbox providers actually think of you, which is frequently not what your ESP dashboard implies. Postmaster Tools is free and non-negotiable for Gmail-heavy lists.
- A pre-send data quality gate. Verification, dedupe, and suppression-list enforcement running automatically before any campaign ships. This is the step everyone skips and everyone later blames for a quarter of bad numbers.
- CRM write-back. Email touches need to land on the contact and deal records, or you can never answer "how much pipeline did outbound create." Push events into your CRM via native integration or Zapier rather than reconciling CSVs monthly.
- One reporting layer. A single sheet, BI dashboard, or CRM report that everyone reads. Two sources of truth means zero sources of truth.
A workable weekly cadence: Monday, check Postmaster for reputation and complaint drift. Wednesday, review reply rate by sequence step and kill the worst-performing step. Friday, review pipeline created per 1,000 sends — the only metric that survives contact with a CFO.
What should you actually report to leadership?#
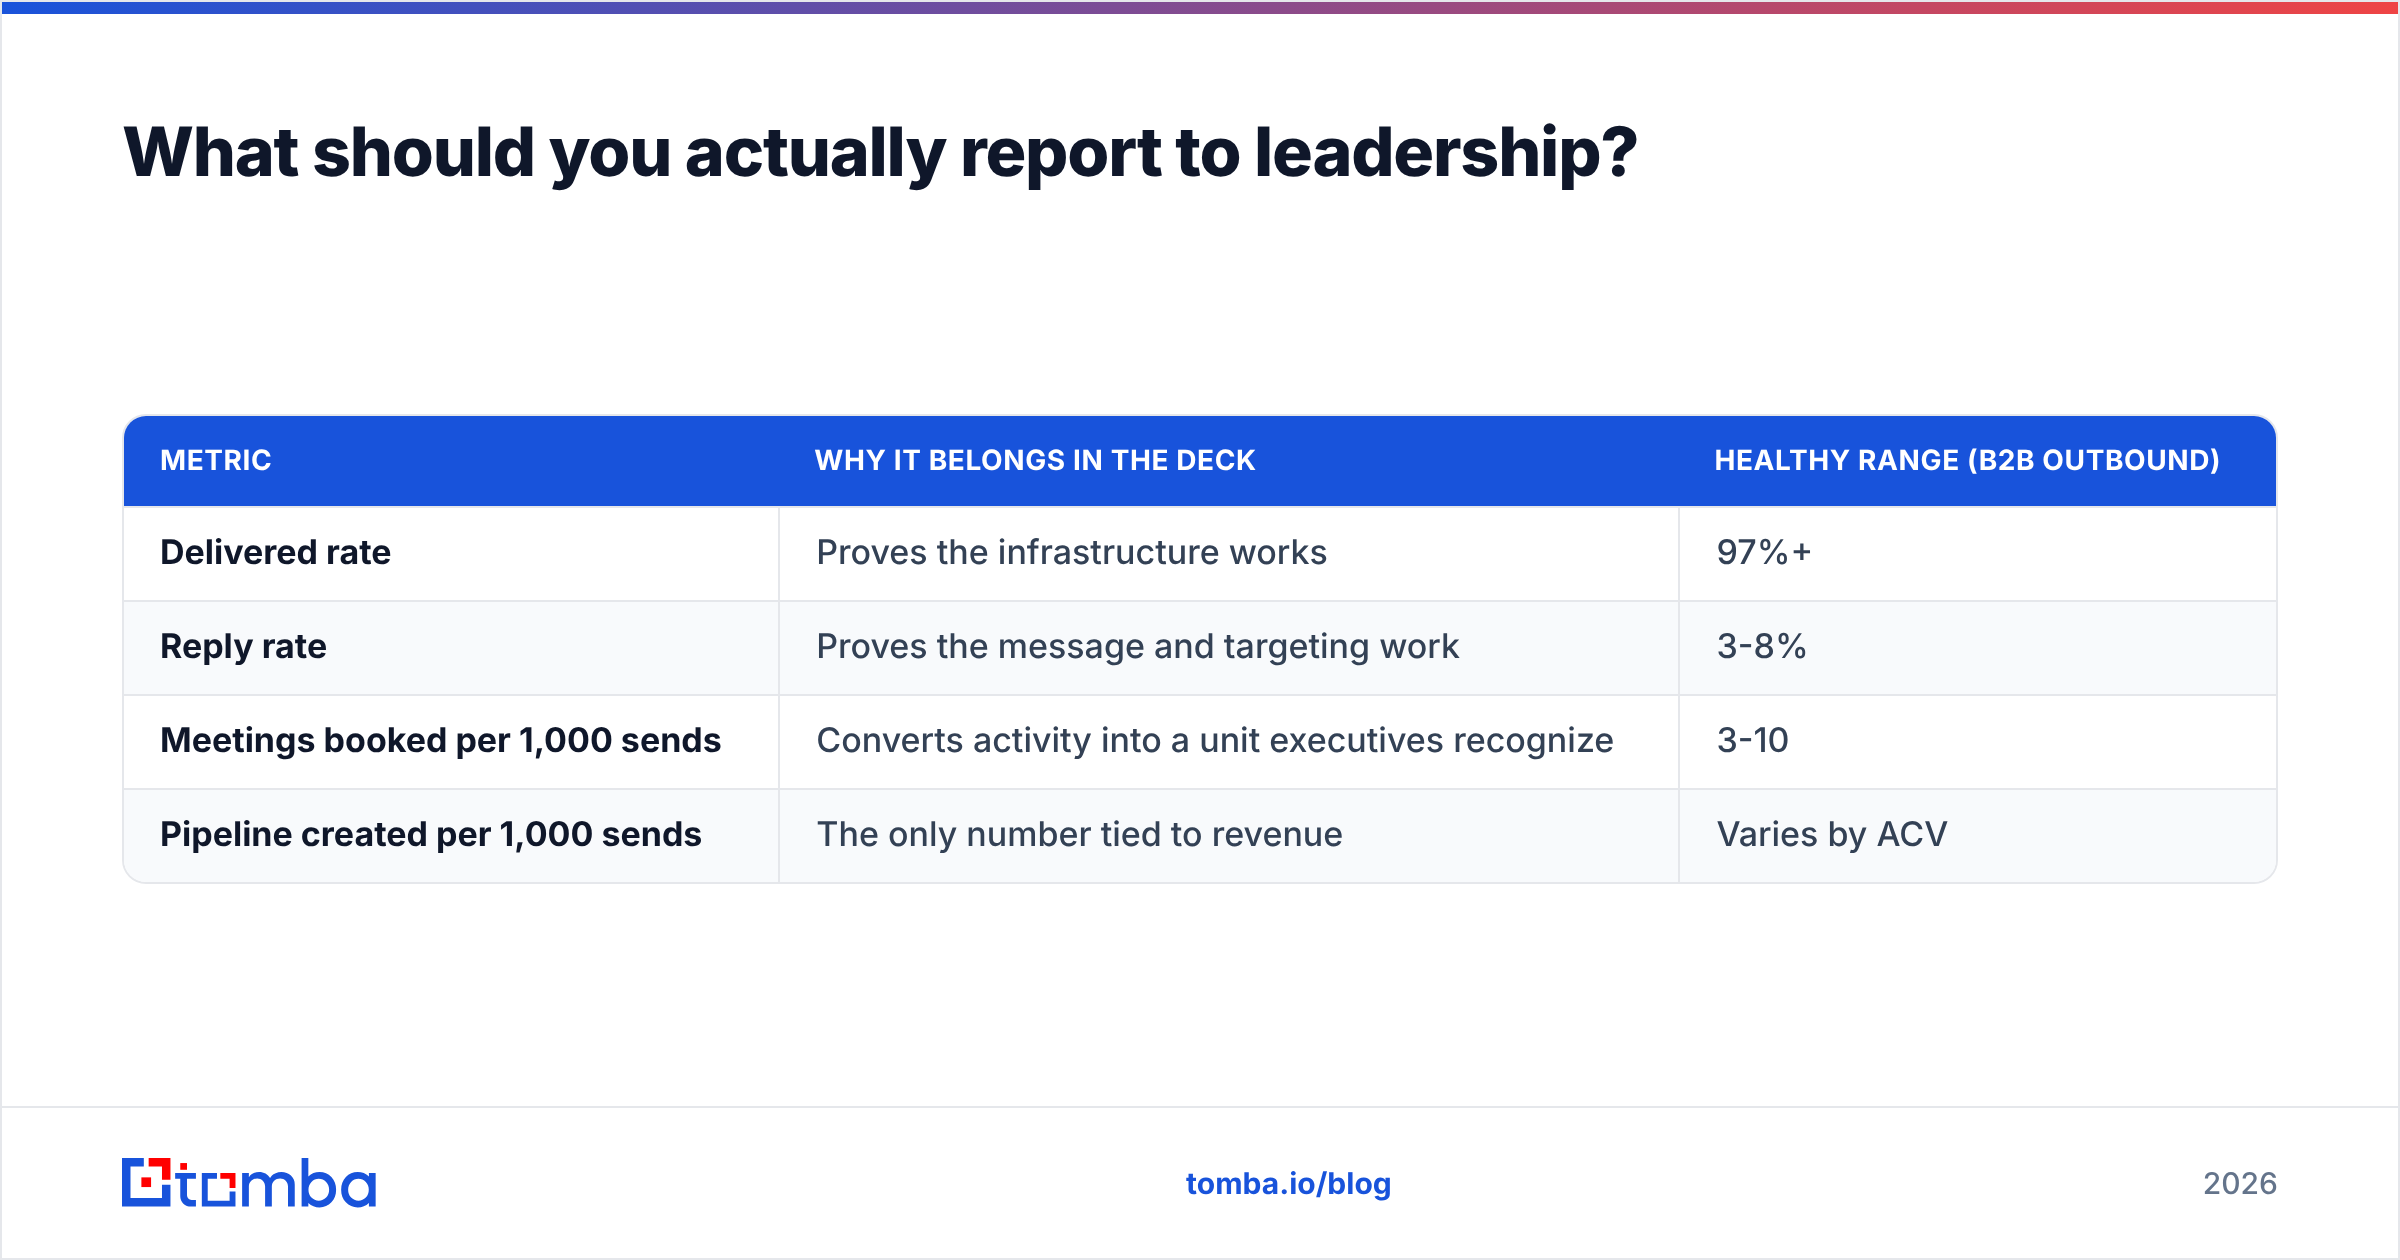
Strip it to four lines. Anything longer and the audience starts reading their phone.
| Metric | Why it belongs in the deck | Healthy range (B2B outbound) |
|---|---|---|
| Delivered rate | Proves the infrastructure works | 97%+ |
| Reply rate | Proves the message and targeting work | 3-8% |
| Meetings booked per 1,000 sends | Converts activity into a unit executives recognize | 3-10 |
| Pipeline created per 1,000 sends | The only number tied to revenue | Varies by ACV |
Notice what is absent. No open rate. No "impressions." No engagement score composited from three inflated inputs. If someone asks for open rate, give it with the caveat attached — one sentence explaining Apple MPP pre-fetching is usually enough to reset the expectation permanently.
Two more habits that separate teams with real analytics from teams with pretty dashboards. First, always report the denominator alongside the rate: "4.1% reply on 2,300 sends" is a fact, "4.1% reply" is a vibe. Second, annotate the timeline. When you changed domains, warmed a new mailbox, swapped the offer, or ran a list cleanup, mark it. Six weeks later, when a metric moved, the annotation is the difference between a diagnosis and a guess. You can pressure-test individual email deliverability assumptions the same way — one variable at a time, annotated.
Is free email analytics software good enough?#
For diagnosis, often yes. For attribution, no.
The free tier stack — Postmaster Tools, SNDS, your ESP's built-in dashboard, and a spreadsheet — will tell you whether you have a delivery problem, a reputation problem, or a message problem. That covers the majority of what goes wrong. Free tools are genuinely sufficient for teams sending under roughly 10,000 emails a month with a single domain.
What you cannot get for free is multi-touch revenue attribution across a long B2B cycle, inbox placement testing across dozens of provider/geo combinations, and automated pre-send data hygiene at volume. Those are the three things worth paying for, in that order of impact. Everything else is dashboard aesthetics.
One caution on seed-list inbox placement tools: seed accounts do not behave like real recipients, so placement results are indicative rather than definitive. Use them to catch catastrophic filtering, not to fine-tune a subject line.
The takeaway#
Email analytics software in 2026 is only as honest as the list you feed it and the receiver-side data you bother to connect. Fix the inputs first: verified addresses, authenticated domain, segmented reporting, and Postmaster wired up. Then pick the tool that matches your sending motion rather than the one with the nicest charts.
Start at the top of the funnel, because that is where accuracy is cheapest to buy. Use Tomba Email Finder to source verified professional addresses by domain, name, or company, so the contacts entering your sequences are real before a single event gets logged. The free tier covers 25 searches a month, Starter runs $49/mo, and Growth is $99/mo — see Tomba pricing for the full breakdown. Clean inputs make every downstream metric worth reading.
Related guides#
Ready to find emails that actually work?
Join 150,000+ professionals who stopped guessing and started sending. Free credits on signup — no credit card required.
Get the Tomba newsletter
Practical outbound tactics and product updates — once every two weeks.
About the author