Email Analytics Tools in 2026: A Complete Buyer's Guide
Open rates broke in 2021 and never recovered. Here's how the major email analytics tools actually measure performance in 2026, what each one hides, and how to build a reporting stack you can defend in a board meeting.
TL;DR
- Open rate is no longer a measurement — it is an estimate with a large, unknowable error bar. Apple Mail Privacy Protection, Gmail image proxying, and security scanners inflate it by anywhere from 10 to 60 percentage points depending on your audience mix.
- The email analytics tools that matter in 2026 fall into four buckets: ESP-native reporting, cold-outbound sequencer analytics, deliverability/inbox-placement monitors, and product-analytics platforms that treat email as one event stream among many.
- No single tool covers all four. The realistic stack is two tools plus a clean data layer underneath.
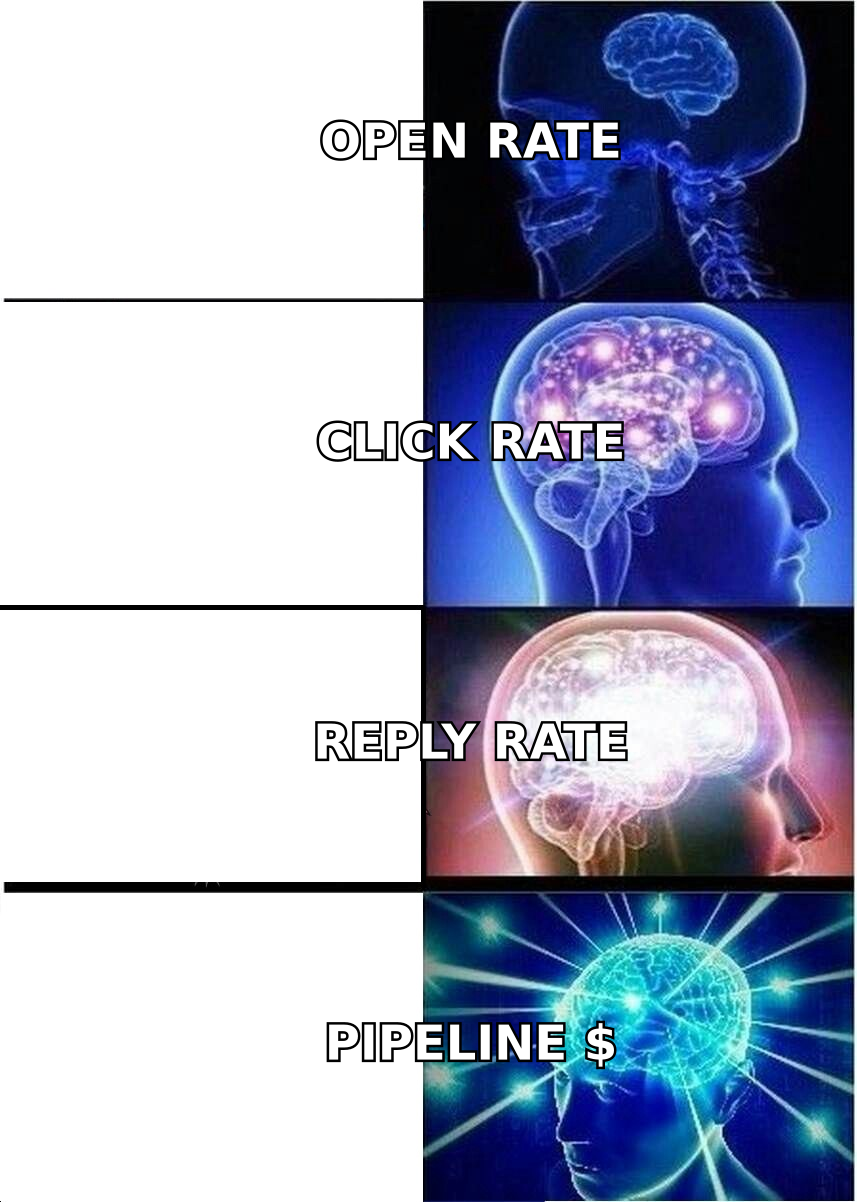
- Reply rate, click-to-reply ratio, and pipeline sourced per 1,000 sends are the three metrics that survived the privacy changes. Build your dashboards on those.
- Garbage list quality corrupts every metric downstream. Verification and enrichment sit upstream of analytics, not beside it.
What are email analytics tools, exactly?#
Email analytics tools measure what happens to a message after you press send: whether it reached an inbox, whether a human interacted with it, and whether that interaction turned into revenue.
That sounds simple. It stopped being simple in September 2021, when Apple shipped Mail Privacy Protection and started pre-fetching tracking pixels for every Apple Mail user regardless of whether they opened anything. Gmail had already been proxying images since 2013. Corporate security gateways — Proofpoint, Mimecast, Microsoft Defender — click every link in every message to sandbox it. The result is that two of the three metrics most teams still report on are partially synthetic.
So a modern email analytics tool is really doing four jobs at once, and vendors are honest about maybe two of them:
- Engagement measurement — opens, clicks, replies, unsubscribes. Reply data is clean. Click data is noisy. Open data is close to decorative.
- Deliverability measurement — did the message land in the inbox, the Promotions tab, spam, or nowhere at all? This requires seed lists, Postmaster feeds, or SMTP-level diagnostics, not pixels.
- Attribution — which sends produced meetings, pipeline, and closed revenue. This needs a join between your email tool and your CRM.
- Cohort and list health — how engagement decays by list age, source, and segment. This is where most teams find their real problem.
A tool that only does #1 is a reporting tab, not an analytics platform.
Which metrics can you still trust in 2026?#
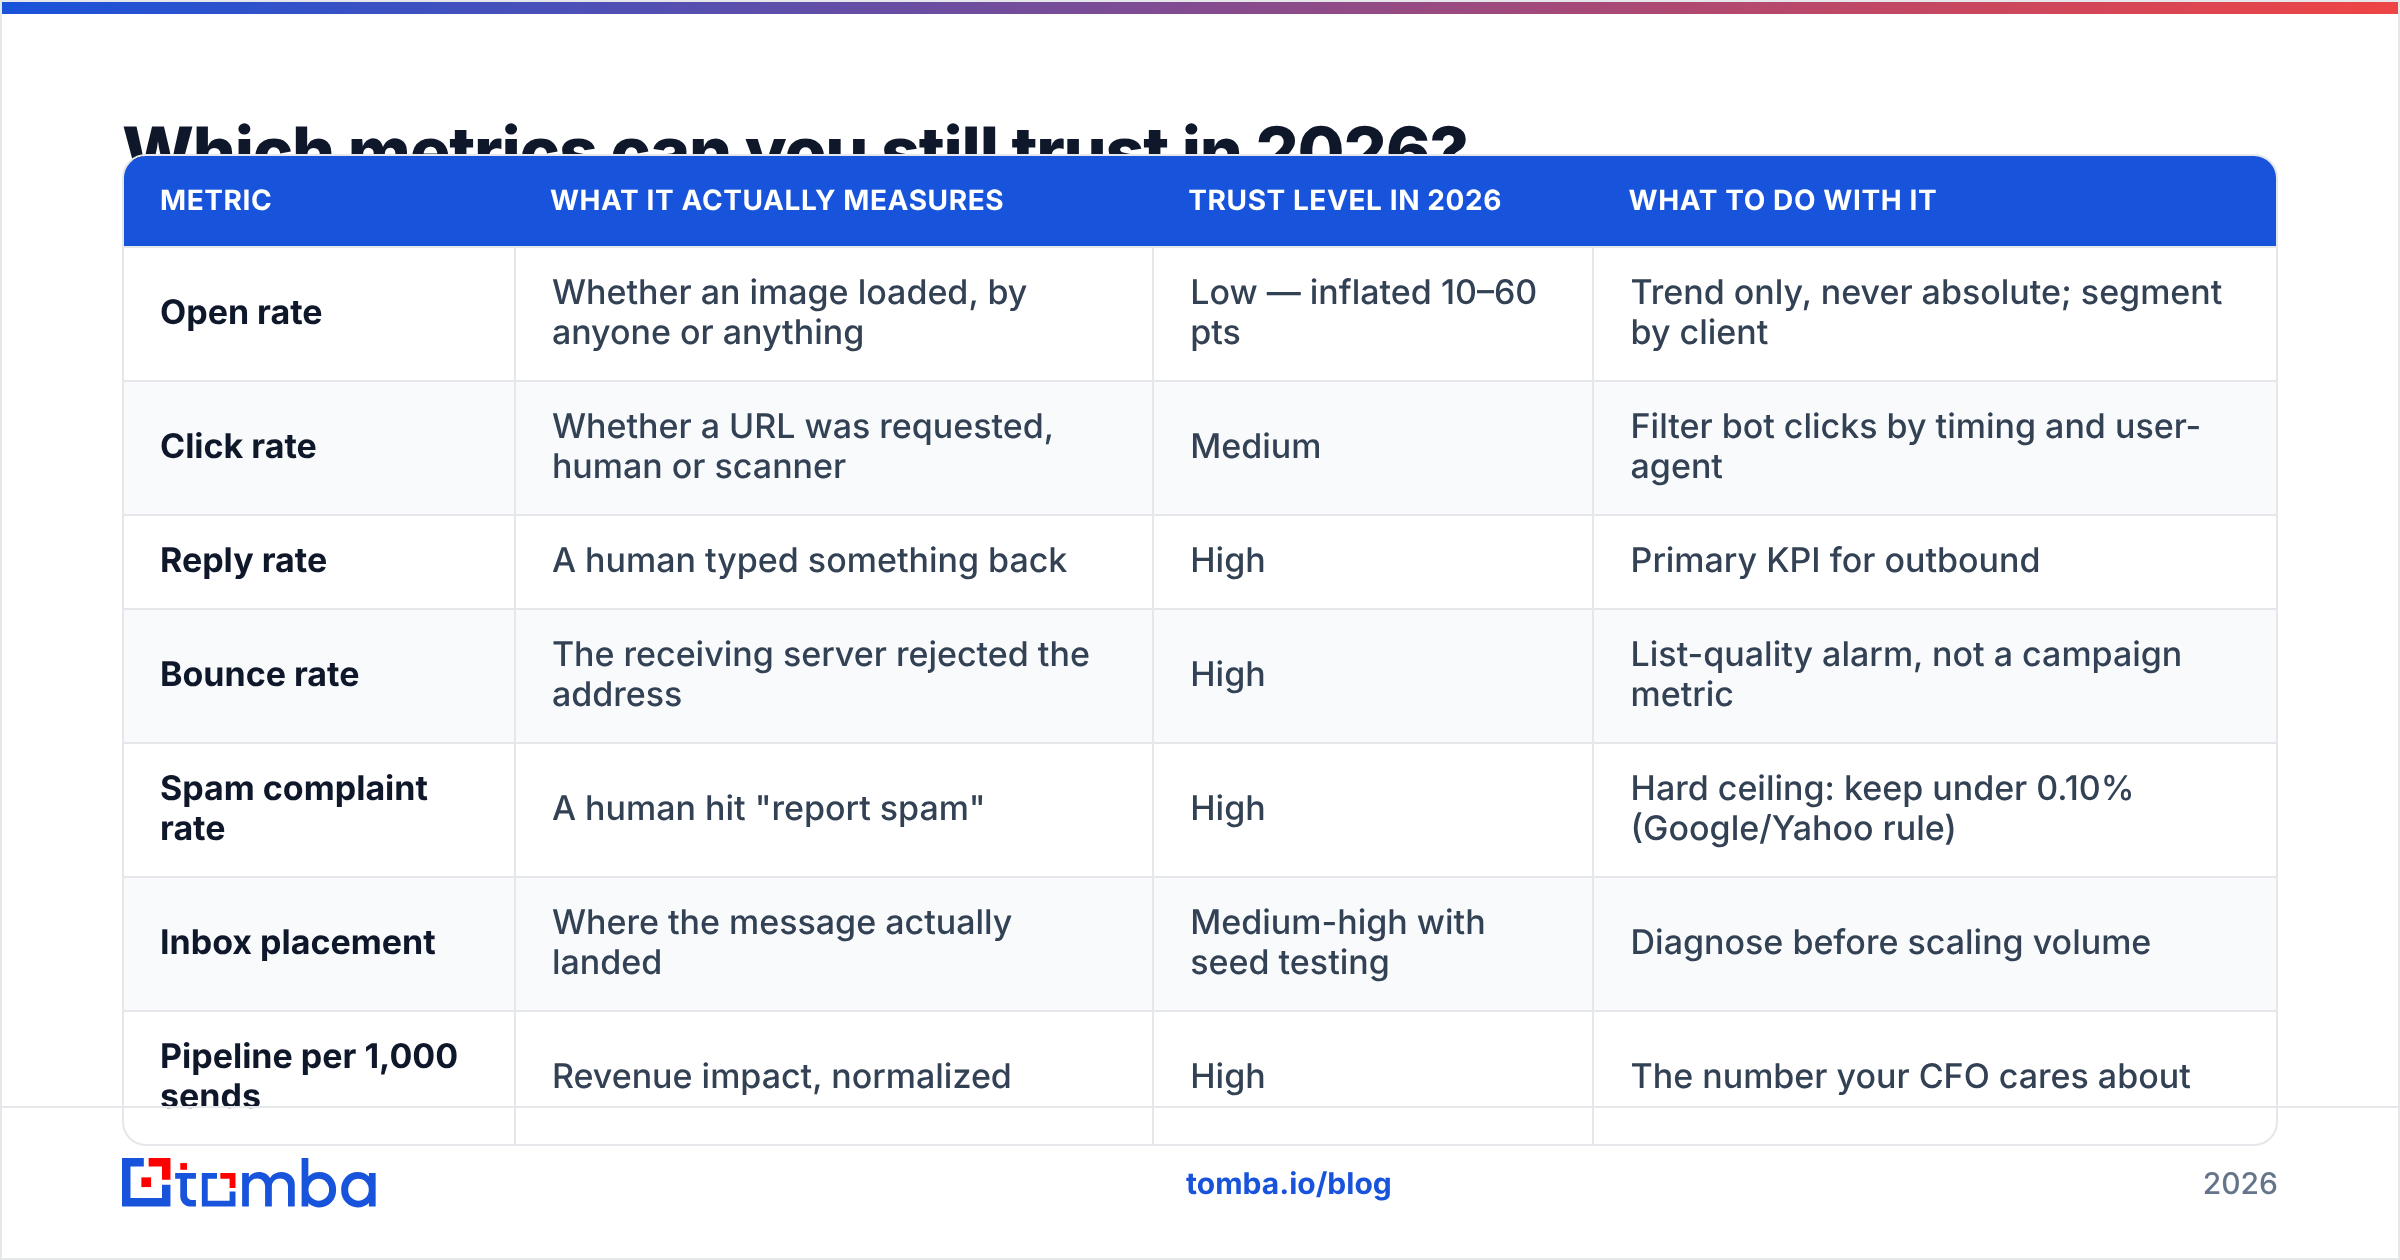
Sort your metrics by how much machinery sits between the human and the number. Fewer intermediaries means more signal.
| Metric | What it actually measures | Trust level in 2026 | What to do with it |
|---|---|---|---|
| Open rate | Whether an image loaded, by anyone or anything | Low — inflated 10–60 pts | Trend only, never absolute; segment by client |
| Click rate | Whether a URL was requested, human or scanner | Medium | Filter bot clicks by timing and user-agent |
| Reply rate | A human typed something back | High | Primary KPI for outbound |
| Bounce rate | The receiving server rejected the address | High | List-quality alarm, not a campaign metric |
| Spam complaint rate | A human hit "report spam" | High | Hard ceiling: keep under 0.10% (Google/Yahoo rule) |
| Inbox placement | Where the message actually landed | Medium-high with seed testing | Diagnose before scaling volume |
| Pipeline per 1,000 sends | Revenue impact, normalized | High | The number your CFO cares about |
Two practical rules follow from that table. First, if you must report open rate, report it segmented by mailbox provider — Apple Mail opens and everything else — so the inflation is visible instead of blended. Second, a click that arrives within four seconds of delivery, from a datacenter IP, on every link in the message, is a security scanner. Any analytics tool that cannot filter those is giving you a fiction.
What are the main categories of email analytics tools?#
The category confusion is why teams over-buy. Here is the honest split.
- ESP-native analytics — HubSpot, Mailchimp, Klaviyo, Customer.io. Strong on campaign-level marketing reporting, cohort revenue, and A/B testing. Weak on inbox placement and on cold outbound, which they mostly forbid anyway.
- Outbound sequencer analytics — Instantly, Smartlead, Lemlist, Reply.io, Salesloft, Outreach. Built around reply rate, sequence step performance, and mailbox rotation health. Weak on lifecycle and revenue cohorts.
- Deliverability and placement monitors — Google Postmaster Tools, Litmus, MailerCheck, Mailtrap, GlockApps. These answer "where did it land" and "is my domain reputation degrading." They do not care about your subject lines.
- Product/BI analytics — Mixpanel, Amplitude, Looker, or plain SQL over a warehouse fed by Segment. Email becomes one event type. Maximum flexibility, maximum setup cost, zero opinion out of the box.
- Data quality layer — verification, enrichment, and dedupe. Not analytics, but every number above is computed on the list this layer produces. A 12% bounce rate does not need a better dashboard; it needs a better list.
Most teams need one tool from category 1 or 2, one from category 3, and a disciplined habit in category 5.
How do the major email analytics tools compare?#
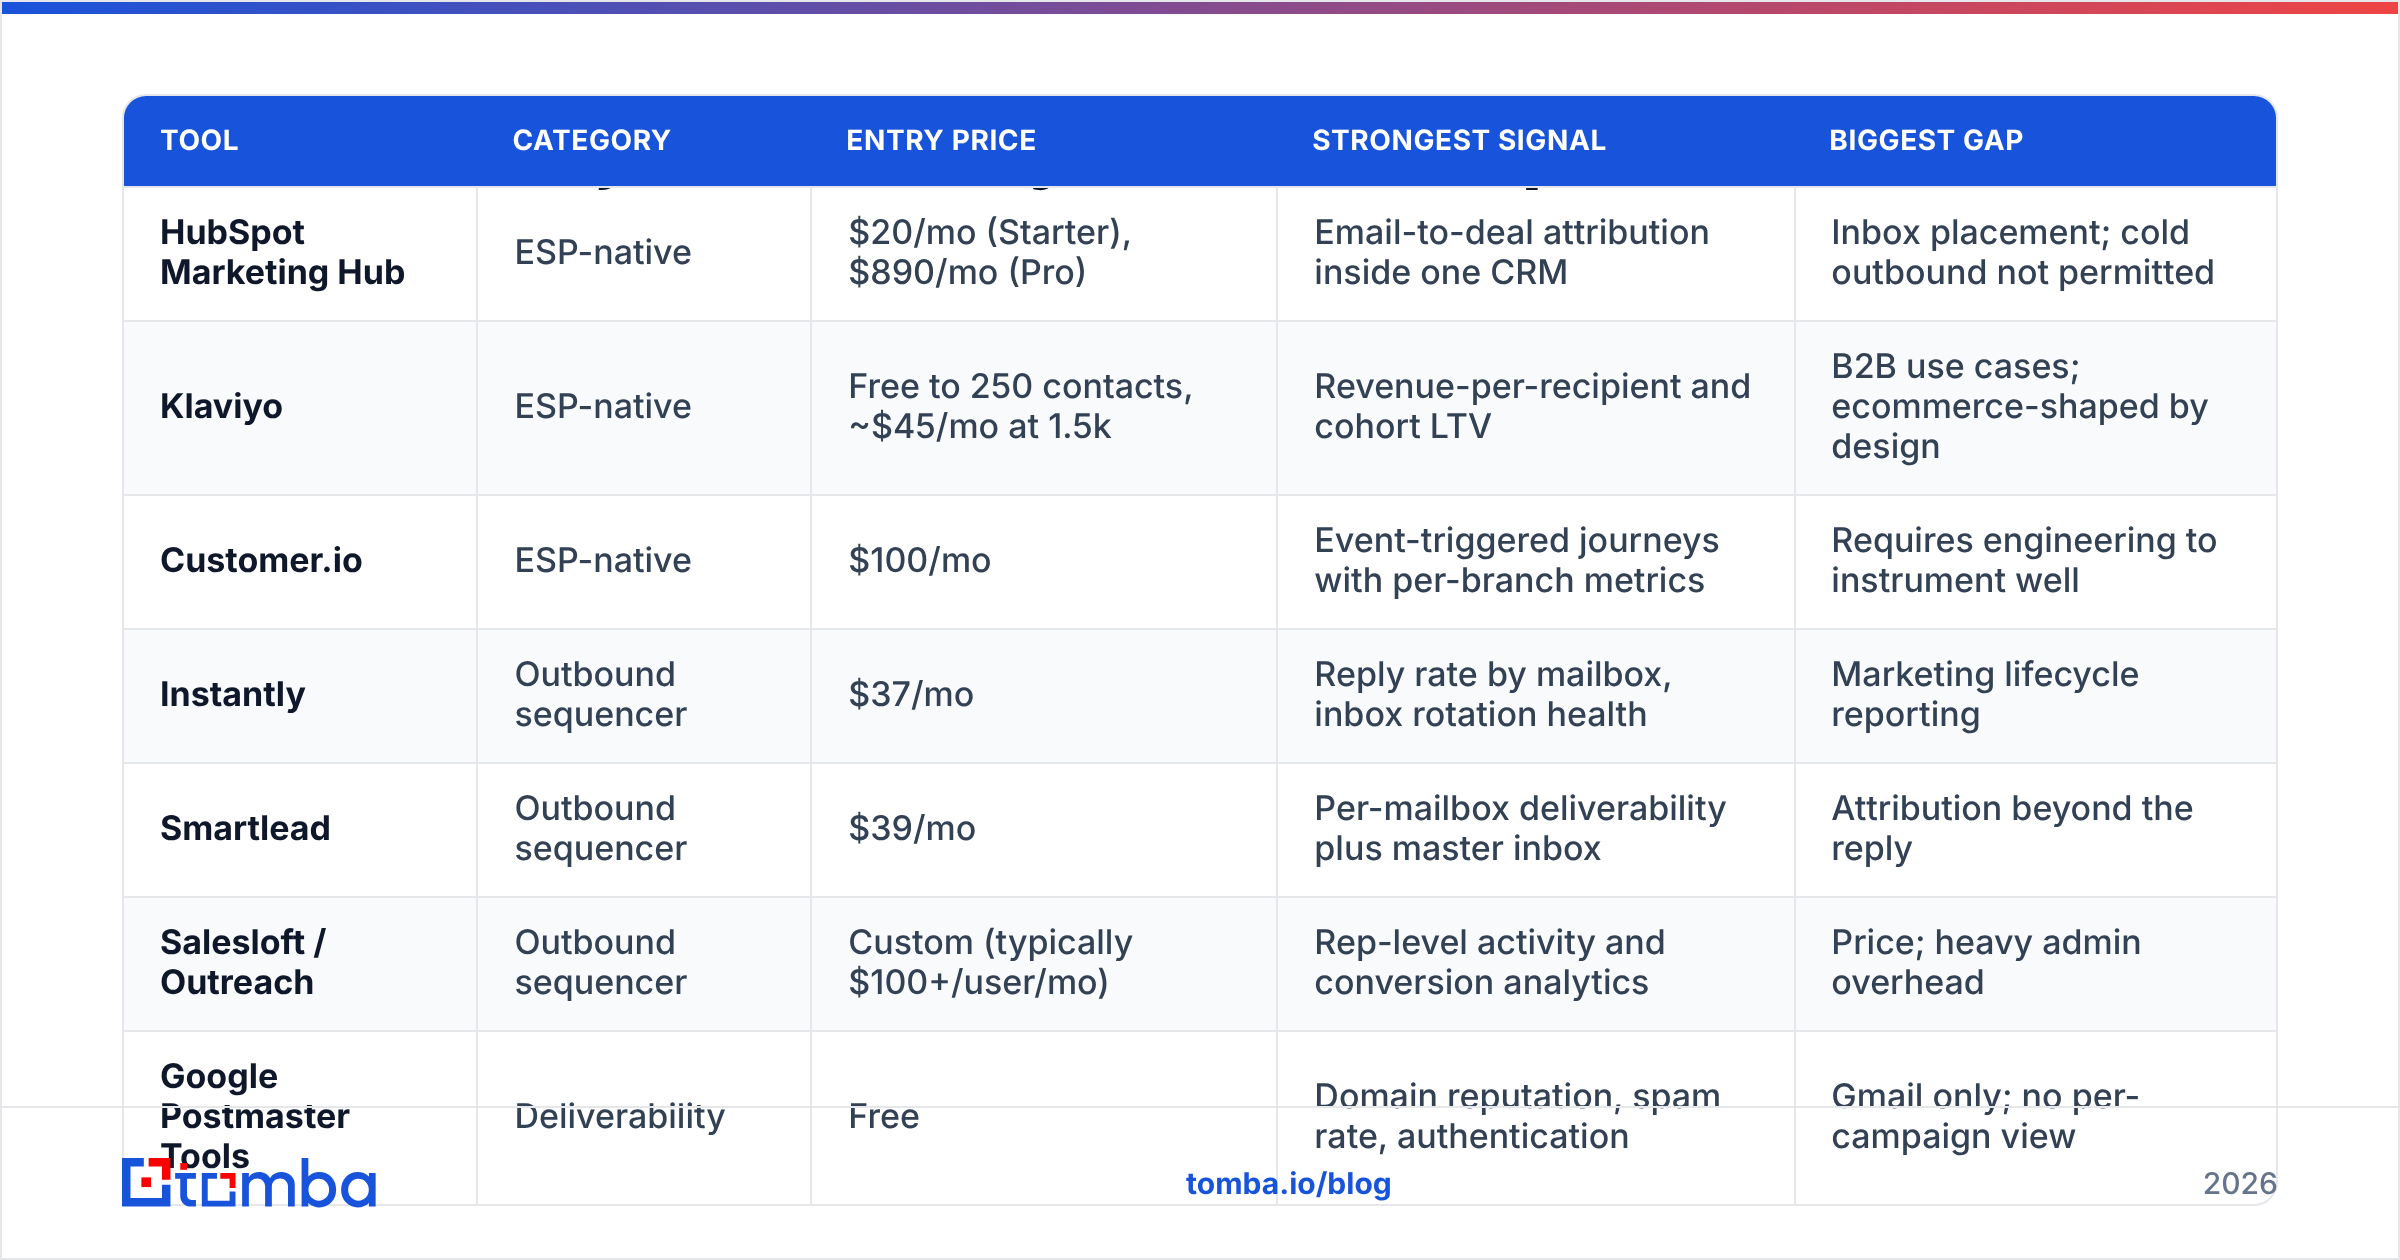
Pricing below reflects publicly listed entry tiers as of mid-2026; all of these vendors move their packaging frequently, so treat the column as an order-of-magnitude guide and verify on the vendor's own page before you sign.
| Tool | Category | Entry price | Strongest signal | Biggest gap |
|---|---|---|---|---|
| HubSpot Marketing Hub | ESP-native | $20/mo (Starter), $890/mo (Pro) | Email-to-deal attribution inside one CRM | Inbox placement; cold outbound not permitted |
| Klaviyo | ESP-native | Free to 250 contacts, ~$45/mo at 1.5k | Revenue-per-recipient and cohort LTV | B2B use cases; ecommerce-shaped by design |
| Customer.io | ESP-native | $100/mo | Event-triggered journeys with per-branch metrics | Requires engineering to instrument well |
| Instantly | Outbound sequencer | $37/mo | Reply rate by mailbox, inbox rotation health | Marketing lifecycle reporting |
| Smartlead | Outbound sequencer | $39/mo | Per-mailbox deliverability plus master inbox | Attribution beyond the reply |
| Salesloft / Outreach | Outbound sequencer | Custom (typically $100+/user/mo) | Rep-level activity and conversion analytics | Price; heavy admin overhead |
| Google Postmaster Tools | Deliverability | Free | Domain reputation, spam rate, authentication | Gmail only; no per-campaign view |
| Litmus | Deliverability + rendering | $99/mo | Client rendering plus engagement heatmaps | No CRM attribution |
| GlockApps | Deliverability | $59/mo | Seed-list placement across providers | Small sample; seeds are not customers |
| Mixpanel / warehouse | Product analytics | Free tier, then usage-based | Any cut of the data you can define | You build every report yourself |
Three observations that will save you a procurement cycle.
The sequencer tools measure the send, not the outcome. Instantly and Smartlead will tell you that step 2 of sequence 7 gets a 9.4% reply rate. They will not tell you that those replies close at half the rate of step 1 replies. That join lives in your CRM, and you need to build it.
Google Postmaster Tools is free and most teams still don't check it. If your Gmail spam complaint rate crosses 0.3%, nothing else in your dashboard matters. Google's own bulk sender guidelines set the thresholds explicitly. Wire it into your weekly review before you buy anything.
"Analytics" in an ESP usually means "reporting." Reporting shows you what happened. Analytics lets you ask why. The distinguishing test: can you segment a metric by a dimension the vendor did not pre-build? If not, you have reporting, and you will eventually export to a spreadsheet.
How do you choose the right email analytics tool for your team?#
Match the tool to the question you actually need answered, not to the longest feature list.
- You run lifecycle marketing to an opted-in list. Start with your ESP's native analytics and add Postmaster Tools. Klaviyo and Customer.io both give you revenue-per-recipient out of the box, which is the metric that ends most internal arguments.
- You run cold outbound. A sequencer plus a placement monitor. Your dashboard should be three numbers: reply rate, positive reply rate, and meetings booked per 1,000 sends. Everything else is diagnostic.
- You run both, and leadership wants one number. You need a warehouse. Pipe send/open/click/reply events from both systems into BigQuery or Snowflake, join to CRM opportunity IDs, and report pipeline sourced per channel. Expect four to six weeks of work.
- You're under 10 people and pre-product-market-fit. Your sequencer's built-in reporting plus a weekly manual CRM check is genuinely enough. Do not buy a BI stack to analyze 800 sends a month.
- Your bounce rate is above 3%. Stop shopping for analytics. Fix the list first.
Peer reviews are useful for narrowing this down — G2's email marketing category is reasonably honest about where each tool's reporting frustrates people, and the complaints cluster in predictable places: attribution gaps, export limits, and sampling.

Why does data quality break your analytics before your tool does?#
Because every rate you compute has list quality in the denominator.
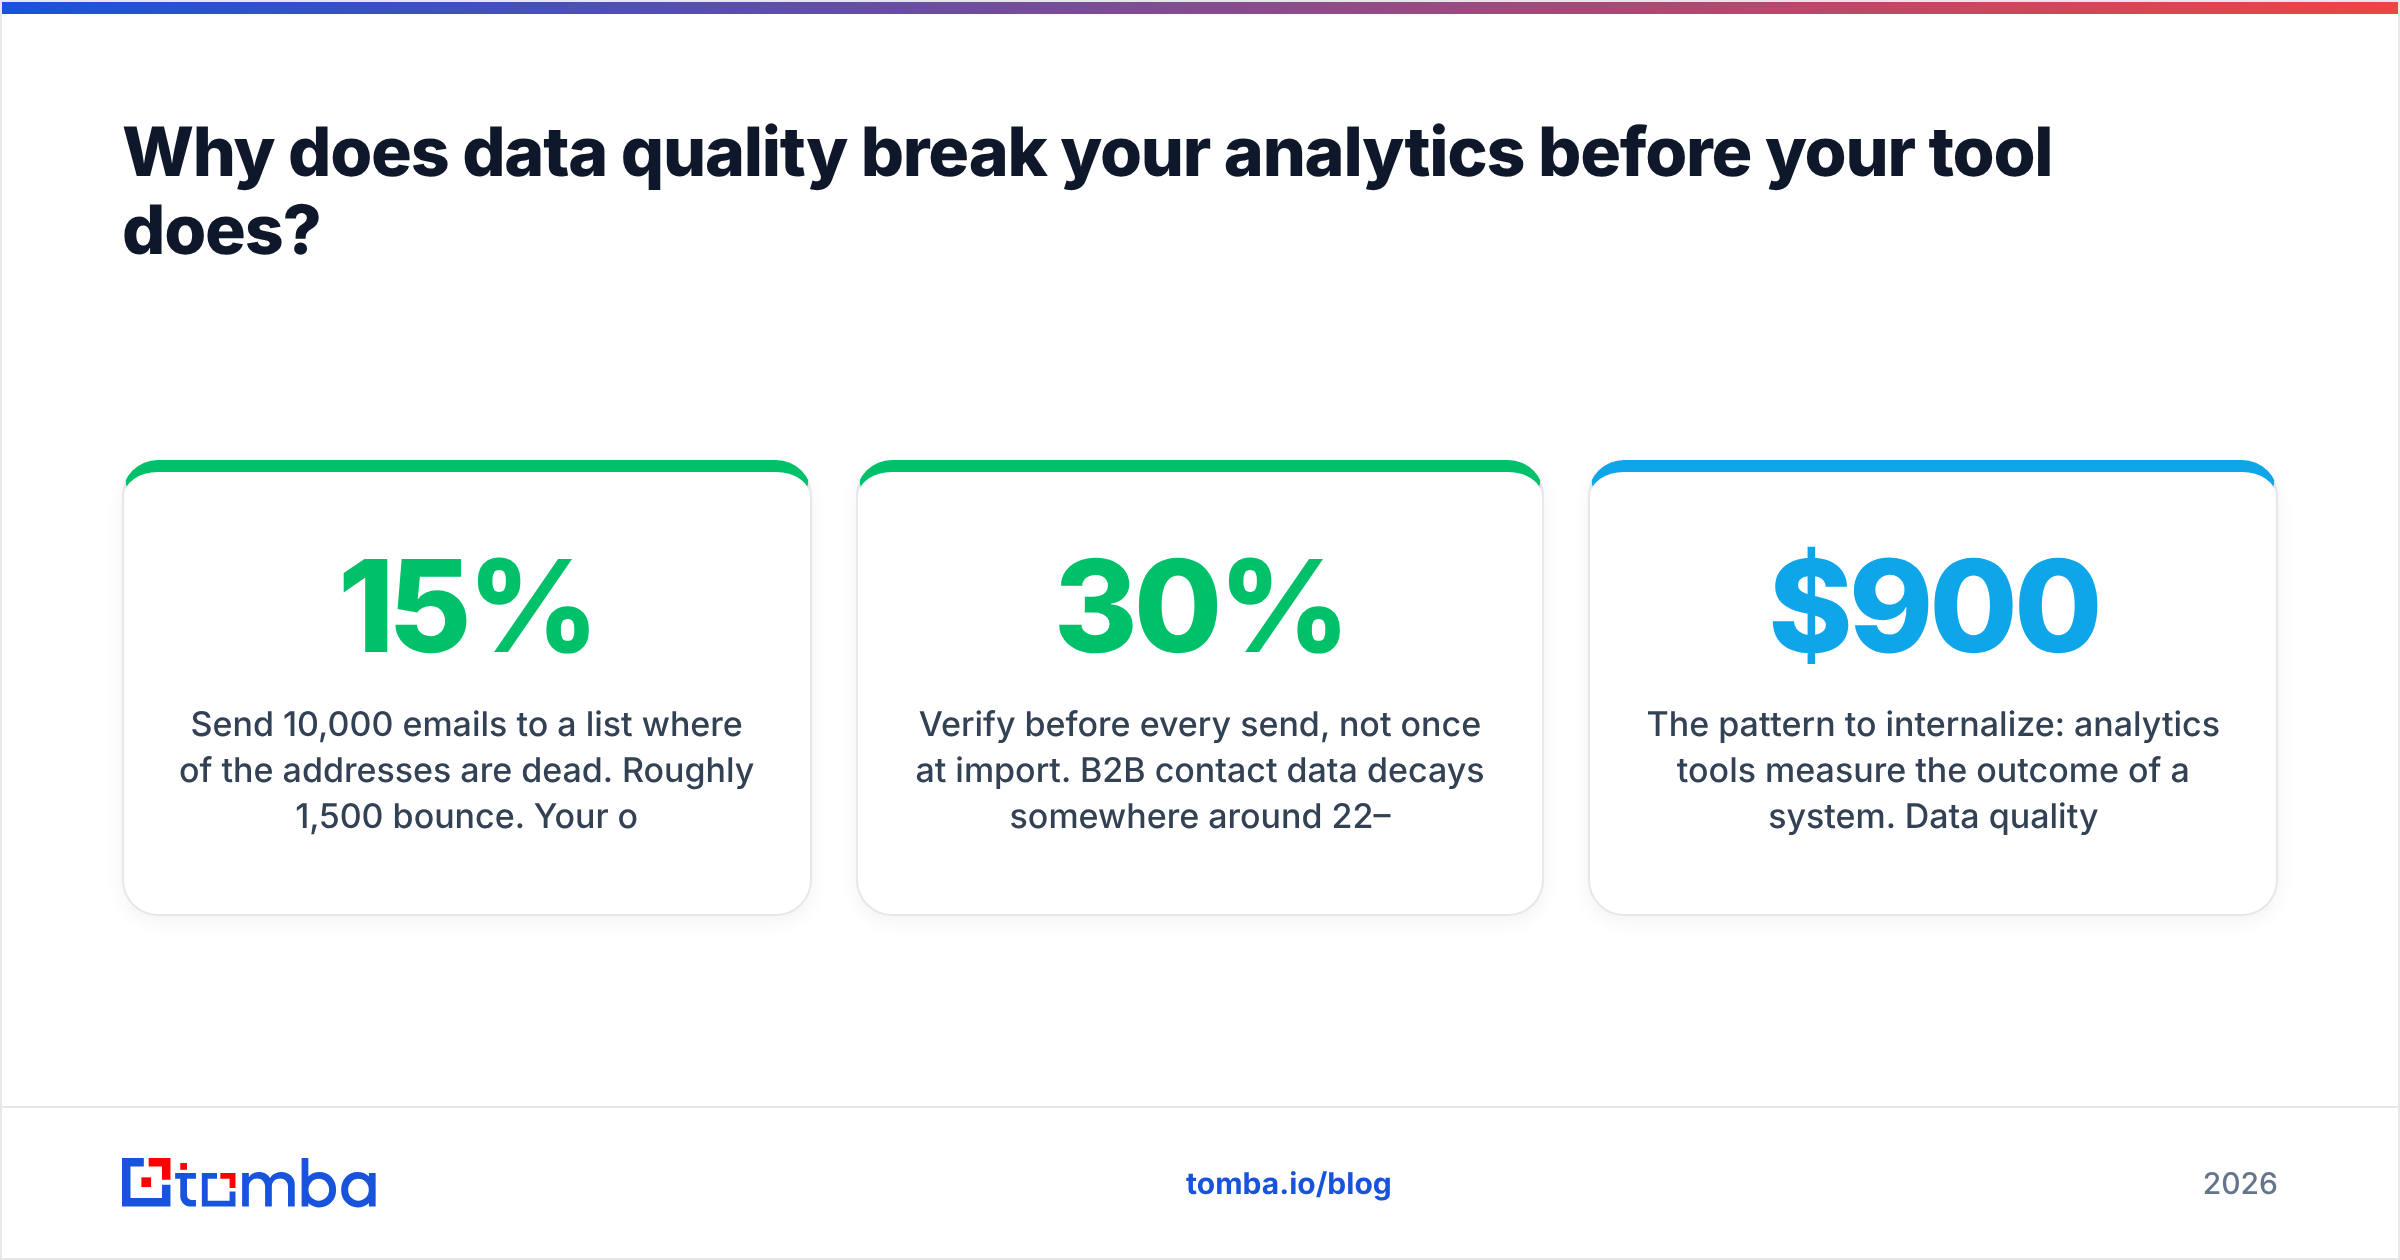
Send 10,000 emails to a list where 15% of the addresses are dead. Roughly 1,500 bounce. Your open rate is now computed against 8,500 delivered, but your reply rate probably gets reported against 10,000 sent — and your sending domain has just absorbed a bounce rate that will get your next campaign throttled. The dashboard reports a subject-line problem. You have an address problem.
Three habits fix most of this:
- Verify before every send, not once at import. B2B contact data decays somewhere around 22–30% annually as people change jobs. A list verified in January is measurably worse in July. Run it through an email verifier as a pre-send step in the workflow.
- Handle catch-all domains explicitly. Catch-all servers accept everything, so they never bounce and never confirm. Left unhandled, they quietly inflate your delivered count and deflate every engagement rate. A catch-all verifier at least tells you which segment of your list is unknowable, so you can report on it separately.
- Monitor your own sending reputation, not just campaign stats. A sender reputation checker and a periodic look at your email deliverability fundamentals — SPF, DKIM, DMARC alignment — catch the failures that no engagement metric surfaces until it's too late.
The pattern to internalize: analytics tools measure the outcome of a system. Data quality is an input to that system. Fixing the measurement layer never fixes the input layer, and teams routinely spend $900 a month trying.
What does a defensible email analytics stack look like?#
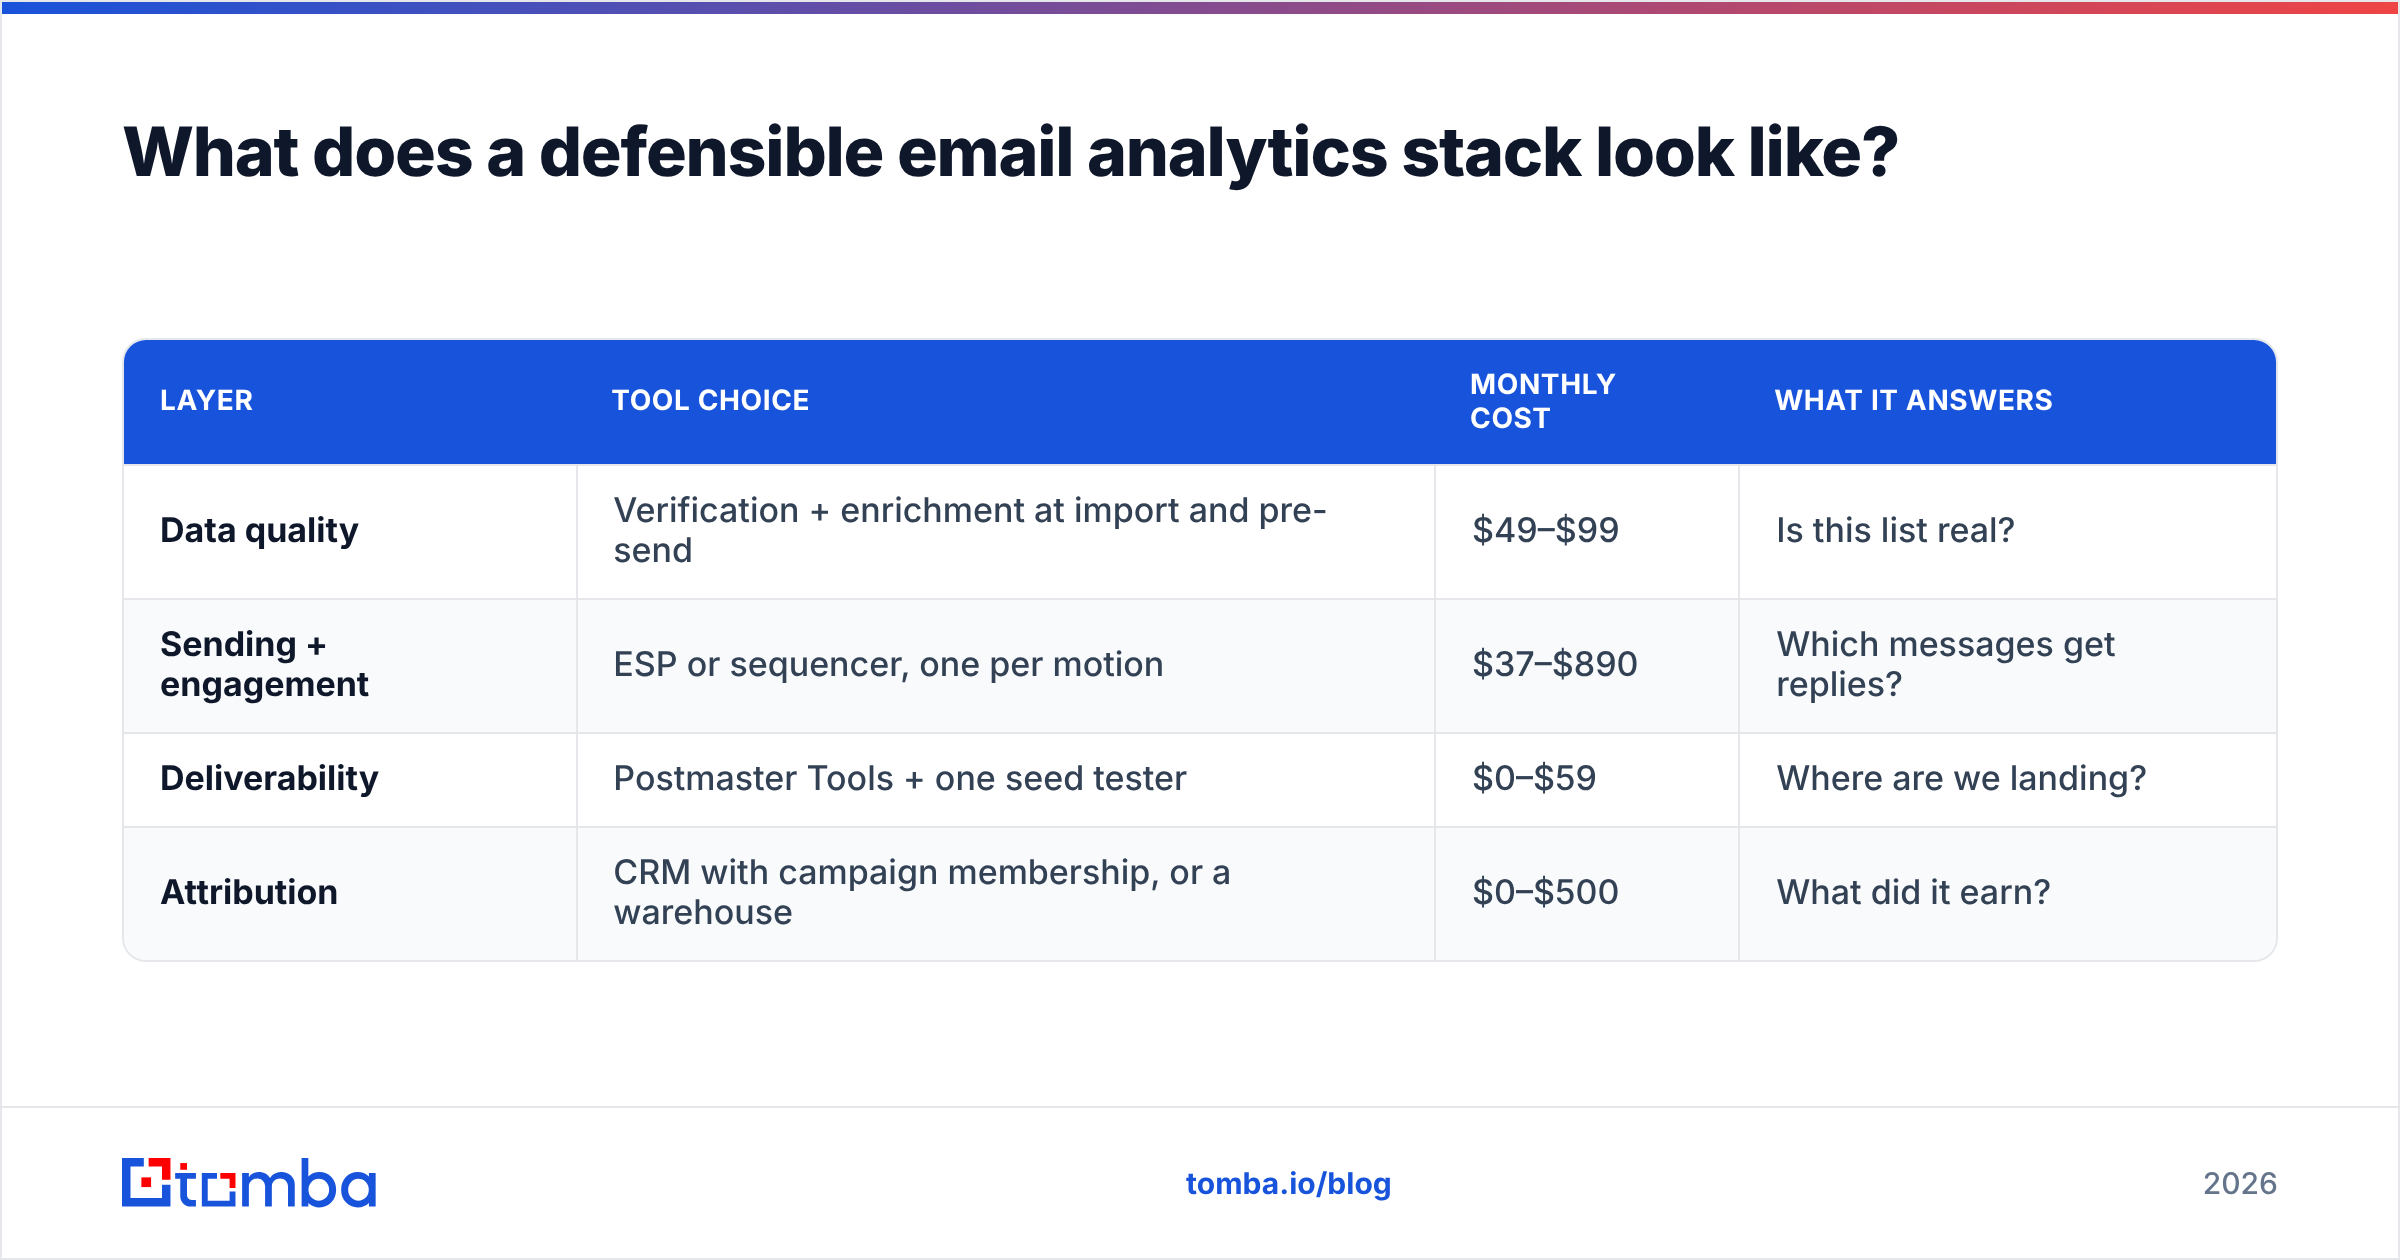
Here is a configuration that works for most B2B teams under 200 people, priced honestly.
| Layer | Tool choice | Monthly cost | What it answers |
|---|---|---|---|
| Data quality | Verification + enrichment at import and pre-send | $49–$99 | Is this list real? |
| Sending + engagement | ESP or sequencer, one per motion | $37–$890 | Which messages get replies? |
| Deliverability | Postmaster Tools + one seed tester | $0–$59 | Where are we landing? |
| Attribution | CRM with campaign membership, or a warehouse | $0–$500 | What did it earn? |
Total for a lean setup: under $250 a month. The expensive part is not the tools. It is the two weeks someone spends defining what "a reply" means consistently across systems, and then defending that definition when the numbers get uncomfortable.
One more thing worth writing down before you build dashboards: decide in advance which metric you will act on. Teams that track twelve metrics act on zero. Pick reply rate for outbound or revenue-per-recipient for lifecycle, make it the single number on the wall, and treat everything else as a diagnostic you consult when that number moves.
Where should you start this week?#
Audit before you buy. Pull last quarter's sends and compute three things: bounce rate, spam complaint rate, and reply rate. If bounce rate is above 2% or complaint rate above 0.1%, your problem is list quality and sending hygiene, and no analytics purchase will move those numbers. If both are healthy and reply rate is still flat, then you have a genuine messaging or targeting problem, and better analytics will help you find it.
If the audit points at list quality — and for most B2B teams it does — the fix starts upstream of any dashboard. The Tomba Email Finder sources verified professional addresses by name, domain, or company, with pattern detection and SMTP-level verification built into the same call, so the contacts entering your sequencer are ones that can actually receive mail. The free tier covers 25 searches a month for testing the accuracy on your own target accounts; paid plans start at $49/mo, with full Tomba pricing published up front. Clean inputs first, then the analytics layer has something honest to measure.
Related guides#
Ready to find emails that actually work?
Join 150,000+ professionals who stopped guessing and started sending. Free credits on signup — no credit card required.
Get the Tomba newsletter
Practical outbound tactics and product updates — once every two weeks.
About the author