Email Average Click Through Rate: 2026 Benchmarks by Industry
The email average click through rate hovers around 2.6% across industries — but that single number hides a 5x spread between the best and worst senders. Here's what actually moves it.
TL;DR
- The email average click through rate across all industries sits between 2.4% and 3.0% in 2026. Most credible benchmark sets land near 2.6%.
- B2B tends to run slightly below consumer email on raw CTR (roughly 2.1–2.8%) but far above it on downstream conversion value.
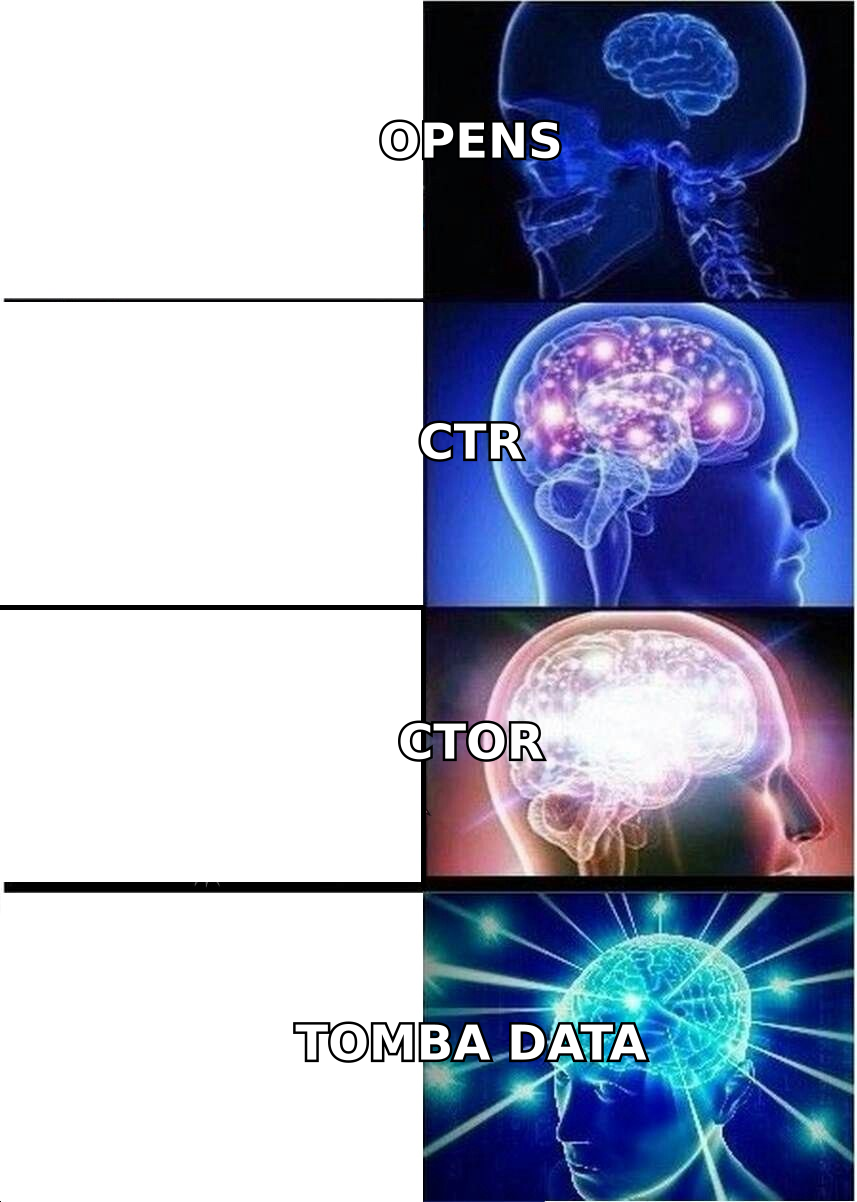
- CTR is a compound metric. It hides two separate problems: nobody opened, or everybody opened and nobody cared. Click-to-open rate (CTOR) splits them apart — 10–15% is healthy.
- Apple Mail Privacy Protection broke open rates in 2021 and never gave them back. Since then, CTR and reply rate are the only delivery-side numbers worth reporting to a board.
- The fastest CTR gain for most senders isn't copy. It's list hygiene: dead and role-based addresses inflate the denominator and drag your sender reputation down at the same time.
What is email click through rate, and how is it calculated?#
Click through rate is the percentage of delivered emails that produced at least one click on a link inside the message.
Think of it like a shop window. Deliverability decides whether your window faces the street at all. The subject line decides whether someone stops walking. The click is the moment they push the door open. CTR measures doors opened divided by people who walked past — which is why a great window and a terrible interior produce the same bad number as a hidden shop with a beautiful interior.
The formula:
CTR = (unique clicks ÷ delivered emails) × 100
Four measurement decisions change your number more than any copy tweak:
- Unique vs total clicks. Total clicks counts the same person clicking four times as four clicks. Unique counts one. Total-click CTR can run 30–60% higher on the same campaign. Every benchmark below uses unique clicks.
- Delivered vs sent. If your denominator is sent, hard bounces silently deflate your CTR. Always divide by delivered.
- Bot filtering. Security scanners at enterprise gateways pre-click every link in an email to check it. Unfiltered, this inflates B2B CTR by 0.5–2 percentage points, and it clusters on your biggest, most desirable accounts.
- Tracked links only. Plain-text cold email often carries no links at all. Its "CTR" is structurally zero, which is why outbound teams report reply rate instead.
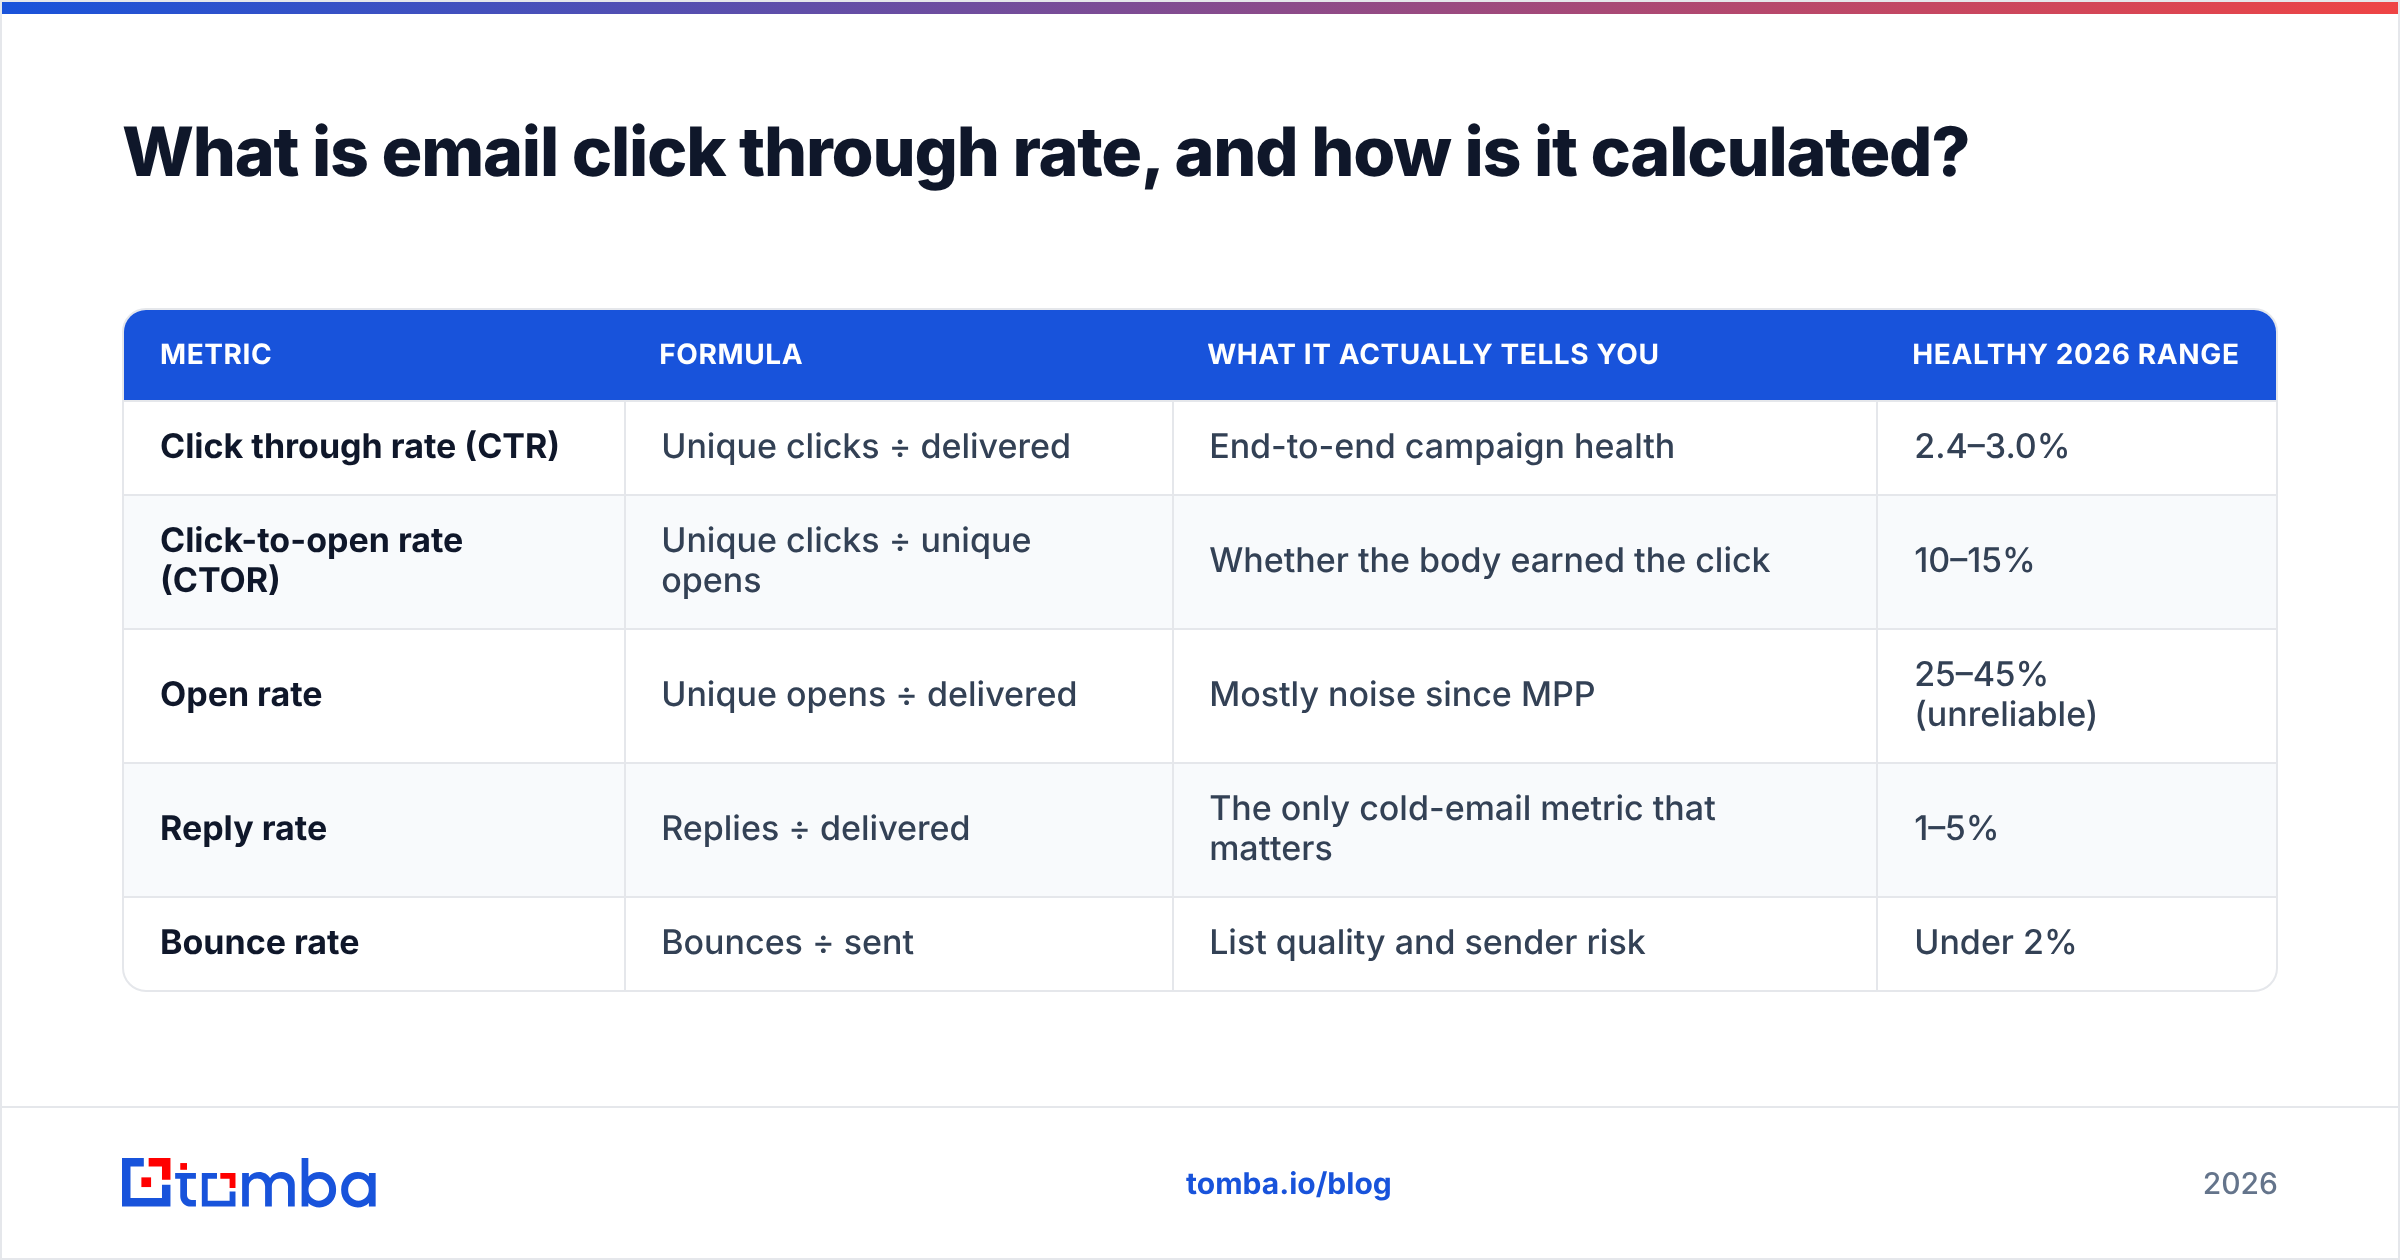
| Metric | Formula | What it actually tells you | Healthy 2026 range |
|---|---|---|---|
| Click through rate (CTR) | Unique clicks ÷ delivered | End-to-end campaign health | 2.4–3.0% |
| Click-to-open rate (CTOR) | Unique clicks ÷ unique opens | Whether the body earned the click | 10–15% |
| Open rate | Unique opens ÷ delivered | Mostly noise since MPP | 25–45% (unreliable) |
| Reply rate | Replies ÷ delivered | The only cold-email metric that matters | 1–5% |
| Bounce rate | Bounces ÷ sent | List quality and sender risk | Under 2% |
What is the email average click through rate in 2026?#
Roughly 2.6% across all industries — but the spread by sector is wide enough that the global average is nearly useless as a target.
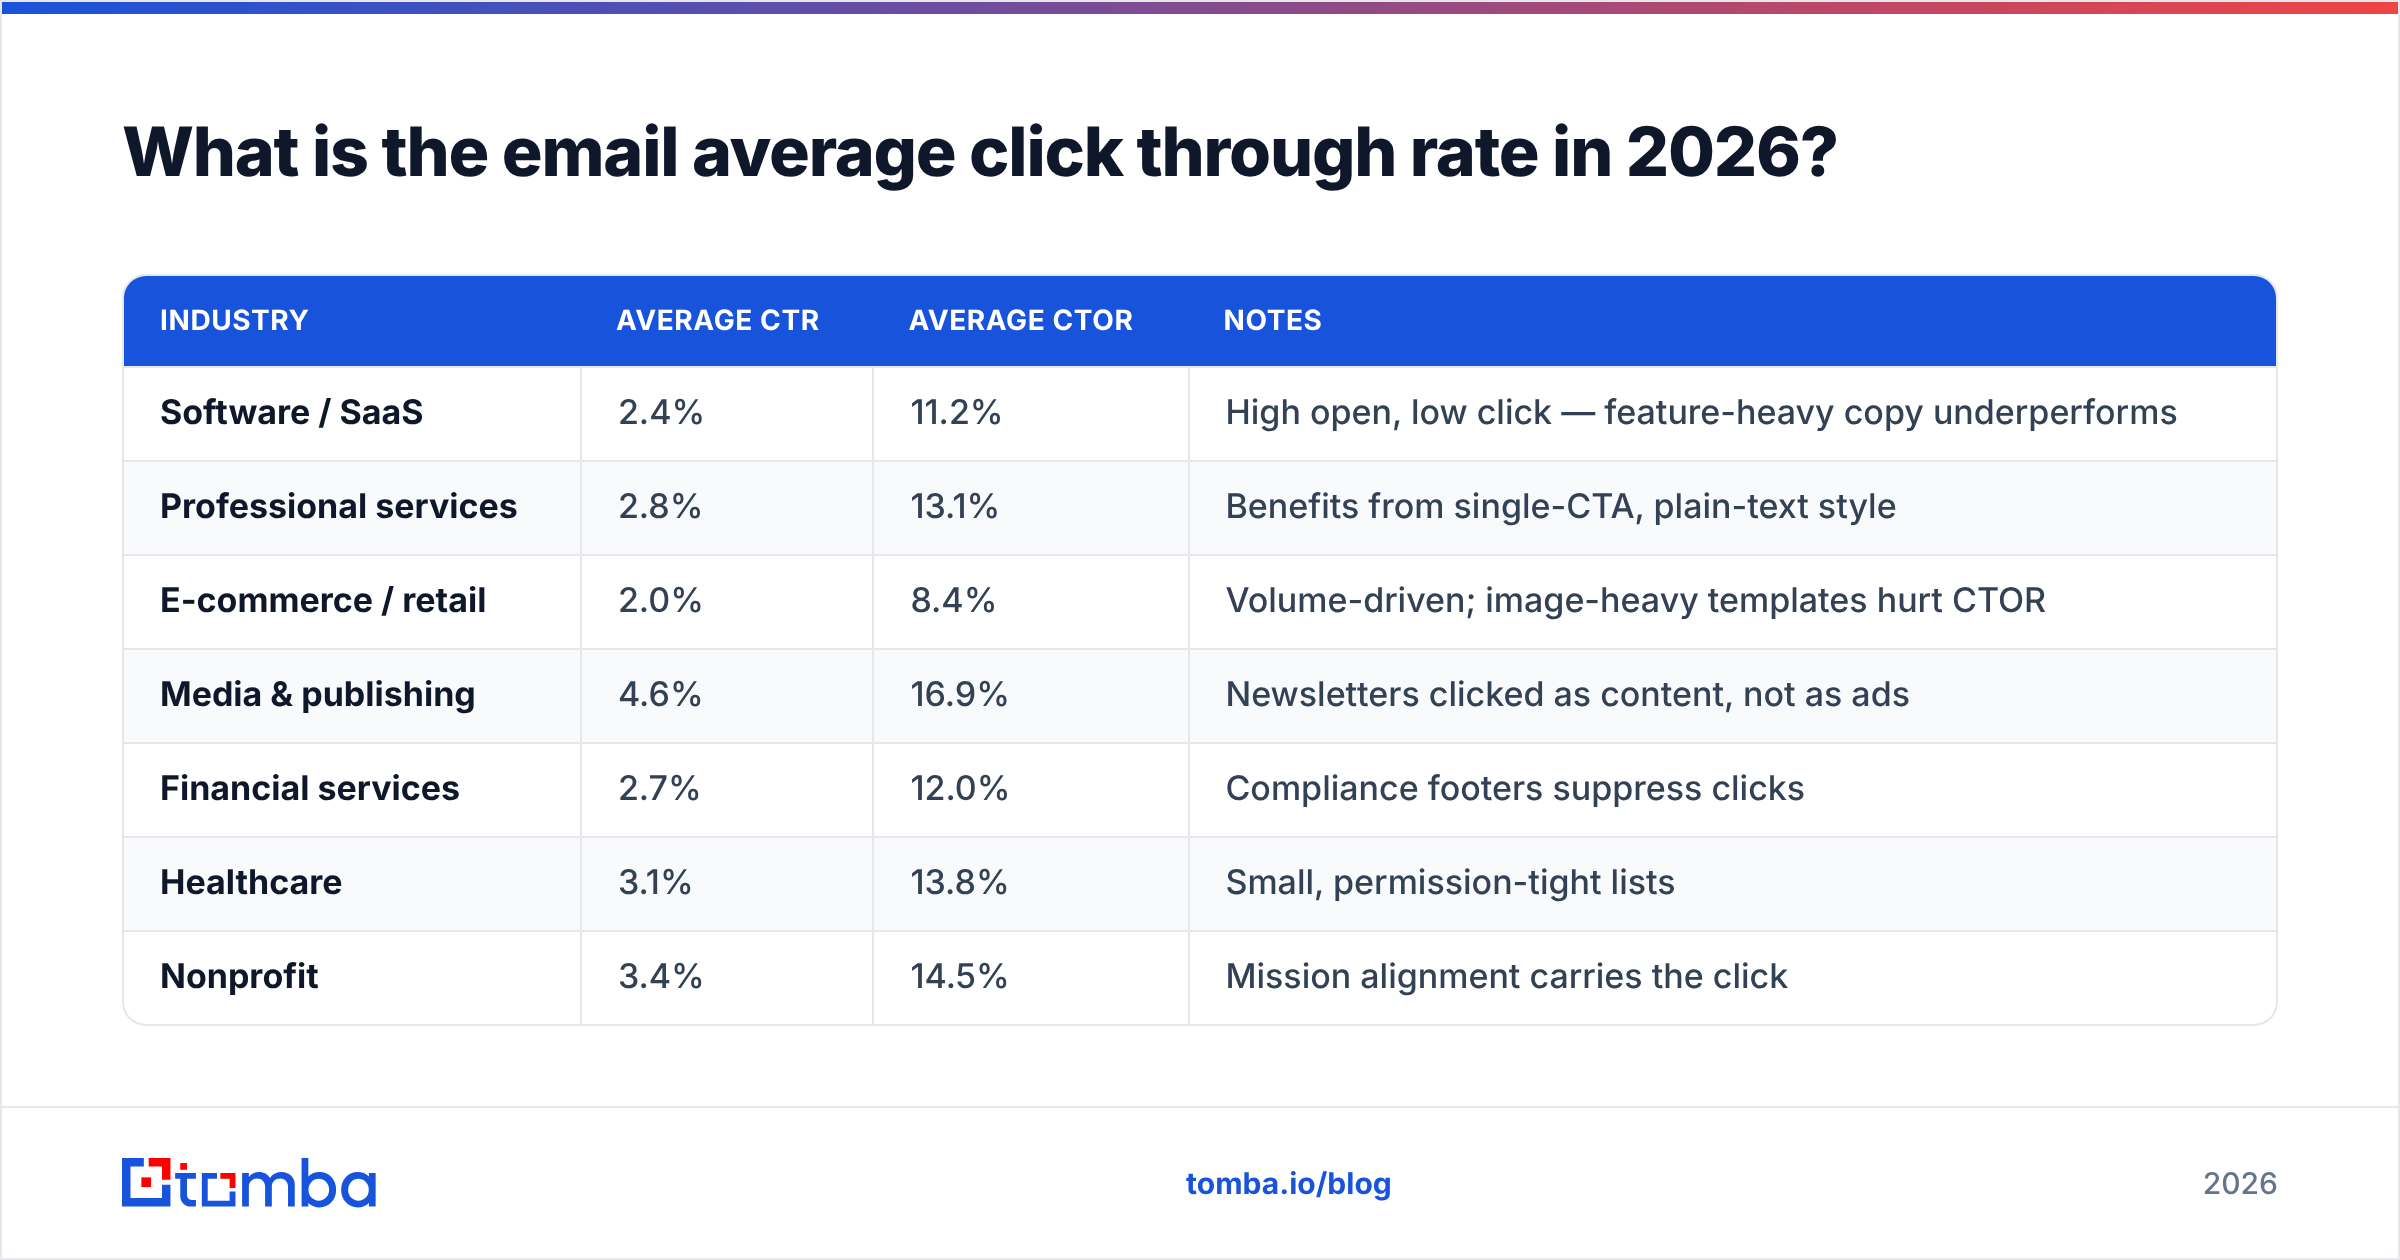
Aggregating the major public benchmark sets (Mailchimp, HubSpot, and platform-reported medians), the 2026 picture looks like this:
| Industry | Average CTR | Average CTOR | Notes |
|---|---|---|---|
| Software / SaaS | 2.4% | 11.2% | High open, low click — feature-heavy copy underperforms |
| Professional services | 2.8% | 13.1% | Benefits from single-CTA, plain-text style |
| E-commerce / retail | 2.0% | 8.4% | Volume-driven; image-heavy templates hurt CTOR |
| Media & publishing | 4.6% | 16.9% | Newsletters clicked as content, not as ads |
| Financial services | 2.7% | 12.0% | Compliance footers suppress clicks |
| Healthcare | 3.1% | 13.8% | Small, permission-tight lists |
| Nonprofit | 3.4% | 14.5% | Mission alignment carries the click |
| Recruiting / staffing | 2.2% | 9.6% | Heavy competition in the inbox |
Two things to take from this table.
First, media and publishing sits nearly double everyone else — not because their copy is better, but because the click is the product. If you're a SaaS company benchmarking against a newsletter, you're comparing a restaurant to a grocery store.
Second, the CTOR column is more diagnostic than the CTR column. E-commerce and SaaS both show weak CTOR, meaning people are opening and bouncing — a body-copy problem. Recruiting shows weak numbers across both, which usually means a list problem.
Is CTR or CTOR the better metric to report?#
Report both, but diagnose with CTOR.
Here's the analogy: CTR is your restaurant's total revenue. CTOR is revenue per customer who walked in. If revenue drops, you need to know whether fewer people came through the door or the ones who came ordered less. Those are opposite fixes.
- Low CTR + healthy CTOR (10%+) → a reach problem. Your copy converts fine; not enough inboxes are seeing it. Investigate email deliverability, authentication, and list decay.
- Healthy open rate + low CTOR (under 7%) → a message problem. The subject line wrote a check the body didn't cash. Rewrite the CTA, cut to one link, shorten by 40%.
- Low on both → a list problem. You're emailing people who never asked and don't match your ICP. No amount of copywriting fixes this.
The complication: since Apple Mail Privacy Protection began pre-fetching images in 2021, open rates are systematically inflated for Apple Mail users, which is 40–55% of most B2C lists and 25–35% of B2B lists. That means CTOR's denominator is polluted. Use CTOR for trend analysis against your own history — not for cross-company comparison — and treat any absolute CTOR benchmark with suspicion.
Why is your click through rate below average?#
In rough order of impact, based on what actually shows up in audits:
- Your list contains addresses that no longer exist. A 12-month-old B2B list decays around 22–30% per year through job changes alone. Every dead address is a delivered-count denominator that can never click — and a bounce that damages sender reputation. Running the list through an email verifier before a send typically lifts measured CTR by 0.3–0.8 points on its own, with zero copy changes.
- Role-based and catch-all addresses.
info@,sales@,support@almost never click. They pass basic syntax checks, they often accept mail, and they quietly cap your ceiling. Catch-all domains are worse — they accept everything, so they look valid and behave like a black hole. - You're sending seven links. Multiple CTAs split attention. Single-CTA emails consistently outperform multi-CTA emails on unique CTR, and the effect is largest in B2B where the reader is skimming on a phone between meetings.
- Image-only or heavy-HTML templates. Gmail clips messages over 102 KB. Clipped emails lose the CTA entirely. Plain-text-styled email routinely beats designed templates in B2B by 15–30% on CTOR.
- You landed in Promotions or Spam. No click happens from a folder nobody opens. Check your SPF record, DKIM, and DMARC alignment before blaming the copy.
- Wrong send-time for the segment. Smaller than people think — worth maybe 0.2 points — but free to fix.
How do cold email and marketing email CTR compare?#
They're different sports scored on the same scoreboard, which is why teams keep setting the wrong targets.
| Dimension | Cold outbound | Opt-in marketing email |
|---|---|---|
| Typical CTR | 0.5–2.5% (often untracked) | 2.4–3.0% |
| Primary success metric | Reply rate (1–5%) | CTR / conversions |
| Links per email | 0–1 | 2–6 |
| List source | Prospected + verified | Self-subscribed |
| Volume per day per inbox | 30–50 | Unlimited (reputation-bound) |
| Biggest CTR lever | Data accuracy | Offer + segmentation |
| Tracking pixel use | Often disabled (deliverability) | Standard |
The practical rule: if you're running cold outbound, stop optimizing CTR. Tracked links in cold email add deliverability risk and measure the wrong behavior. Your prospect replying "who is this?" is worth more than a click. Benchmark against response rate instead.
If you're running lifecycle or newsletter email to an opted-in list, CTR is your metric and the table above is your target band.
How do you actually improve your email average click through rate?#
Work the denominator before you work the creative. That order matters, because copy improvements applied to a rotten list produce noise, not signal.
Step 1 — Clean the denominator. Remove hard bounces, spam-trap patterns, role accounts, and unverifiable catch-alls. Use a catch-all verifier for the ambiguous ones rather than guessing. Target under 2% bounce on the next send.
Step 2 — Fix the source, not just the list. If contacts are scraped or bought, you'll re-clean the same rot every quarter. Sourcing verified contacts at acquisition time — by domain, by role, by name — means the list starts clean. Tomba's domain search returns addresses with a confidence score and the pattern they were derived from, so you know why an address is believed valid.
Step 3 — Segment to at least four buckets. Industry, role seniority, engagement recency, and lifecycle stage. Sending one email to everyone guarantees it's slightly wrong for everyone. Segmented campaigns typically show 1.5–2x the CTR of broadcast sends.
Step 4 — One email, one job, one link. Cut the newsletter round-up habit for anything that isn't literally a newsletter. Put the CTA above the fold and repeat it once at the end.
Step 5 — Test the subject line, then the first line. The subject determines the open; the first 40 characters of preview text determine whether the open survives. Run candidates through a subject line tester before you commit to a 40,000-contact send.
Step 6 — Measure over 90 days, not per campaign. Single-campaign CTR is dominated by noise at list sizes under 5,000. Track the rolling median.
What CTR should you set as your target?#
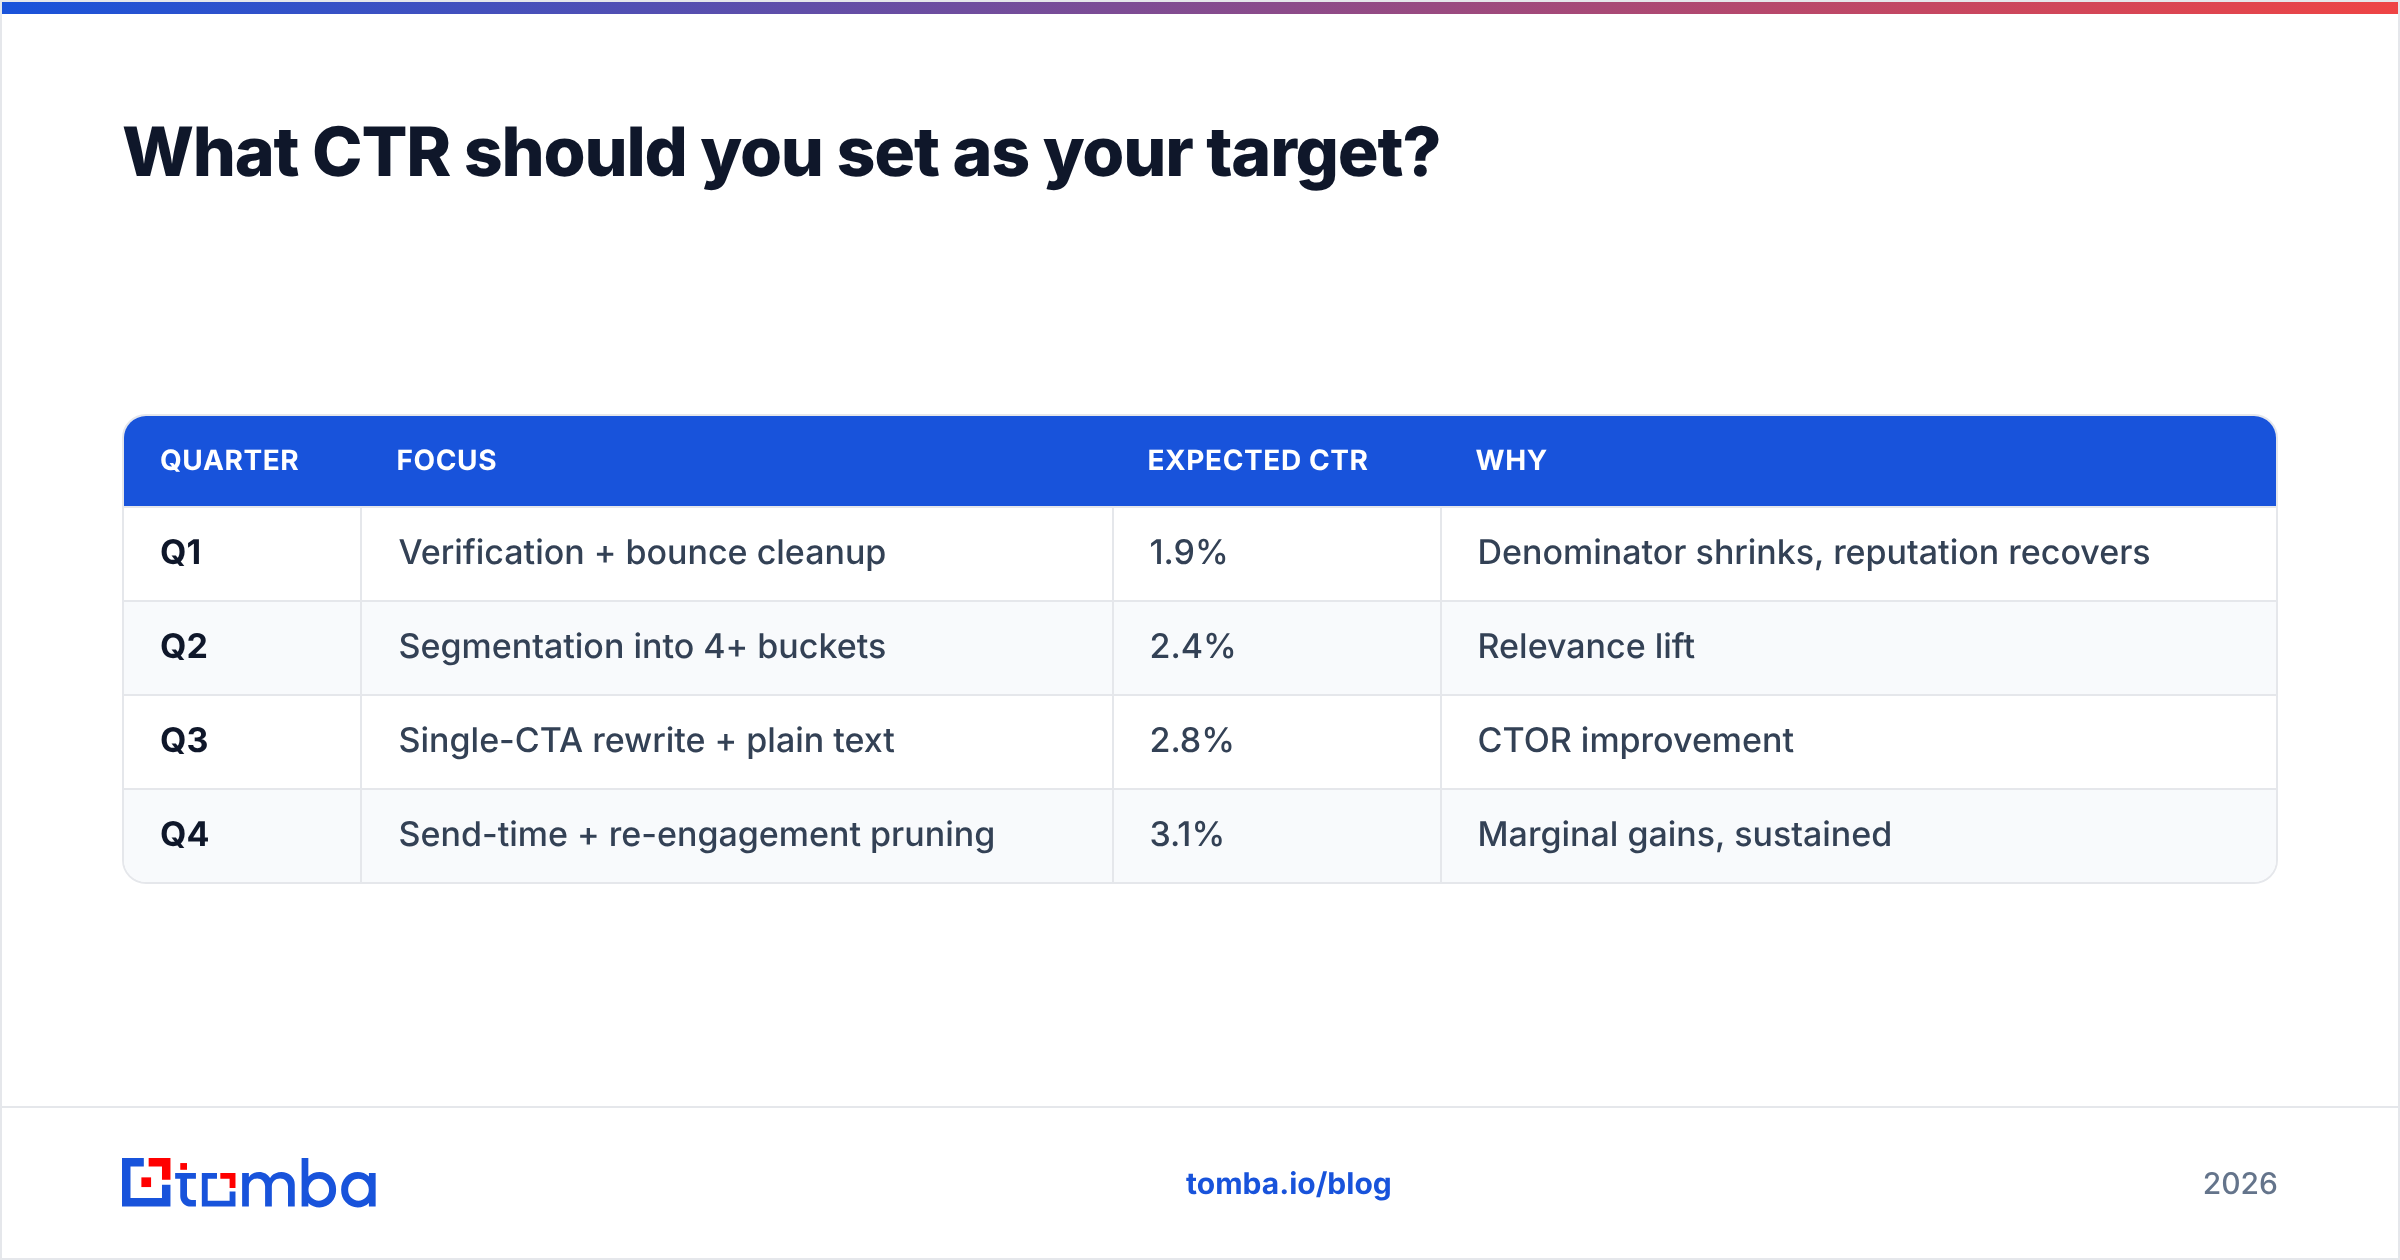
Set your target from your own last-90-day median, not from a public benchmark.
A realistic sequence for a B2B team currently at 1.4% CTR:
| Quarter | Focus | Expected CTR | Why |
|---|---|---|---|
| Q1 | Verification + bounce cleanup | 1.9% | Denominator shrinks, reputation recovers |
| Q2 | Segmentation into 4+ buckets | 2.4% | Relevance lift |
| Q3 | Single-CTA rewrite + plain text | 2.8% | CTOR improvement |
| Q4 | Send-time + re-engagement pruning | 3.1% | Marginal gains, sustained |
Anything promising a jump from 1.4% to 6% in one quarter is either changing the measurement (total clicks instead of unique) or shrinking the list to only the most engaged 10% — which flatters the rate and kills the pipeline. The honest Wikipedia definition of click-through rate is worth re-reading whenever a vendor quotes a suspiciously round number.
What's the single biggest hidden drag on CTR?#
Stale contact data — and it's invisible because it doesn't throw an error.
A contact who changed jobs eight months ago still has a syntactically valid address. Some corporate mail servers accept mail for departed employees indefinitely. That address will never bounce, never click, and never unsubscribe. It just sits in the denominator, quietly costing you a fraction of a percentage point per send, forever.
At B2B job-change rates, a list you built two years ago and never re-verified is 35–45% ghosts. That alone can explain the gap between a 1.6% CTR and a 2.6% one — before anyone opens a copy doc. This is why bulk verification before every major send is cheaper than the campaign it protects, and why re-sourcing key accounts beats re-mailing them.
Where to start#
If your CTR is under the 2.4% floor, run the diagnostic in this order: bounce rate first, then CTOR, then copy. Nine times out of ten the answer surfaces before you reach copy.
To fix the data layer at the source, start with the Tomba Email Finder — search by domain, name, or company, get a confidence score and the derivation pattern on every result, and export straight into your sequencer. The free tier includes 25 searches a month so you can benchmark accuracy against your existing list before paying anything; paid plans start at $49/mo, with full details on the Tomba pricing page. Clean the denominator, and the average takes care of itself.
Related guides#
Ready to find emails that actually work?
Join 150,000+ professionals who stopped guessing and started sending. Free credits on signup — no credit card required.
Get the Tomba newsletter
Practical outbound tactics and product updates — once every two weeks.
About the author