Email Campaign Metrics to Track in 2026: The Complete Guide
Open rate broke in 2021 and never really recovered. Here are the email campaign metrics that still predict revenue in 2026, the benchmarks worth measuring against, and the fixes for each number when it slips.
TL;DR
- Open rate is no longer a trustworthy signal. Apple Mail Privacy Protection, Gmail image proxying, and security scanners inflate it by 20–60% depending on your list mix.
- Track four layers in order: delivery (did it arrive), engagement (did a human react), conversion (did it create pipeline), and health (are you burning the domain).
- Reply rate, positive reply rate, bounce rate, spam complaint rate, and meetings-per-1,000-sends are the five numbers that actually move with campaign quality.
- Google and Yahoo's bulk-sender rules make spam complaint rate a hard gate: stay under 0.3%, aim for under 0.1%.
- Most metric problems are data problems. A 6% bounce rate is a list-hygiene failure, not a copy failure — fix the input before you rewrite the subject line.
What are email campaign metrics, and which ones actually matter?#
Email campaign metrics are the measurements that tell you whether a send reached an inbox, got a human response, and produced revenue. Most teams track twelve of them and act on two.
The useful mental model is a funnel with four layers. Each layer can only be as good as the one above it. A 9% reply rate on a campaign that delivered to 60% of its list is worse in absolute terms than a 4% reply rate delivering at 97%. If you only look at percentages of delivered mail, you can post beautiful dashboards while your domain quietly dies.
- Delivery metrics — bounce rate, delivery rate, inbox placement rate. These answer: did the message physically arrive in a mailbox a person opens?
- Engagement metrics — reply rate, positive reply rate, click rate, unsubscribe rate. These answer: did a human read it and do something?
- Conversion metrics — meetings booked, opportunities created, pipeline value, cost per meeting. These answer: did it make money?
- Health metrics — spam complaint rate, sender reputation score, domain age vs. volume ratio, seed-list placement. These answer: can you keep doing this next quarter?
The order matters. Debug top-down. Teams that debug bottom-up spend three weeks A/B testing CTAs on a campaign that was landing in Promotions the whole time.
Why did open rate stop being a reliable metric?#
Open rate broke in September 2021 when Apple shipped Mail Privacy Protection, which pre-fetches tracking pixels for every message regardless of whether the recipient looked at it. Apple Mail accounts for a large share of B2B mobile reading, so any list with a meaningful iOS population reports opens that never happened.
Three other things inflate it:
- Corporate security scanners. Proofpoint, Mimecast, and Microsoft Defender for Office 365 detonate links and load remote content in sandboxes. Enterprise-heavy lists get phantom opens and phantom clicks.
- Image proxying. Gmail caches images through its own servers, which decouples the fetch from the human.
- Your own tooling. Sending yourself test copies, warmup traffic mixing into the same inbox, and CRM sync loops all pollute the counter.
Open rate is not useless — it is directionally useful when compared against itself on the same list, same ESP, same week. It is worthless as an absolute benchmark and dangerous as a KPI, because it can be pushed up by tactics (subject-line clickbait, sending to bigger lists) that push reply rate down.

If your team still reports open rate to leadership, add a second column next to it: replies per 1,000 sends. The gap between the two tells you how much of your "engagement" is machinery.
Which email campaign metrics should you track in 2026?#
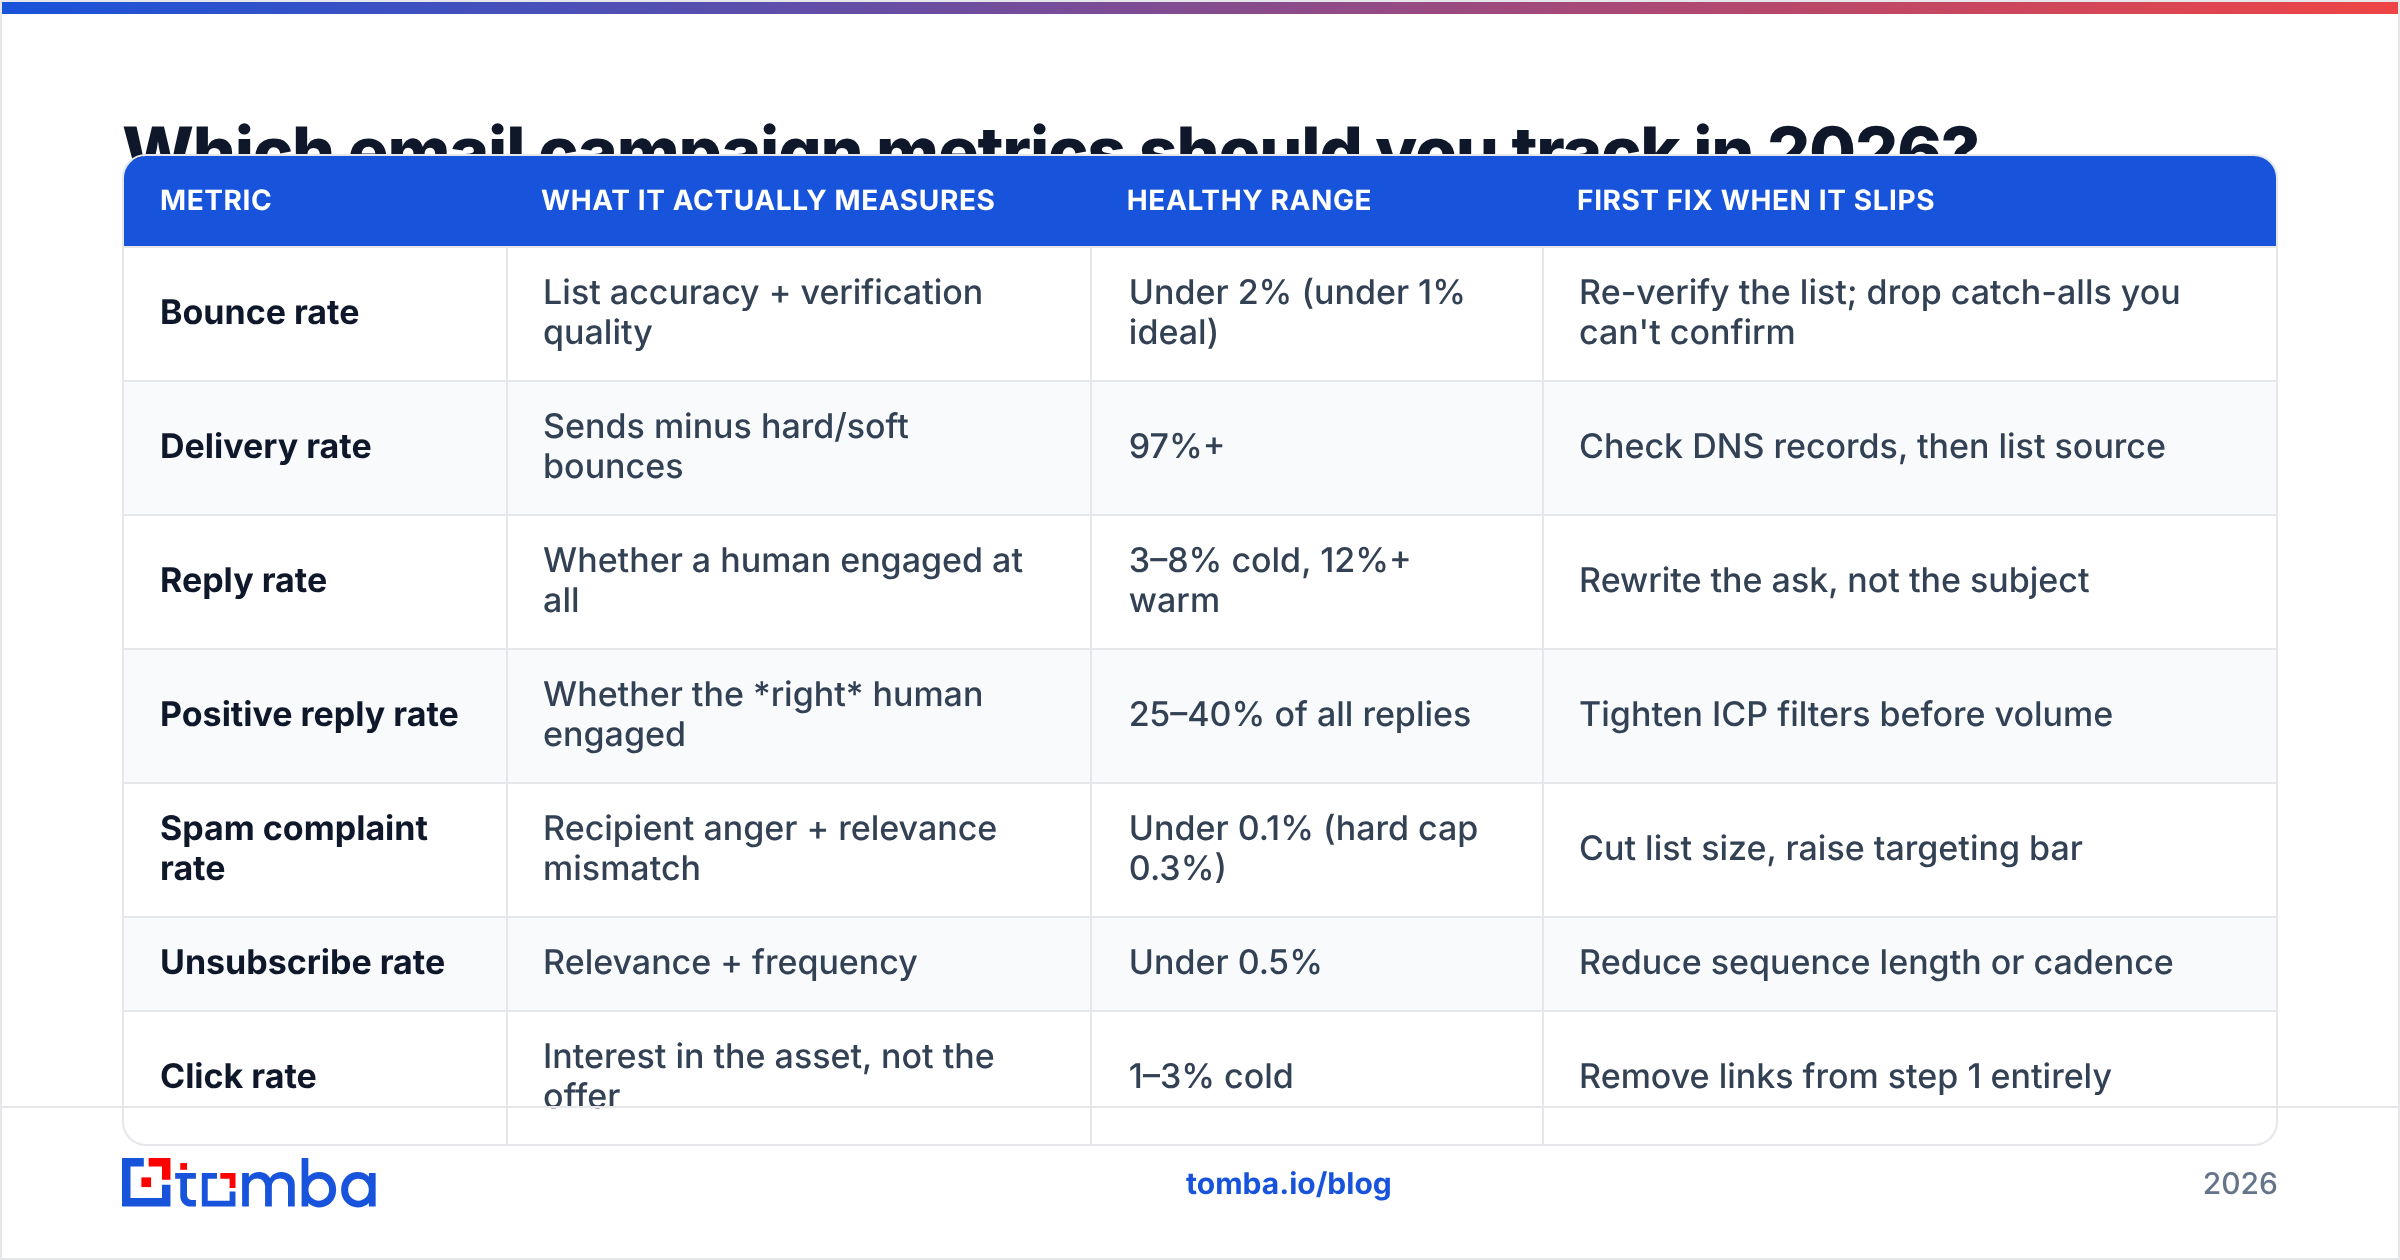
Here is the working set. Benchmarks below are for B2B cold and semi-warm outbound to verified business addresses — newsletter and lifecycle programs run higher on clicks and much lower on replies.
| Metric | What it actually measures | Healthy range | First fix when it slips |
|---|---|---|---|
| Bounce rate | List accuracy + verification quality | Under 2% (under 1% ideal) | Re-verify the list; drop catch-alls you can't confirm |
| Delivery rate | Sends minus hard/soft bounces | 97%+ | Check DNS records, then list source |
| Reply rate | Whether a human engaged at all | 3–8% cold, 12%+ warm | Rewrite the ask, not the subject |
| Positive reply rate | Whether the right human engaged | 25–40% of all replies | Tighten ICP filters before volume |
| Spam complaint rate | Recipient anger + relevance mismatch | Under 0.1% (hard cap 0.3%) | Cut list size, raise targeting bar |
| Unsubscribe rate | Relevance + frequency | Under 0.5% | Reduce sequence length or cadence |
| Click rate | Interest in the asset, not the offer | 1–3% cold | Remove links from step 1 entirely |
| Meetings per 1,000 sends | The only number finance cares about | 3–10 | Work backward through the funnel |
| Sequence step decay | Whether follow-ups are earning their place | Step 3 ≥ 40% of step 1 replies | Kill steps that convert under 15% |
| Domain volume ratio | Sending pressure per mailbox | Under 50/day per mailbox | Add mailboxes, not volume |
Two notes on this table. First, positive reply rate is the most under-tracked metric in outbound. A campaign with a 9% reply rate where 80% of replies are "unsubscribe" or "wrong person" is worse than a 4% campaign where half the replies want a call. Tag every reply into four buckets — interested, not now, wrong person, negative — and report the split.
Second, meetings per 1,000 sends normalizes across campaign sizes so you can compare a 400-contact ABM push against a 12,000-contact list build without the big list winning by default.
How do delivery metrics differ from engagement metrics?#
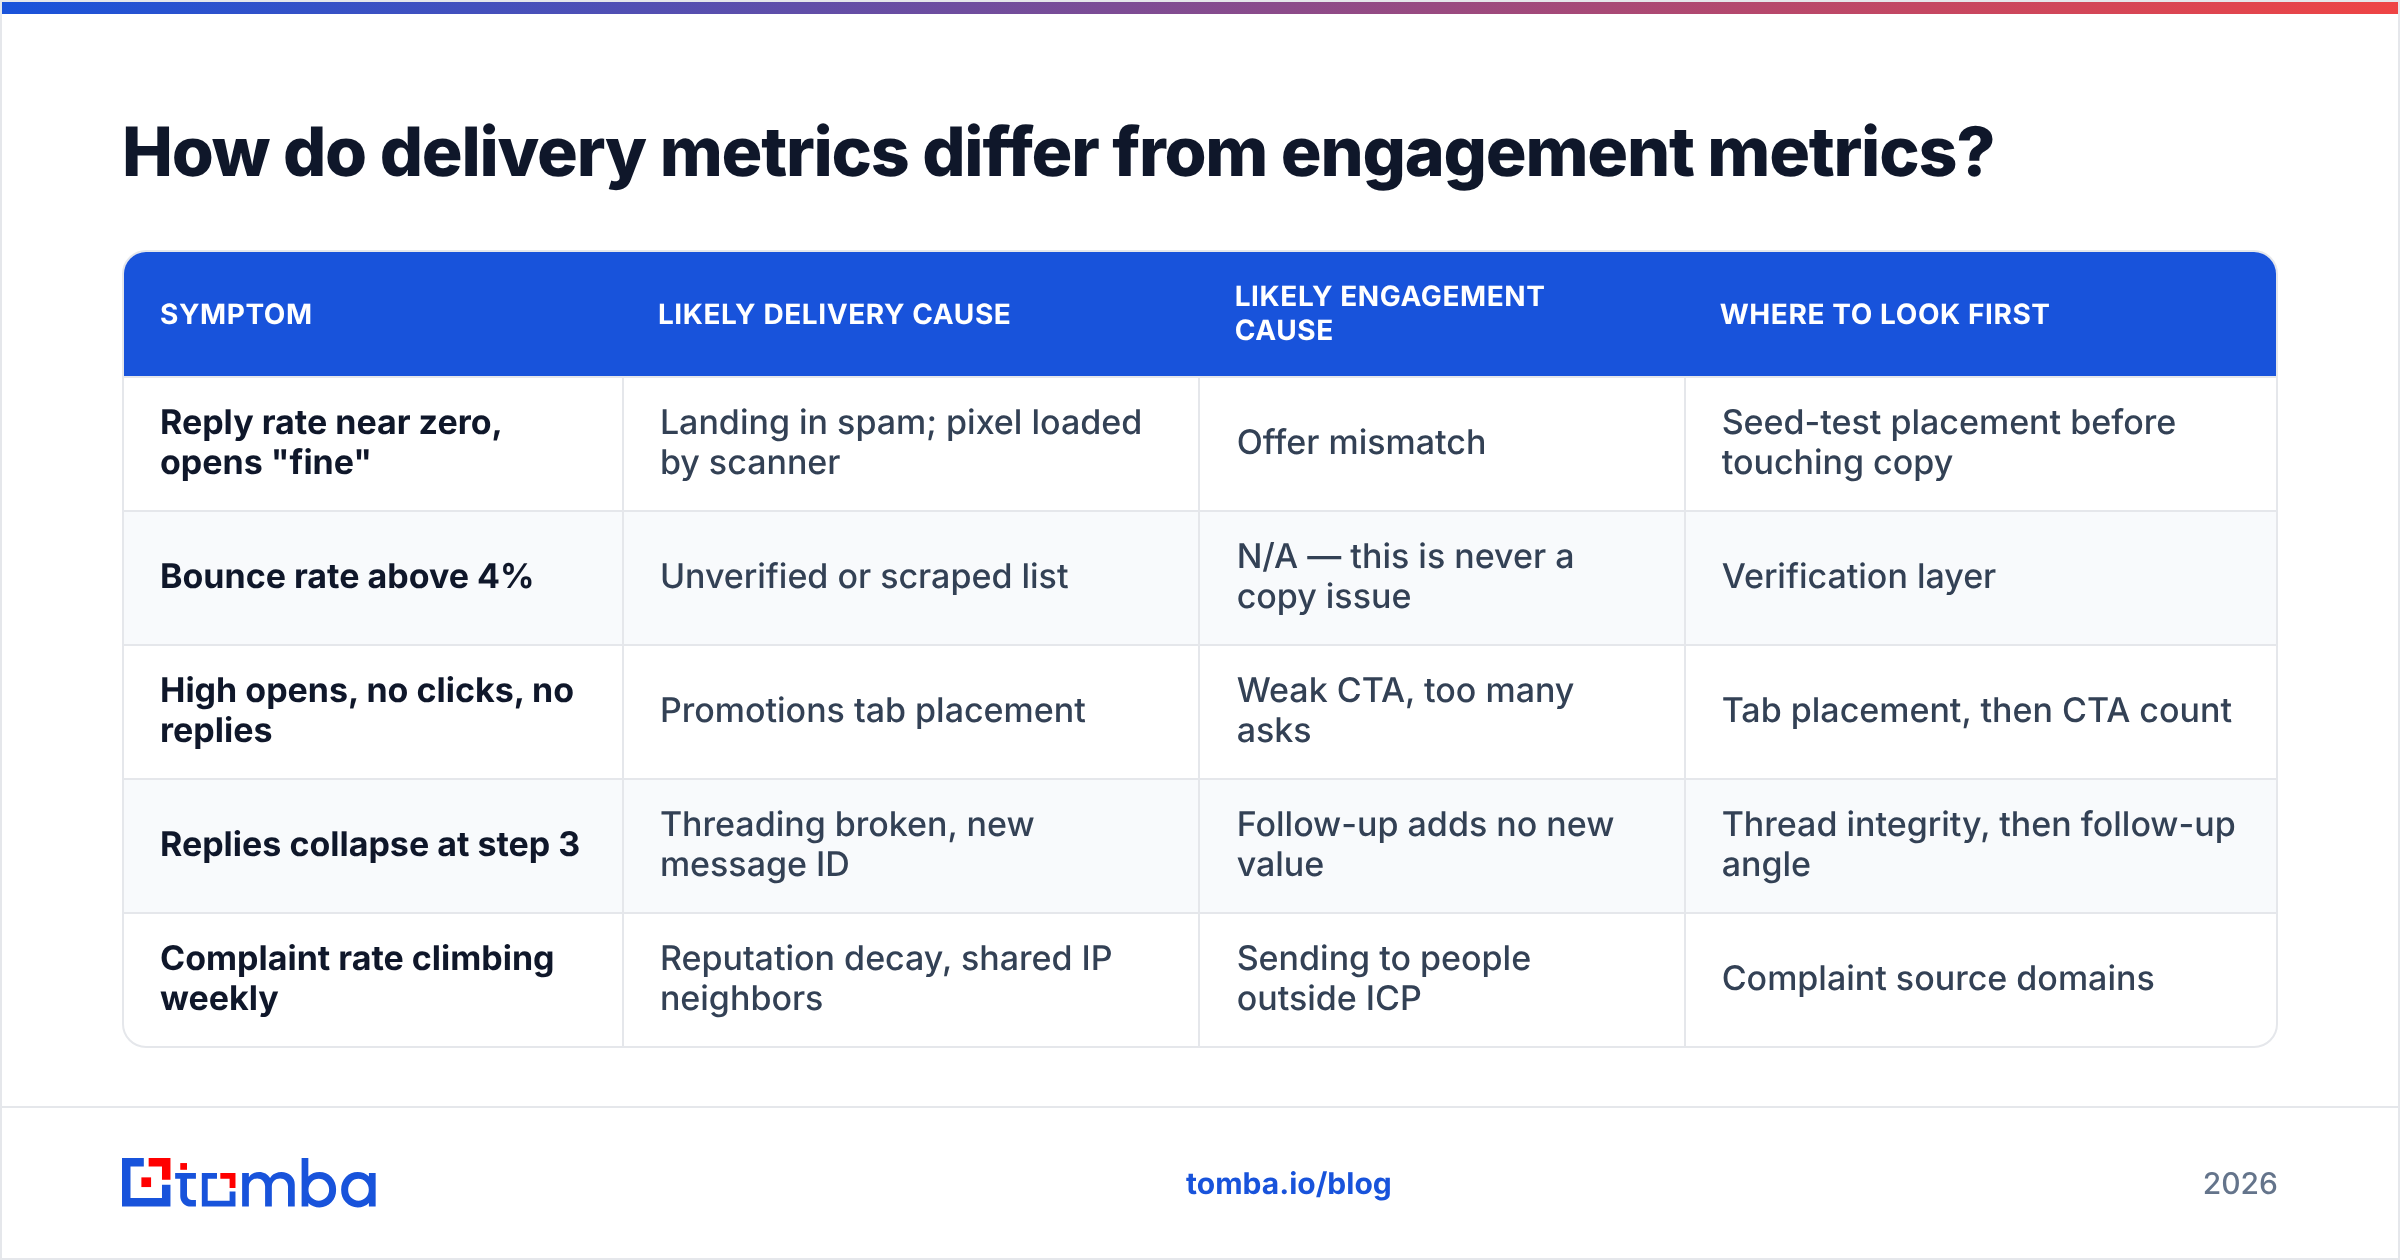
Delivery metrics are mostly infrastructure and data problems. Engagement metrics are mostly targeting and copy problems. Confusing the two is the single most expensive diagnostic mistake in outbound.
| Symptom | Likely delivery cause | Likely engagement cause | Where to look first |
|---|---|---|---|
| Reply rate near zero, opens "fine" | Landing in spam; pixel loaded by scanner | Offer mismatch | Seed-test placement before touching copy |
| Bounce rate above 4% | Unverified or scraped list | N/A — this is never a copy issue | Verification layer |
| High opens, no clicks, no replies | Promotions tab placement | Weak CTA, too many asks | Tab placement, then CTA count |
| Replies collapse at step 3 | Threading broken, new message ID | Follow-up adds no new value | Thread integrity, then follow-up angle |
| Complaint rate climbing weekly | Reputation decay, shared IP neighbors | Sending to people outside ICP | Complaint source domains |
Run a placement seed test before every large campaign. If you skip it, every engagement number you collect afterward is measured on an unknown denominator.
The delivery side also has hard external constraints now. Google's bulk sender requirements ask for authenticated mail (SPF, DKIM, DMARC), one-click unsubscribe, and a spam rate held below 0.3% — you can read the current rules in Google's own sender guidelines. Treat 0.3% as a cliff, not a target. Once you cross it, you are not optimizing metrics anymore; you are rebuilding a domain.
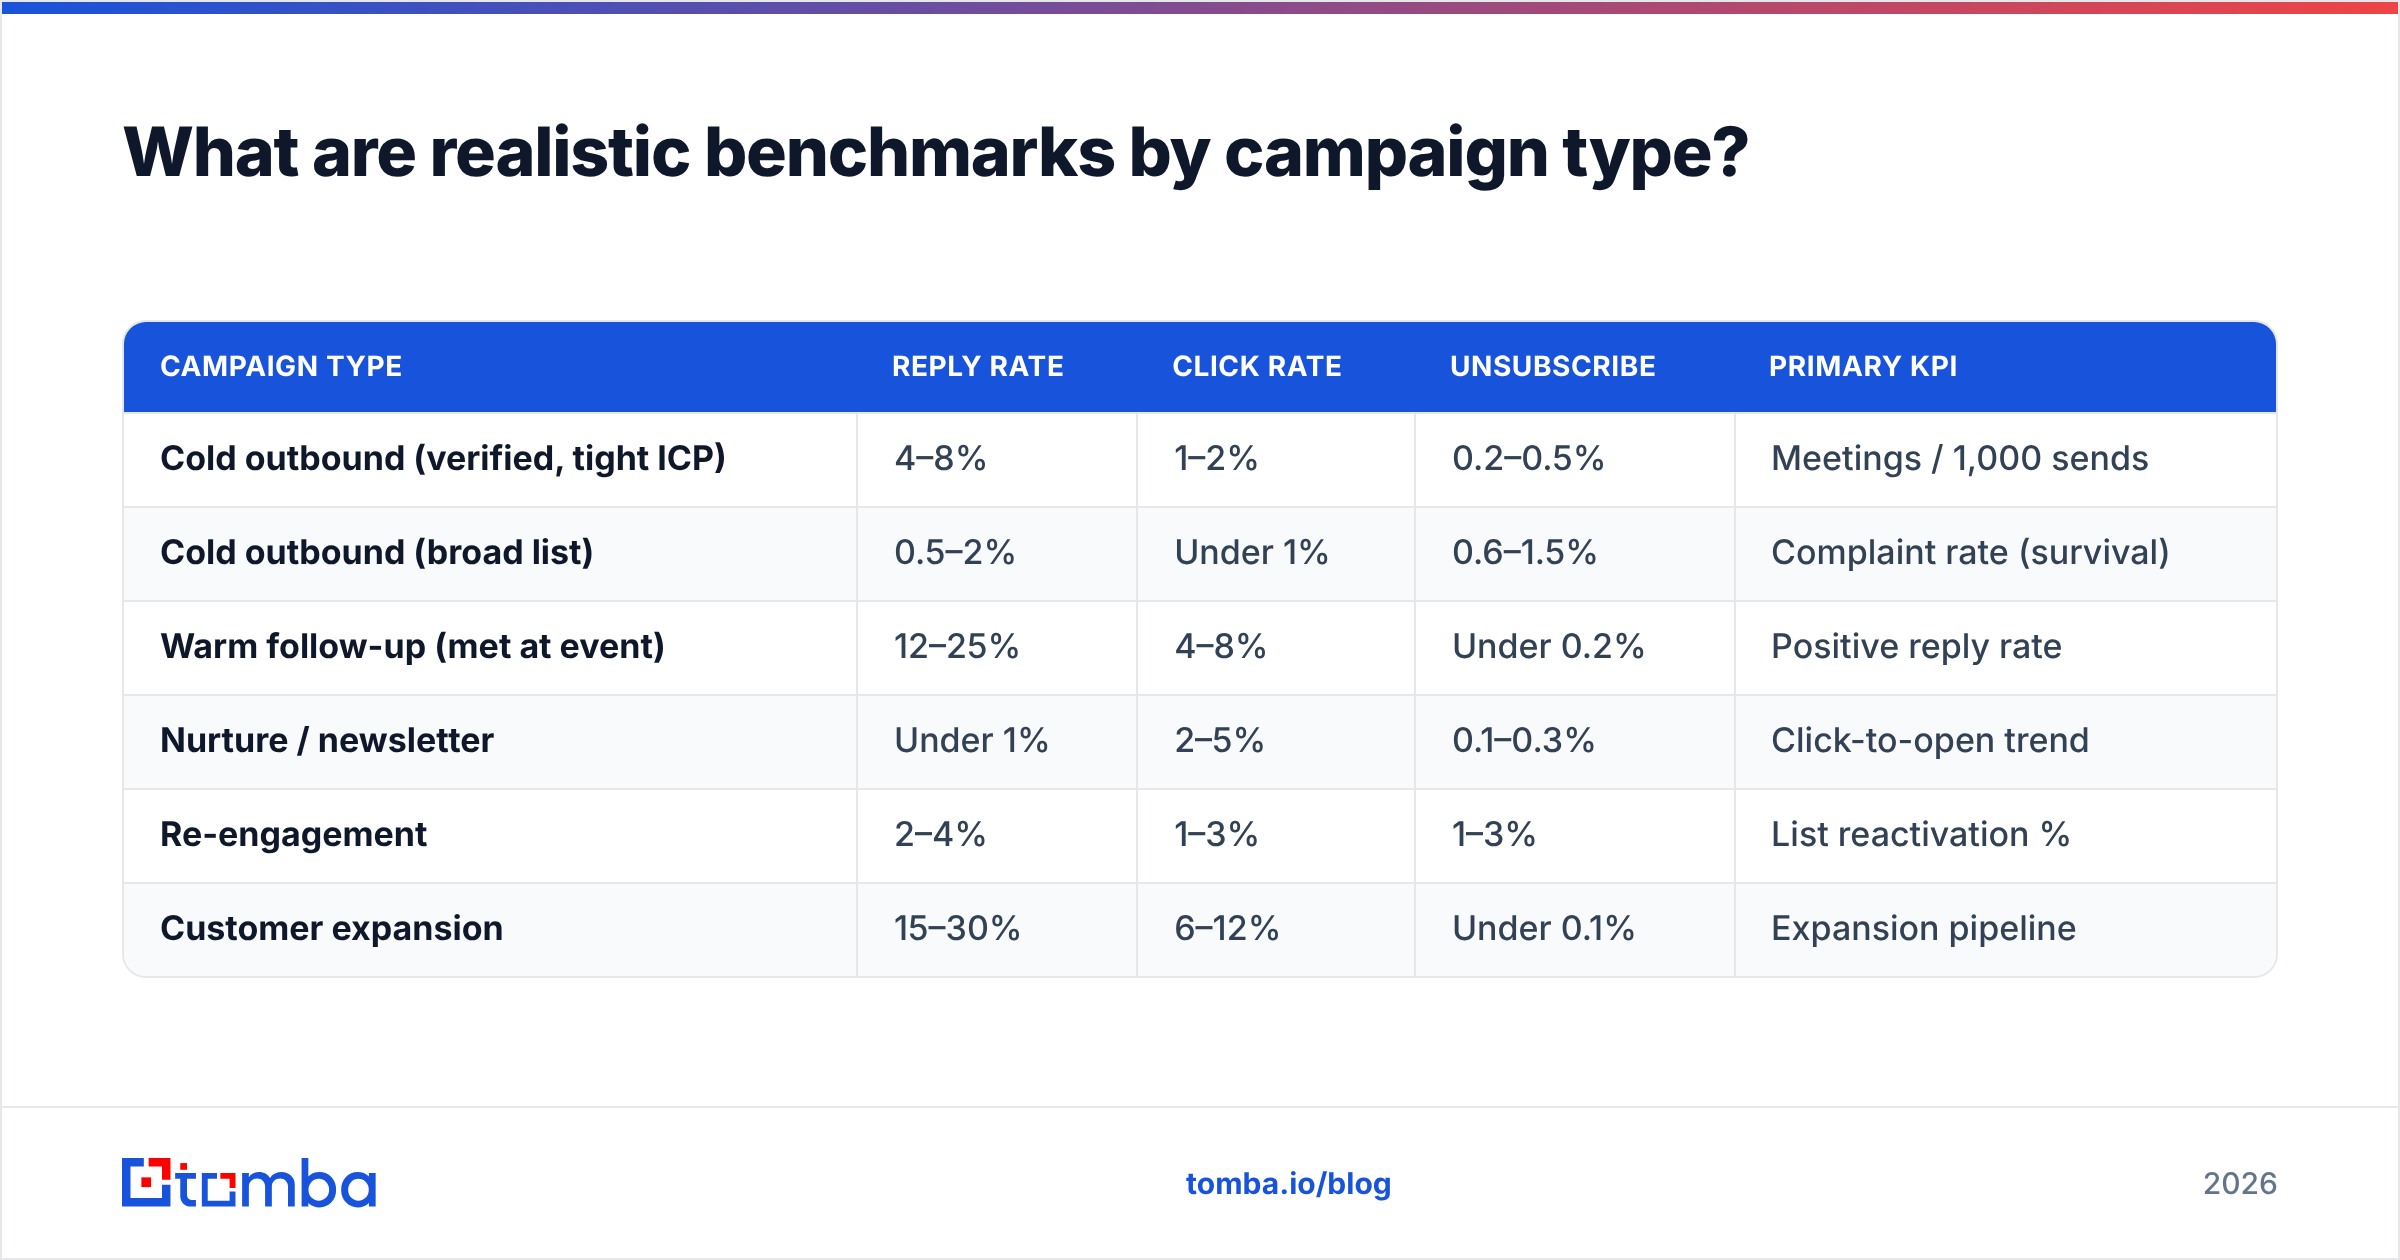
What are realistic benchmarks by campaign type?#
Benchmarks only mean something inside a category. Comparing a cold prospecting sequence against a product newsletter is comparing a cold call to a customer QBR.
| Campaign type | Reply rate | Click rate | Unsubscribe | Primary KPI |
|---|---|---|---|---|
| Cold outbound (verified, tight ICP) | 4–8% | 1–2% | 0.2–0.5% | Meetings / 1,000 sends |
| Cold outbound (broad list) | 0.5–2% | Under 1% | 0.6–1.5% | Complaint rate (survival) |
| Warm follow-up (met at event) | 12–25% | 4–8% | Under 0.2% | Positive reply rate |
| Nurture / newsletter | Under 1% | 2–5% | 0.1–0.3% | Click-to-open trend |
| Re-engagement | 2–4% | 1–3% | 1–3% | List reactivation % |
| Customer expansion | 15–30% | 6–12% | Under 0.1% | Expansion pipeline |
For broader industry-wide context on open and click averages across verticals, Mailchimp's benchmark data is the most commonly cited public dataset, and HubSpot's marketing statistics covers B2B-specific engagement patterns. Use them as sanity checks, not as targets — both skew toward opt-in marketing lists, which behave very differently from outbound.

How do you track these metrics without a full BI stack?#
You do not need a warehouse to run a competent metrics program. You need consistent definitions and one place where sends and outcomes meet.
- Fix your denominators first. Decide once whether rates are calculated on sent or delivered, write it down, and never change it mid-quarter. Most tools default to delivered, which flatters every number.
- Tag replies at the point of reply. Four buckets, applied by the rep within 24 hours: interested, not now, wrong person, negative. This one habit produces positive reply rate, ICP accuracy, and routing data at zero extra cost.
- Instrument at the contact level, not the campaign level. Store which list, which source, which verification status, and which sequence each contact belongs to. Campaign-level averages hide the fact that one bad list segment is dragging everything down.
- Separate mailbox metrics from campaign metrics. Track bounce and complaint rate per sending mailbox and domain, not just per campaign. Reputation damage is a property of the domain, and it will follow you into your next campaign.
- Review weekly, act monthly. Weekly reviews catch delivery breakage. Monthly reviews are the right cadence for copy and targeting changes, because you need enough volume for the difference to mean anything.
- Keep a kill list. Any sequence step converting under 15% of step-one replies gets removed after two full cycles. Sequences grow to seven steps by inertia, not evidence.
If you run outbound at any real volume, add email verification as a scheduled job rather than a one-time import step. Business emails decay at roughly 2–3% per month through role changes and departures, so a list verified in January is meaningfully worse by April.
Which metrics are vanity metrics you can safely ignore?#
Four numbers appear on almost every dashboard and change almost no decisions.
- Raw open rate. Covered above. Keep it as a trend line inside a single campaign family; never report it as a KPI or use it to declare a subject-line winner.
- Total emails sent. A volume number dressed as a performance number. It only tells you how hard your machinery ran.
- Click-to-open rate on cold email. The denominator is already corrupted by pixel inflation, so the ratio inherits the corruption.
- List size. A 40,000-contact list with a 5% bounce rate is a liability. A 3,000-contact verified list targeted at a real ICP outperforms it on every metric that matters, including total meetings.
The test for a vanity metric is simple: name the decision you would make differently if the number doubled. If you cannot, stop reporting it.
How does data quality change your metrics?#
More than copy does. This is the uncomfortable finding most teams reach after a year of testing.
Bad contact data damages metrics in three compounding ways. Hard bounces hit delivery directly and signal to mailbox providers that you do not maintain your list. Wrong-person sends generate "not me" replies that look like engagement in a dashboard but consume rep time and occasionally become complaints. And catch-all domains accept everything at the SMTP layer, so they never bounce — they silently vanish, quietly deflating your reply rate with sends that were never deliverable in a human sense.
That last one is why bounce rate alone is an incomplete health check. A list stuffed with unresolved catch-alls can post a 0.8% bounce rate and still have 20% of its volume going nowhere. Track unknown/risky as its own bucket alongside valid and invalid, and either resolve those addresses or exclude them from your rate denominators.
The same logic applies at acquisition. Where you source contacts sets the ceiling on every downstream metric. Pattern-guessed addresses ("first.last@") produce predictable bounce spikes; addresses confirmed against live sources do not. If your verification and sourcing sit in different tools with different definitions of "valid", you will spend months arguing about whose number is right. It is also worth reading up on how email deliverability is scored by providers, because most of what looks like a copy problem is a reputation problem with a copy-shaped shadow.
How do you build a weekly metrics review that changes behavior?#
Keep it to fifteen minutes and five questions.
- Did delivery hold? Bounce rate, complaint rate, and per-mailbox volume. Anything red stops all sending on that domain until fixed.
- Did positive reply rate move? Not total replies. The interested-plus-not-now share.
- Which segment underperformed? Always slice by list source and job title before slicing by copy variant.
- What did we kill? One step, one segment, or one sequence, every week. Programs only stay lean if something dies on schedule.
- What is the cost per meeting? Tools, data, and rep hours divided by meetings held. This is the number that survives a budget review.
If your sequencing tool and your data tool report different send counts, reconcile that before anything else. Two sources of truth means zero.
Where should you start if you only fix one thing?#
Fix the input. Verified, correctly targeted contact data improves bounce rate, complaint rate, reply rate, and positive reply rate at the same time — no copy change touches four metrics at once.
Tomba's Email Finder is built for exactly that first step: find verified professional addresses by domain, name, or company, with confidence scoring and source attribution so you know why an address is considered valid before you send to it. It plugs into the rest of the stack through the Tomba API, Sheets, and CRM integrations, and the free tier gives you 25 searches a month to test against a segment you already have data on. Paid plans start at $49/mo (Starter), $99/mo (Growth), and $249/mo (Pro) — full details on Tomba pricing.
Run your next campaign against a verified list, hold the copy constant, and compare bounce rate and positive reply rate against your last send. That single controlled test will tell you more about your program than a quarter of subject-line experiments.
Related guides#
Ready to find emails that actually work?
Join 150,000+ professionals who stopped guessing and started sending. Free credits on signup — no credit card required.
Get the Tomba newsletter
Practical outbound tactics and product updates — once every two weeks.
About the author