Email Click Through Rate Benchmarks by Industry (2026 Data)
Median B2B email CTR sits near 2.3% — but that number is useless without industry context. Here are 2026 click-through benchmarks by vertical, plus how to read them without fooling yourself.
TL;DR
- Median email click-through rate across industries lands between 1.4% and 3.9% in 2026, depending on vertical, send type, and how the sender defines a "click."
- Government, education, and nonprofit consistently post the highest CTRs (3%+). Retail, real estate, and marketing agencies sit at the bottom (1.2–1.9%).
- CTR alone is a vanity metric. Click-to-open rate (CTOR) tells you whether the email worked; CTR tells you whether the list and subject line worked.
- Apple Mail Privacy Protection has broken open rates since 2021 — which is exactly why CTR became the default health metric, and why 2026 benchmarks look different from 2020 ones.
- The fastest CTR gain for most B2B senders isn't copy. It's removing the 18–30% of a purchased list that never should have been mailed.
What is email click-through rate, and how is it actually calculated?#
Click-through rate is the percentage of delivered emails that produced at least one click on a link inside the message.
CTR = (unique clicks / delivered emails) × 100Two things trip people up here.
First, delivered vs. sent. If you calculate against sent, every bounce drags your number down and your CTR looks worse than reality. Most ESPs report against delivered. Some don't. Check before you compare yourself to anything.
Second, unique vs. total clicks. Total clicks counts a recipient who clicked your CTA four times as four clicks. Unique counts them once. Total-click CTR can run 30–60% higher than unique-click CTR on the same campaign. Benchmark tables almost always mean unique. If yours doesn't, you're grading on a curve nobody else is using.
There's a third distortion nobody talks about enough: bot clicks. Corporate security gateways — Microsoft Defender for Office 365, Proofpoint, Mimecast — pre-fetch and detonate every link in an inbound email before delivery. In heavily-gated verticals (finance, healthcare, government), 15–40% of recorded "clicks" can be machine traffic. If your CTR jumped the week you started emailing enterprise accounts, that's usually why, and it's not good news.
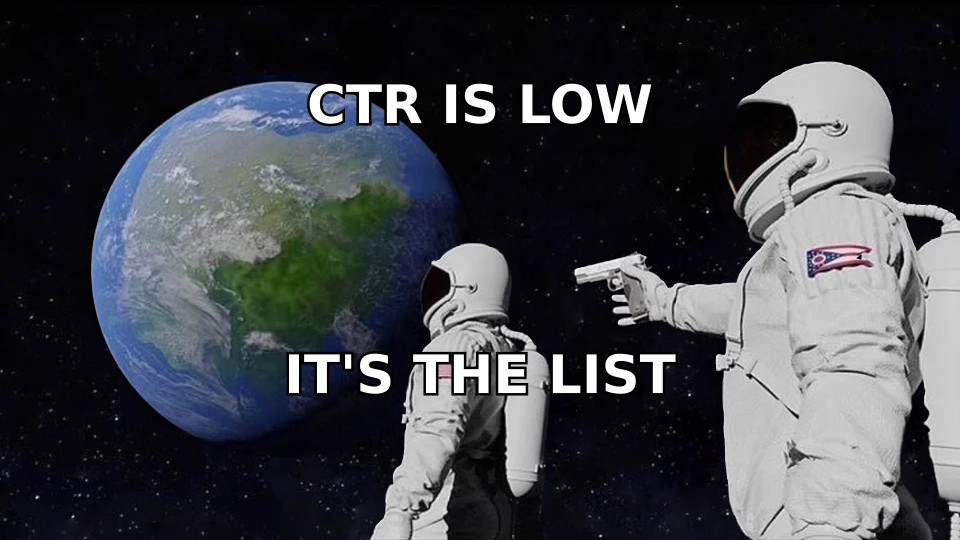
What are the email click through rate benchmarks by industry in 2026?#
Here's the consolidated picture. These are unique-click CTRs against delivered volume, medians rather than means, drawn from aggregated ESP reporting across marketing and outbound sends.
| Industry | Median CTR | Median CTOR | Typical open rate | Read this as |
|---|---|---|---|---|
| Government / public sector | 3.9% | 12.1% | 38% | High trust, captive audience |
| Education | 3.4% | 10.8% | 35% | Strong opt-in intent |
| Nonprofit | 3.1% | 9.6% | 33% | Mission-driven engagement |
| Healthcare | 2.8% | 8.9% | 32% | Inflated by security scanners |
| SaaS / software | 2.5% | 8.2% | 30% | Product-led sends skew high |
| Financial services | 2.4% | 7.9% | 29% | Heavy gateway click noise |
| Professional services | 2.3% | 7.6% | 28% | Baseline B2B reference point |
| Manufacturing / industrial | 2.2% | 7.4% | 27% | Small lists, high relevance |
| Logistics / transport | 2.0% | 6.8% | 26% | Transactional lifts the average |
| Retail / e-commerce | 1.9% | 5.4% | 26% | High volume, low intent |
| Real estate | 1.7% | 5.1% | 25% | Long consideration cycles |
| Marketing / advertising | 1.4% | 4.6% | 24% | Most cynical audience alive |
A B2B professional-services sender at 2.3% is exactly average. Not good. Not bad. Average.
Now the part the benchmark tables leave out: cold outbound is a different sport entirely. A cold sequence to a purchased or scraped list runs 0.8–1.6% CTR on a good day, and that's with clean data. Comparing a cold prospecting sequence to a retail newsletter benchmark is like comparing a cold call to a customer support callback. Same phone, different physics.
| Send type | Realistic CTR range | Realistic reply rate | Primary lever |
|---|---|---|---|
| Opt-in newsletter | 2.0–4.0% | n/a | Segmentation |
| Product / lifecycle email | 3.0–6.0% | n/a | Trigger timing |
| Warm nurture (MQL) | 2.5–4.5% | 1–3% | Offer relevance |
| Cold outbound sequence | 0.8–1.6% | 2–6% | List accuracy |
| Re-engagement / win-back | 0.9–2.2% | n/a | Ruthless list pruning |
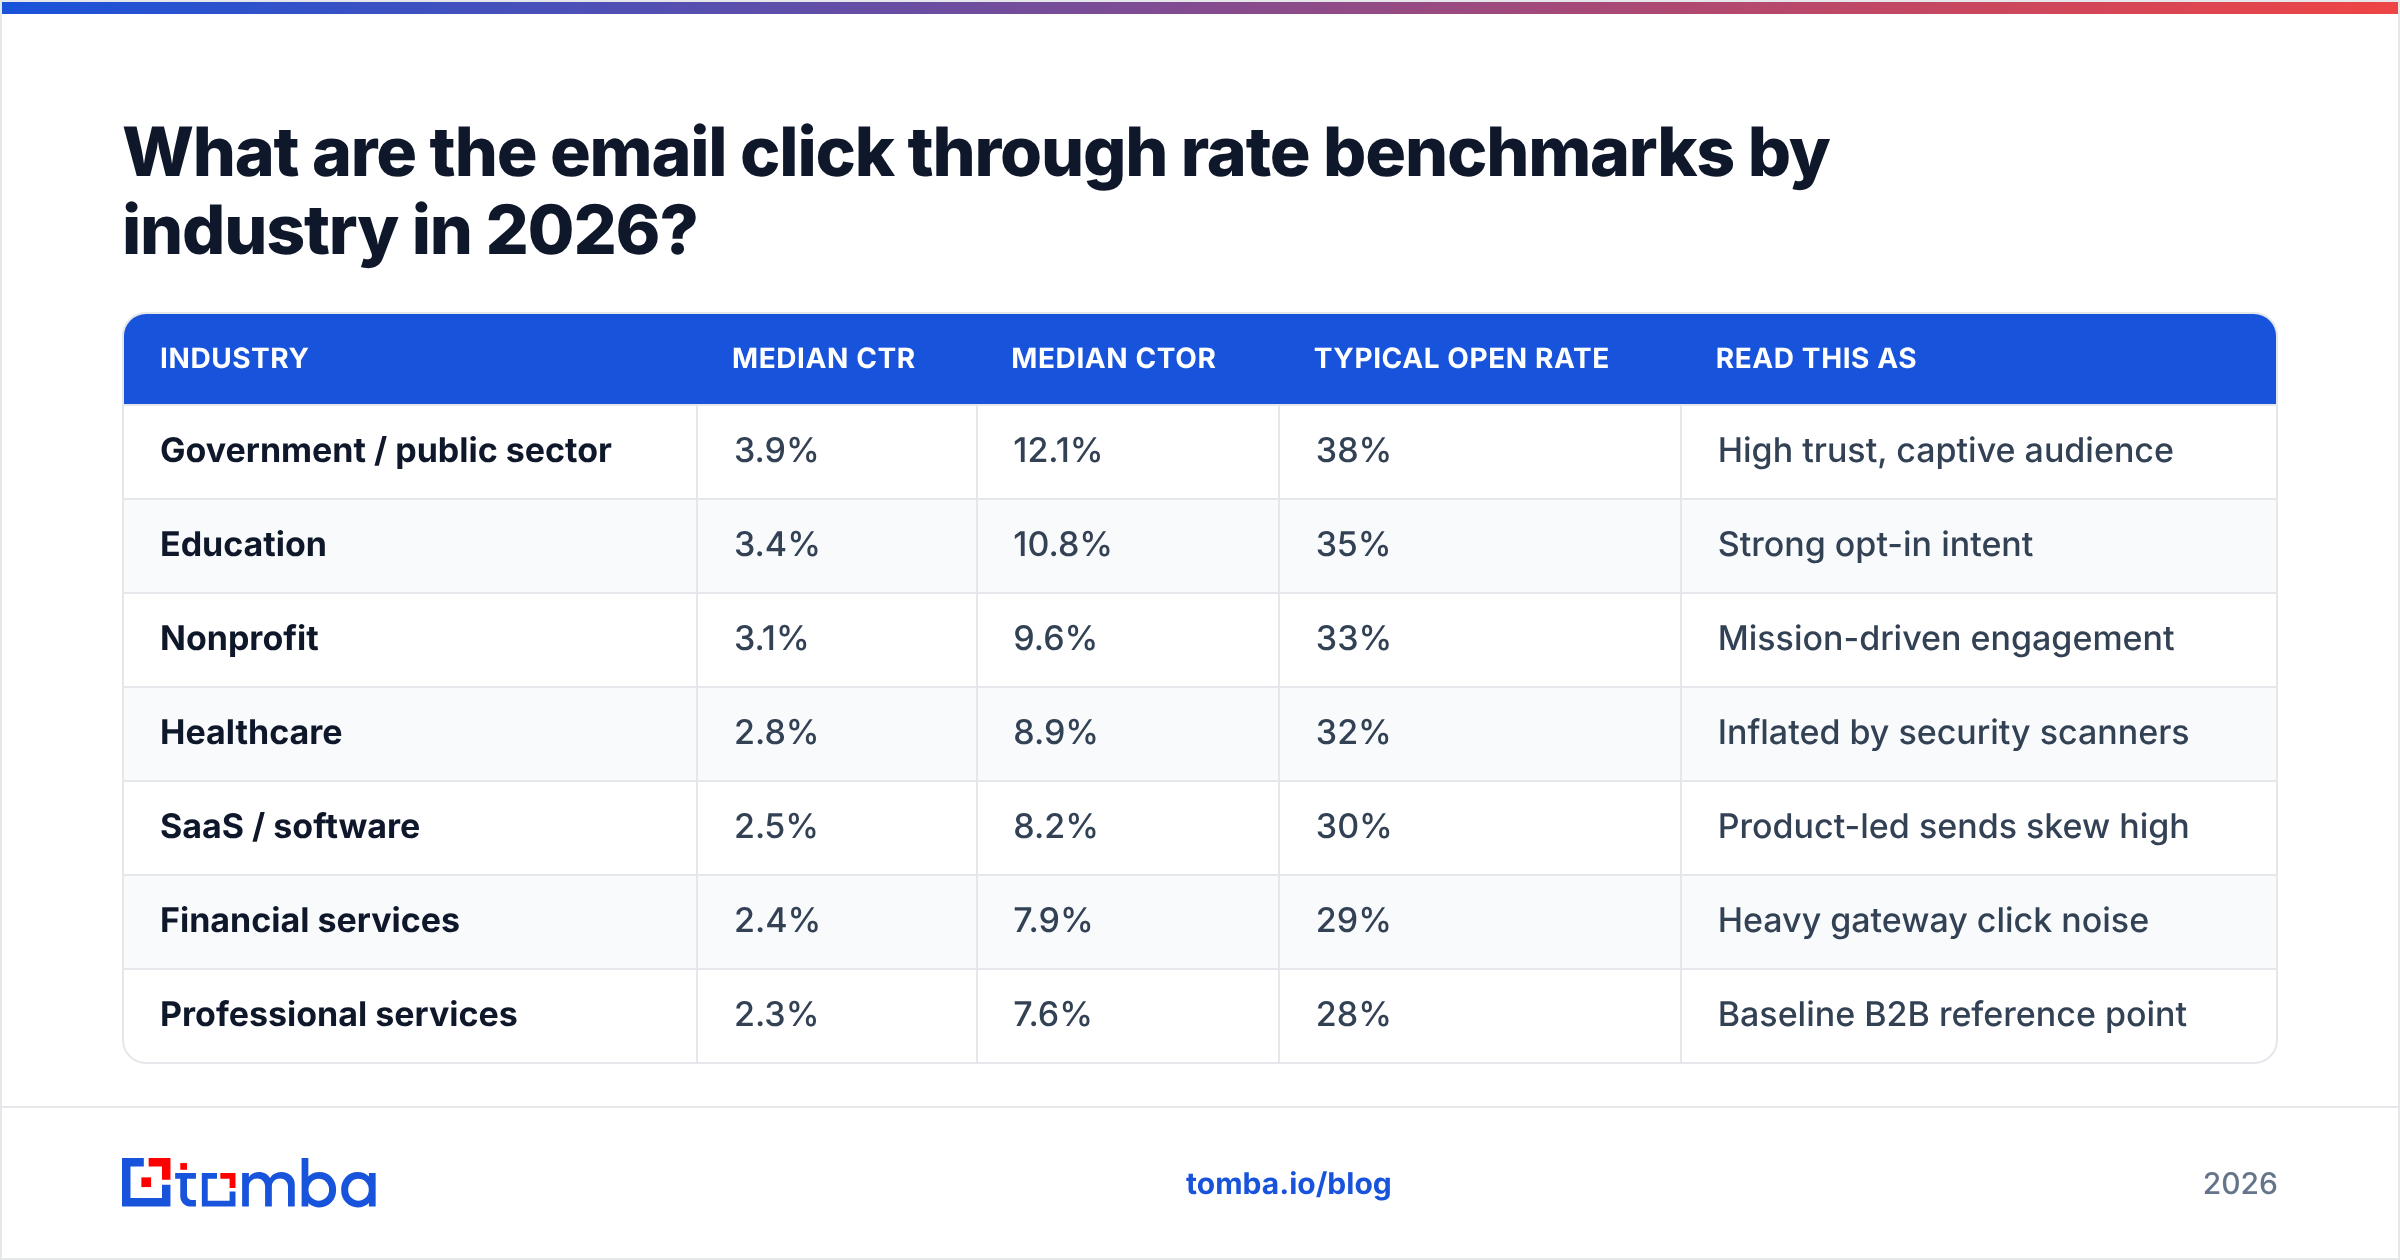
Why do CTR benchmarks vary so much between sources?#
Because everyone measures a different thing and calls it the same word.
- Sample composition. An ESP whose customer base skews e-commerce publishes lower B2B numbers than one that skews SaaS. Mailchimp's email marketing benchmarks and HubSpot's State of Marketing data both report honestly and still disagree, because they're sampling different populations.
- Mean vs. median. Averages get wrecked by a handful of 20%-CTR transactional campaigns. Medians are more honest and less flattering. If a source doesn't say which it used, assume mean and discount it.
- Bot filtering. Some platforms strip known scanner user-agents. Some don't. That's a 0.5–1.2 percentage-point swing on enterprise-heavy lists.
- Date range. Data collected before Apple's Mail Privacy Protection rollout is not comparable to data collected after. Any table citing 2020 open rates alongside 2026 click rates is stitching together two incompatible worlds.
- Industry taxonomy. "Technology" might mean a dev-tools startup or a 40,000-seat enterprise IT reseller. Those two send wildly different email.
Practical rule: pick one source, track your own trendline against it, and stop shopping for the benchmark that makes you look best.
Is CTR or click-to-open rate the better metric?#
Use CTOR to judge the email. Use CTR to judge the program.
Click-to-open rate divides unique clicks by unique opens — it isolates whether the people who actually saw your message found something worth clicking. That's a content and offer question.
CTR folds in deliverability, list quality, subject-line performance, and send timing. It's the health metric for everything upstream of the message body.
Here's how to read the combination:
- Low CTR, high CTOR — Your email is good; not enough people are seeing it. Look at deliverability, subject lines, and inbox placement. Start with your SPF record and authentication setup.
- High CTR, low CTOR — Suspicious. Usually means scanner traffic inflating clicks, or an unusually large open denominator from image-blocking clients. Audit before you celebrate.
- Low CTR, low CTOR — The offer is wrong or the audience is wrong. Copy tweaks won't fix a targeting problem.
- High CTR, high CTOR — Either you nailed it or your list is very small and very warm. Both are fine. Don't extrapolate to a 50,000-contact send.
One caveat that matters in 2026: open rates are partly fictional now. Apple's Mail Privacy Protection pre-loads tracking pixels for a large share of consumer mail, which manufactures opens that never happened. That makes CTOR unreliable in consumer-heavy lists and reasonably reliable in B2B lists where Outlook and Google Workspace dominate. Know which one you're sending to.
How does list quality change your click-through rate?#
More than copy does. By a wide margin.
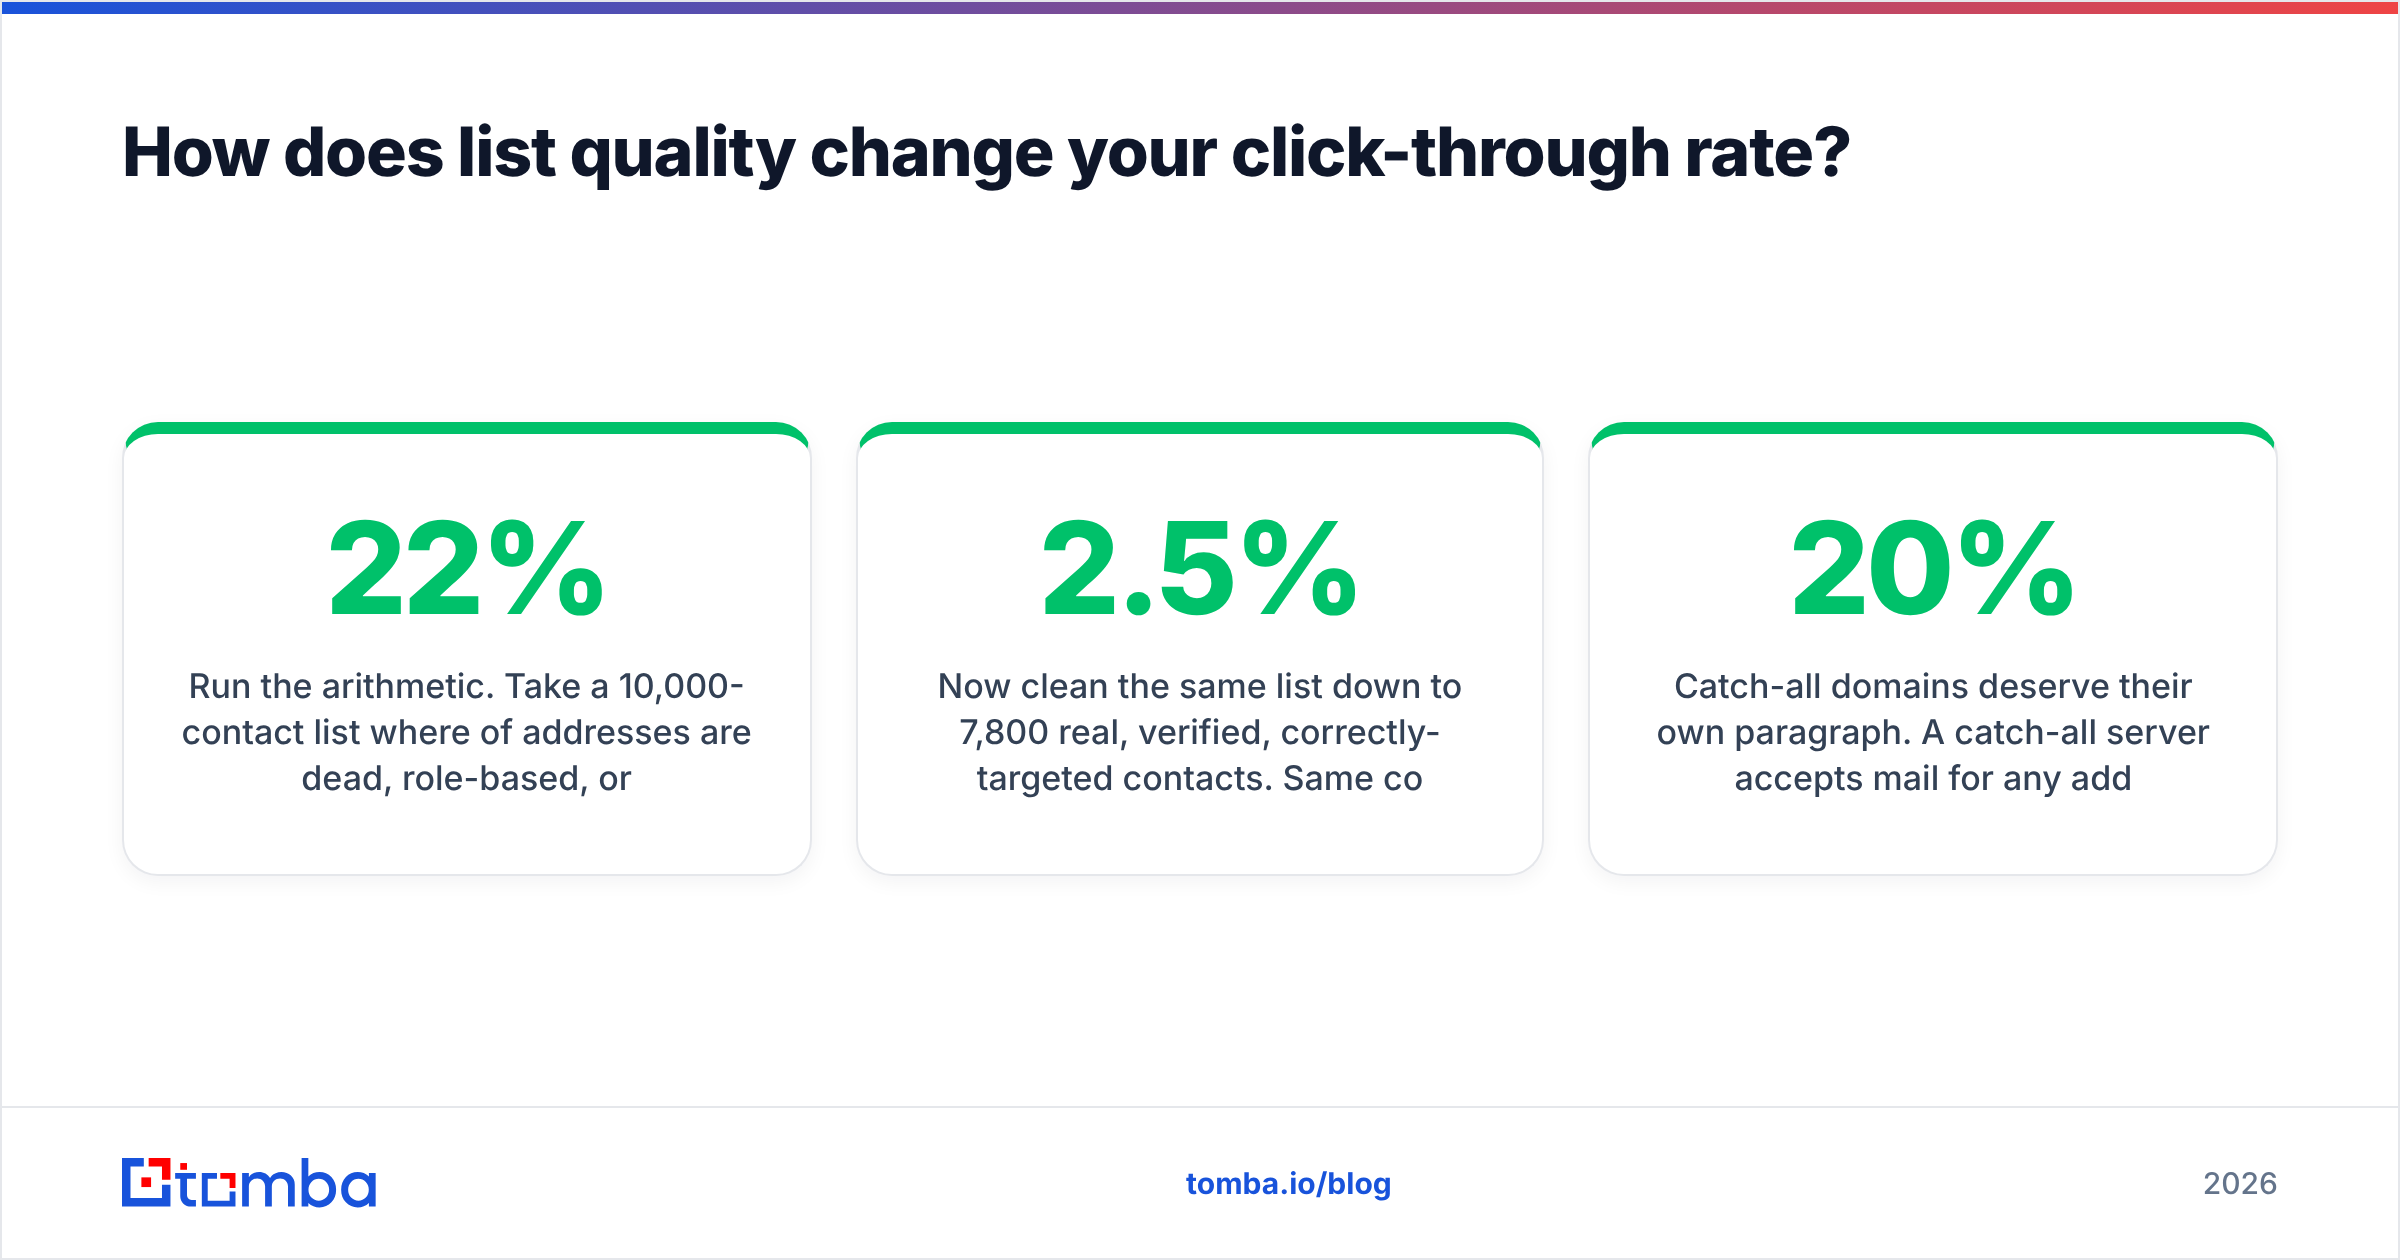
Run the arithmetic. Take a 10,000-contact list where 22% of addresses are dead, role-based, or wrong-person. You send, 7,800 deliver, and 180 people click. Reported CTR: 2.3%. Respectable.
Now clean the same list down to 7,800 real, verified, correctly-targeted contacts. Same copy, same offer. You send 7,800, roughly 7,700 deliver, and the same 180 humans click — plus maybe 15 more who previously landed in spam because your bounce rate was suppressing your sender reputation. Reported CTR: 2.5%, and rising over subsequent sends as reputation recovers.
The compounding effect is the real story. High bounce rates degrade domain reputation, which degrades inbox placement, which degrades CTR on every future send. A dirty list doesn't just underperform once — it taxes everything you send for months afterward.
This is where most teams misallocate effort. They A/B test button colors on a list where a fifth of the addresses are guesses. Verify the list first with an email verifier, then optimize the message.
Catch-all domains deserve their own paragraph. A catch-all server accepts mail for any address at the domain, so standard verification returns "unknown" rather than valid or invalid. Roughly 15–20% of B2B domains are catch-all, and they're overrepresented among mid-market and enterprise accounts — exactly the ones you want. Skipping them means dropping your best prospects; mailing them blind means bouncing into a reputation hole. A dedicated catch-all verifier resolves most of that gray zone before you send.
What actually moves click-through rate, ranked by effort?#
Ordered by return per hour spent, based on what consistently shows up in program audits:
- Verify and prune the list. Biggest single lever. Removes bounces, kills spam-trap risk, lifts the delivered denominator's quality. One afternoon of work.
- Segment by role, not by company. A CFO and a demand-gen manager at the same account need entirely different emails. Segmenting by seniority and function beats segmenting by firmographics in almost every test.
- Cut to one call to action. Multi-CTA emails split attention and dilute unique clicks. If everything's a link, nothing is a link.
- Fix send timing per segment. Tuesday 10am is folklore, not data. Pull your own click timestamps and send when your list clicks.
- Rewrite the CTA as an outcome, not an action. "See the 2026 benchmark data" outperforms "Click here" and "Learn more" reliably.
- Then, and only then, test subject lines. Subject lines move opens. Opens are a leaky, partially-fabricated metric in 2026. This is the last place to spend your optimization budget, not the first.
Notice that four of the six items happen before anyone writes a word of copy. That ordering is the entire point.
What CTR should you actually target?#
Set targets from your own history, not from a table.
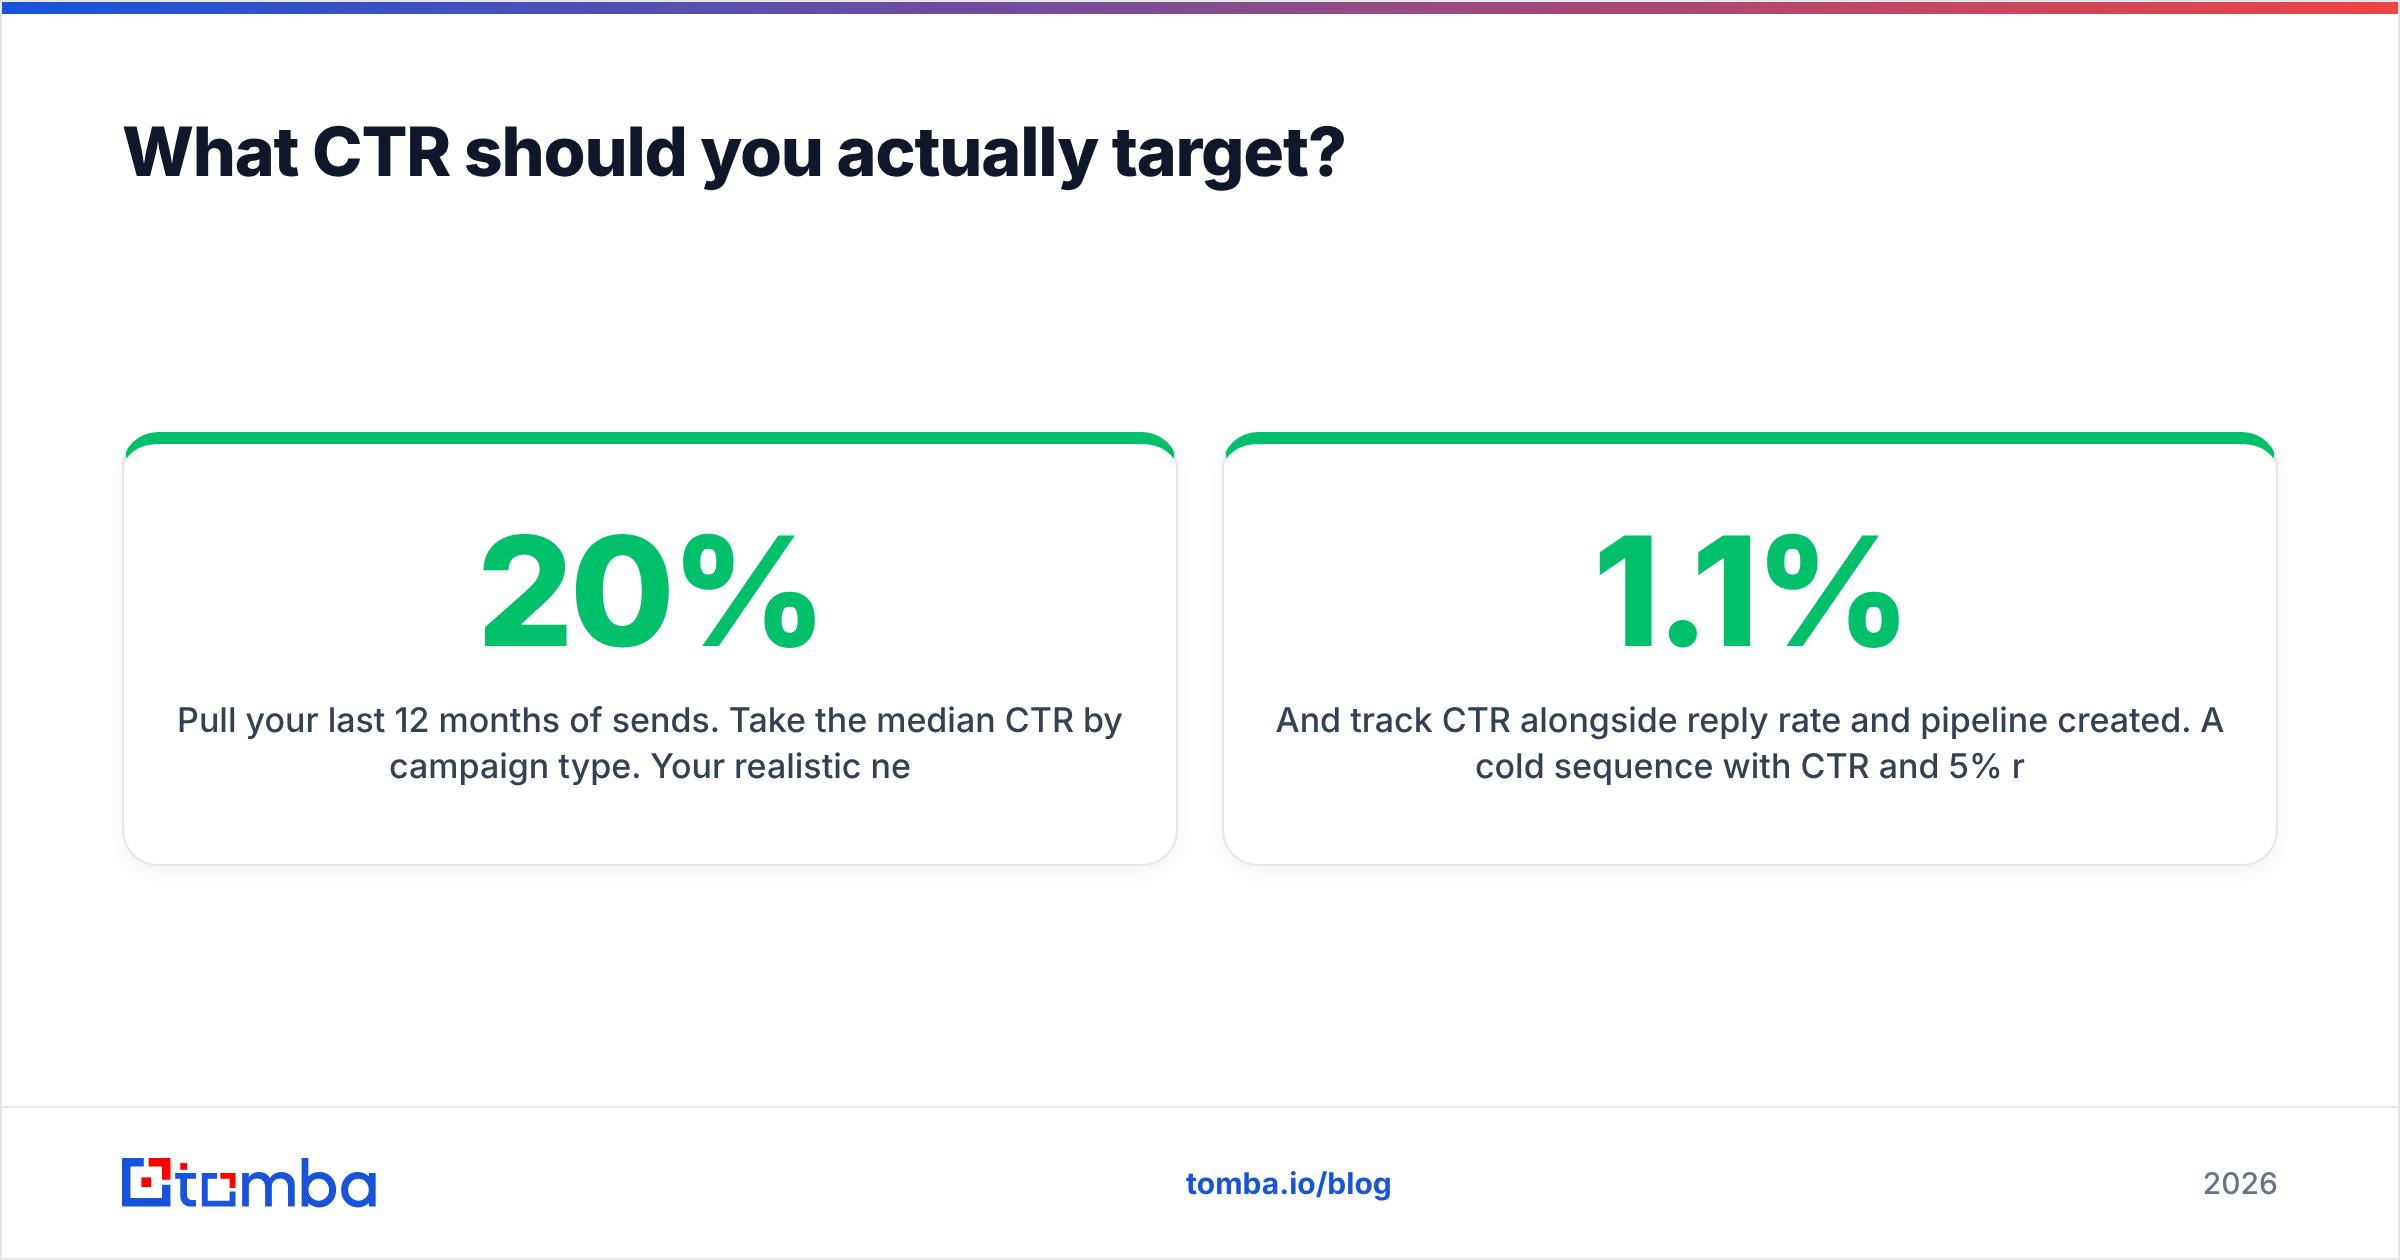
Pull your last 12 months of sends. Take the median CTR by campaign type. Your realistic near-term target is that median plus 15–20%. Anything more aggressive, and you'll hit the number by shrinking your list to your 500 warmest contacts — which improves the metric and shrinks the pipeline. That trade is almost never worth making, and it's the single most common way CTR targets get gamed.
Then sanity-check against the industry table above:
- More than 1 point below your vertical's median — Structural problem. Data quality, deliverability, or targeting. Not a copy problem.
- Within ±0.5 points — Normal. Focus on segmentation and offer testing for incremental gains.
- More than 1 point above — Verify it's real. Check for scanner traffic, check whether you're only mailing a small warm segment, check that you're using unique clicks.
And track CTR alongside reply rate and pipeline created. A cold sequence with 1.1% CTR and 5% reply rate is outperforming one with 2.4% CTR and 1% reply rate. Clicks that don't become conversations are a rounding error on a spreadsheet. For a deeper cut on the denominator side, see how response rate behaves differently from click rate in outbound.
What tooling do you need to hold benchmarks steady?#
Three layers, and most teams only build one.
Layer 1 — Accurate contact data at the point of entry. Wrong or stale addresses poison every downstream metric. Finding a verified address at the moment you add a prospect is dramatically cheaper than cleaning it out six months later. Tools that combine discovery with verification in one step — Tomba, BookYourData, and similar providers — remove a whole category of downstream cleanup work.
Layer 2 — Ongoing hygiene. B2B contact data decays roughly 22–30% per year through job changes alone. A list verified in January is measurably worse by July. Quarterly re-verification via bulk verify keeps the decay curve flat instead of compounding.
Layer 3 — Authentication and reputation monitoring. SPF, DKIM, and DMARC are table stakes now that Google and Yahoo enforce bulk-sender requirements. Check your email deliverability fundamentals before assuming a CTR dip is a creative problem. Independent review data on G2 is a reasonable starting point for evaluating monitoring tools.
Skip layer 1 and you spend forever fixing layer 2. That's the most expensive sequencing mistake in the stack.
Where should you start this week?#
Do this in order:
- Pull your last 6 months of campaigns. Calculate median unique CTR against delivered, by campaign type.
- Compare to the industry table. Note the gap.
- Export your active list and run it through verification. Record the invalid percentage.
- If invalid exceeds 8%, stop optimizing copy. Your problem is upstream.
- Re-baseline CTR 30 days after cleaning. That's your real starting number.
Most teams find their "CTR problem" was a data problem wearing a costume.
Start with the data layer. If your click-through rate is stuck below your vertical's median, the fastest diagnostic is checking how many of your contacts are real. Tomba's Email Finder sources verified professional addresses by domain, name, or company, with verification built into the lookup rather than bolted on afterward — so contacts enter your list clean instead of getting cleaned later. The free tier gives you 25 searches a month to test against your own list, and Tomba pricing starts at $49/mo for Starter if you need volume. Verify a sample of 100 contacts, see what percentage comes back invalid, and you'll know within an hour whether your CTR problem is a copy problem or a data problem.
Related guides#
Ready to find emails that actually work?
Join 150,000+ professionals who stopped guessing and started sending. Free credits on signup — no credit card required.
Get the Tomba newsletter
Practical outbound tactics and product updates — once every two weeks.
About the author