Email Conversion Rate Formula: How to Calculate It in 2026
Most teams calculate email conversion rate wrong by picking the wrong denominator. Here is the exact formula, four denominator variants, benchmark ranges, and the diagnostic math that tells you which stage of your funnel is actually broken.
TL;DR
- The email conversion rate formula is
(conversions ÷ denominator) × 100— and 90% of the argument is about which denominator you use. Use delivered, not sent, unless you're reporting to finance. - A "conversion" must be one defined action tied to revenue: a booked meeting, a demo request, a signed deal. If your team counts replies as conversions, you're measuring interest, not outcomes.
- Cold outbound conversion (meeting booked ÷ delivered) typically lands between 0.5% and 3%. Marketing newsletters to opted-in lists run 1%–5% click-to-conversion.
- Two campaigns with identical conversion rates can have completely different problems. Break the rate into stage ratios — deliverability, open, click, reply, meeting — and the broken stage becomes obvious.
- Bad data inflates your denominator and deflates your rate. A 12% bounce list makes a healthy campaign look like a failing one.
What is the email conversion rate formula?#
Here it is, stripped down:
Email conversion rate = (Number of conversions ÷ Number of emails delivered) × 100Send 1,000 emails, 940 get delivered, 19 people book a meeting. That's (19 ÷ 940) × 100 = 2.02%.
Think of it like a restaurant. Emails sent is how many flyers you printed. Emails delivered is how many landed in an actual mailbox. Conversions is how many people walked in and ordered. Measuring against flyers printed tells you about your printer. Measuring against mailboxes reached tells you about your offer.
The formula is trivial. The two inputs are not, and that's where teams lose the plot.
Which denominator should you use — sent, delivered, opened, or clicked?#
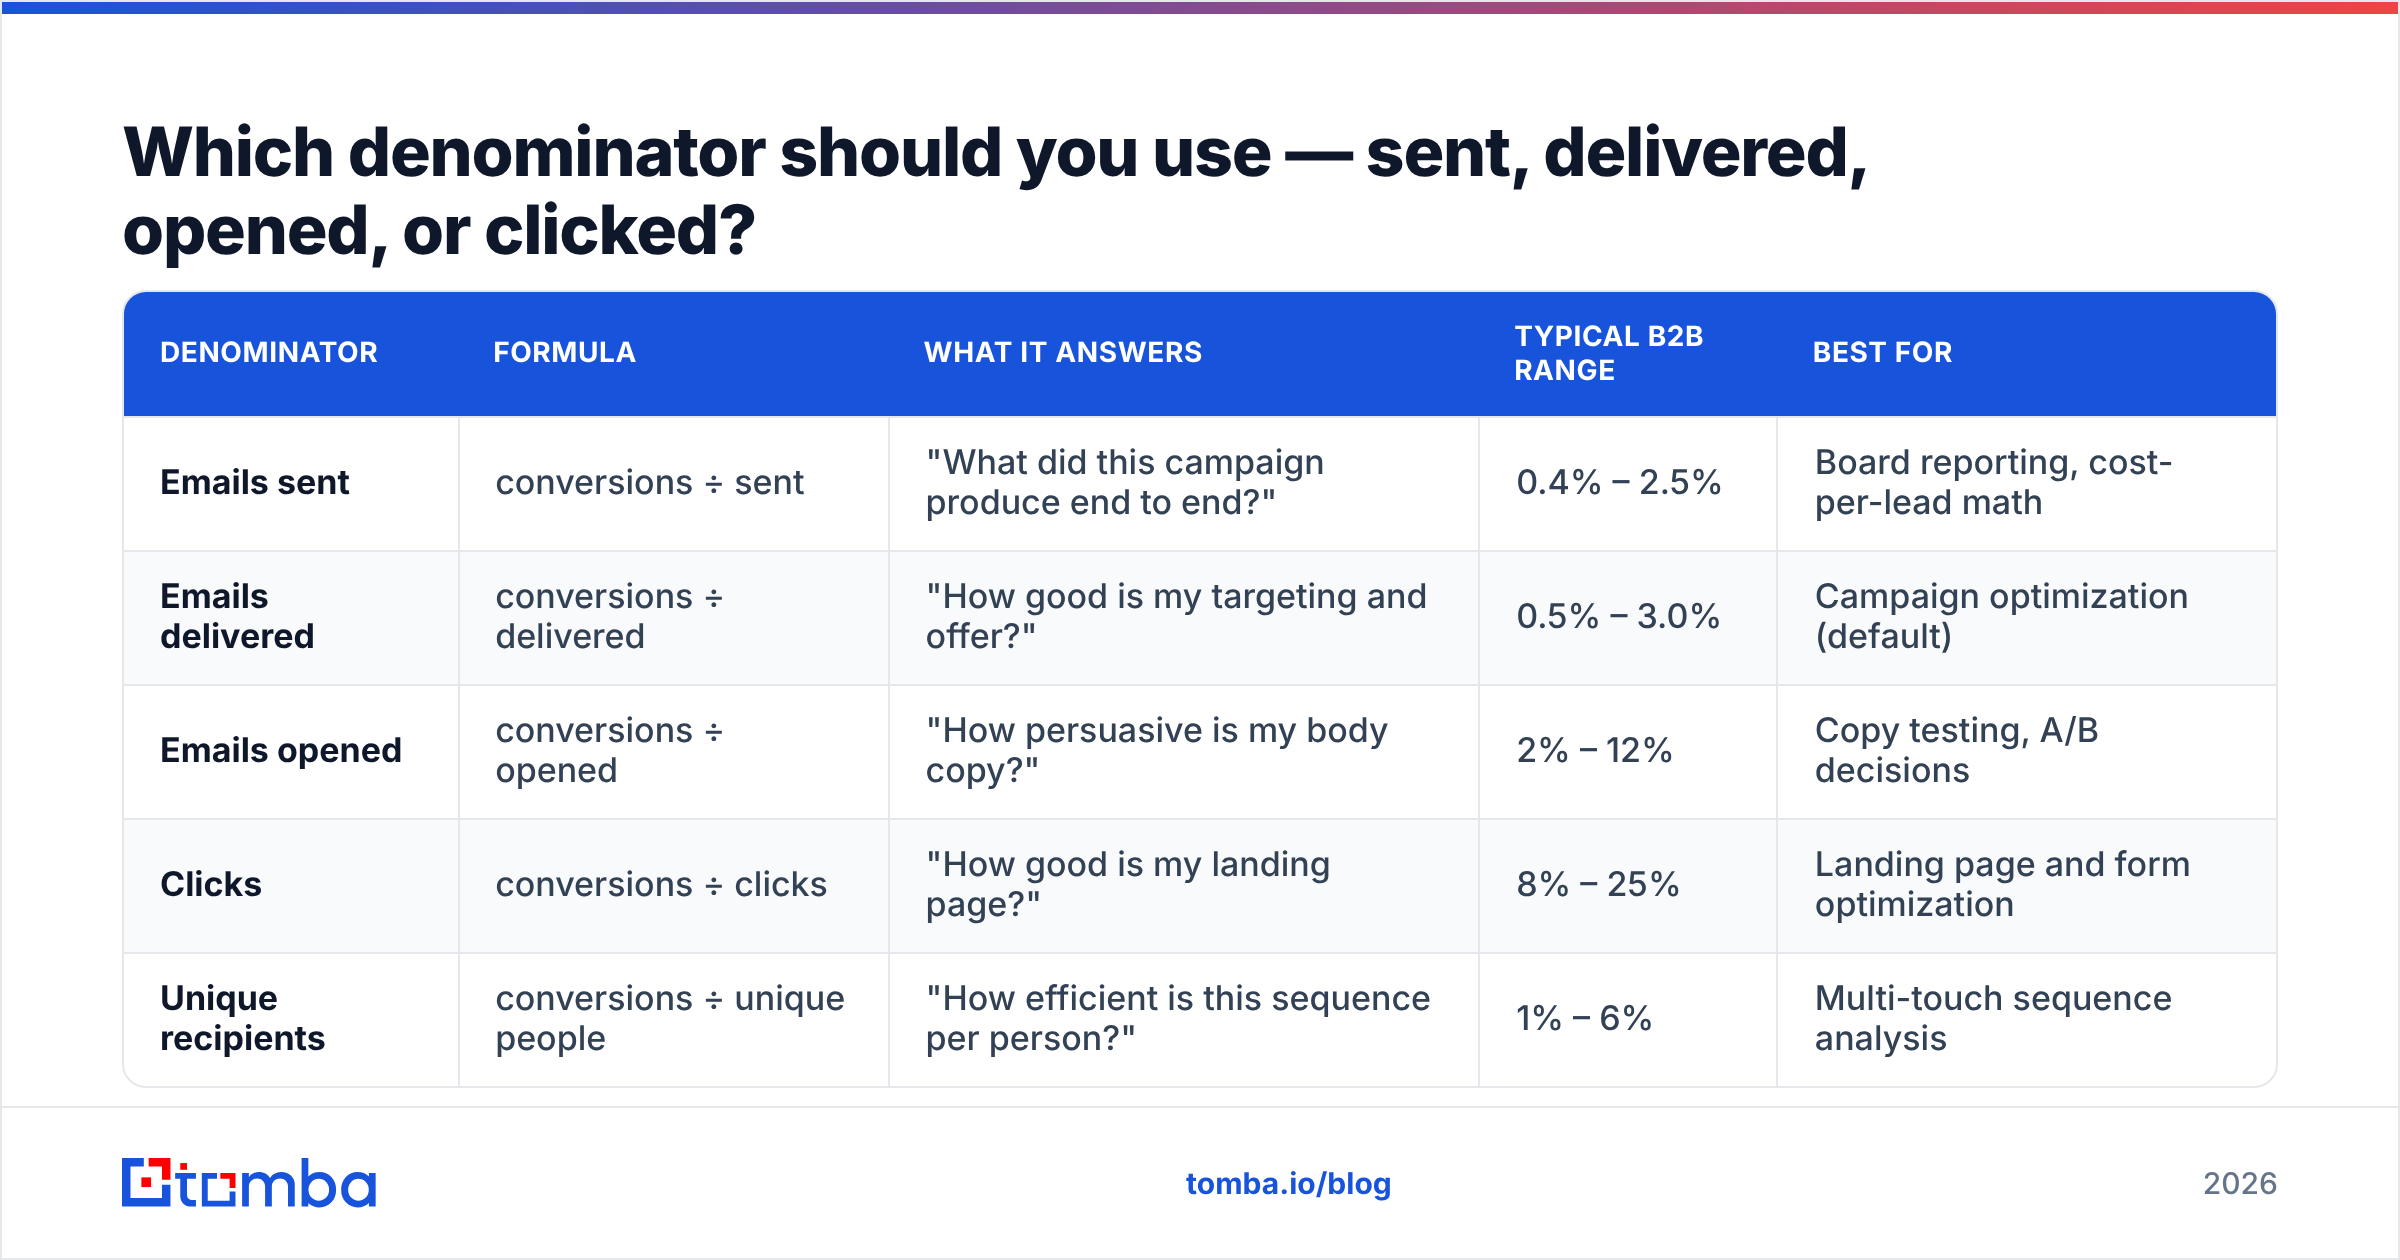
This single choice can swing your reported number by 40% or more. There is no universally "correct" denominator; there's a correct denominator for the question you're asking.
| Denominator | Formula | What it answers | Typical B2B range | Best for |
|---|---|---|---|---|
| Emails sent | conversions ÷ sent | "What did this campaign produce end to end?" | 0.4% – 2.5% | Board reporting, cost-per-lead math |
| Emails delivered | conversions ÷ delivered | "How good is my targeting and offer?" | 0.5% – 3.0% | Campaign optimization (default) |
| Emails opened | conversions ÷ opened | "How persuasive is my body copy?" | 2% – 12% | Copy testing, A/B decisions |
| Clicks | conversions ÷ clicks | "How good is my landing page?" | 8% – 25% | Landing page and form optimization |
| Unique recipients | conversions ÷ unique people | "How efficient is this sequence per person?" | 1% – 6% | Multi-touch sequence analysis |
Three rules that keep this honest:
- Pick one denominator and lock it for the quarter. Switching from sent to delivered mid-quarter creates a fake 6% "improvement" that no one earned.
- Never mix denominators inside one report. Comparing Campaign A at conversions-per-open against Campaign B at conversions-per-sent is comparing two different things and calling it a ranking.
- Treat open-based rates as directional only. Apple Mail Privacy Protection has been auto-opening images since 2021, which inflates opens on any list with meaningful Apple Mail share. Google's bulk sender requirements pushed further changes to how mailbox providers handle tracking. Your opens are a noisy signal now — build your primary KPI on something else.
What actually counts as a "conversion"?#
A conversion is the single action that moves money. Not a proxy for it.
For a B2B outbound team, that's almost always a booked meeting that shows up — a "sales accepted lead," not a "sales qualified lead," and definitely not a positive reply. For product-led SaaS it's a signup that activates. For an ecommerce newsletter it's a completed purchase.
The failure mode is counting soft signals:
- "Interested, send me info" replies — these convert to meetings at roughly 30–50%. Counting them doubles your reported rate and hides the fact that your follow-up is weak.
- Link clicks — a click is a click. Someone checking whether you're a real company clicks the same link as a buyer.
- Form fills without qualification — students, competitors, and job seekers all fill forms.
- Any conversion you can't trace to a CRM record — if it doesn't exist in Salesforce or HubSpot, it isn't in the numerator.
Define the conversion event once, write it down, and make everyone use that definition. A team that reports 4% by counting replies and a team that reports 1.4% by counting held meetings may be performing identically.
How do you diagnose a bad conversion rate?#
A single conversion rate is a symptom, not a diagnosis. Decompose it.
Your end-to-end rate is the product of every stage:
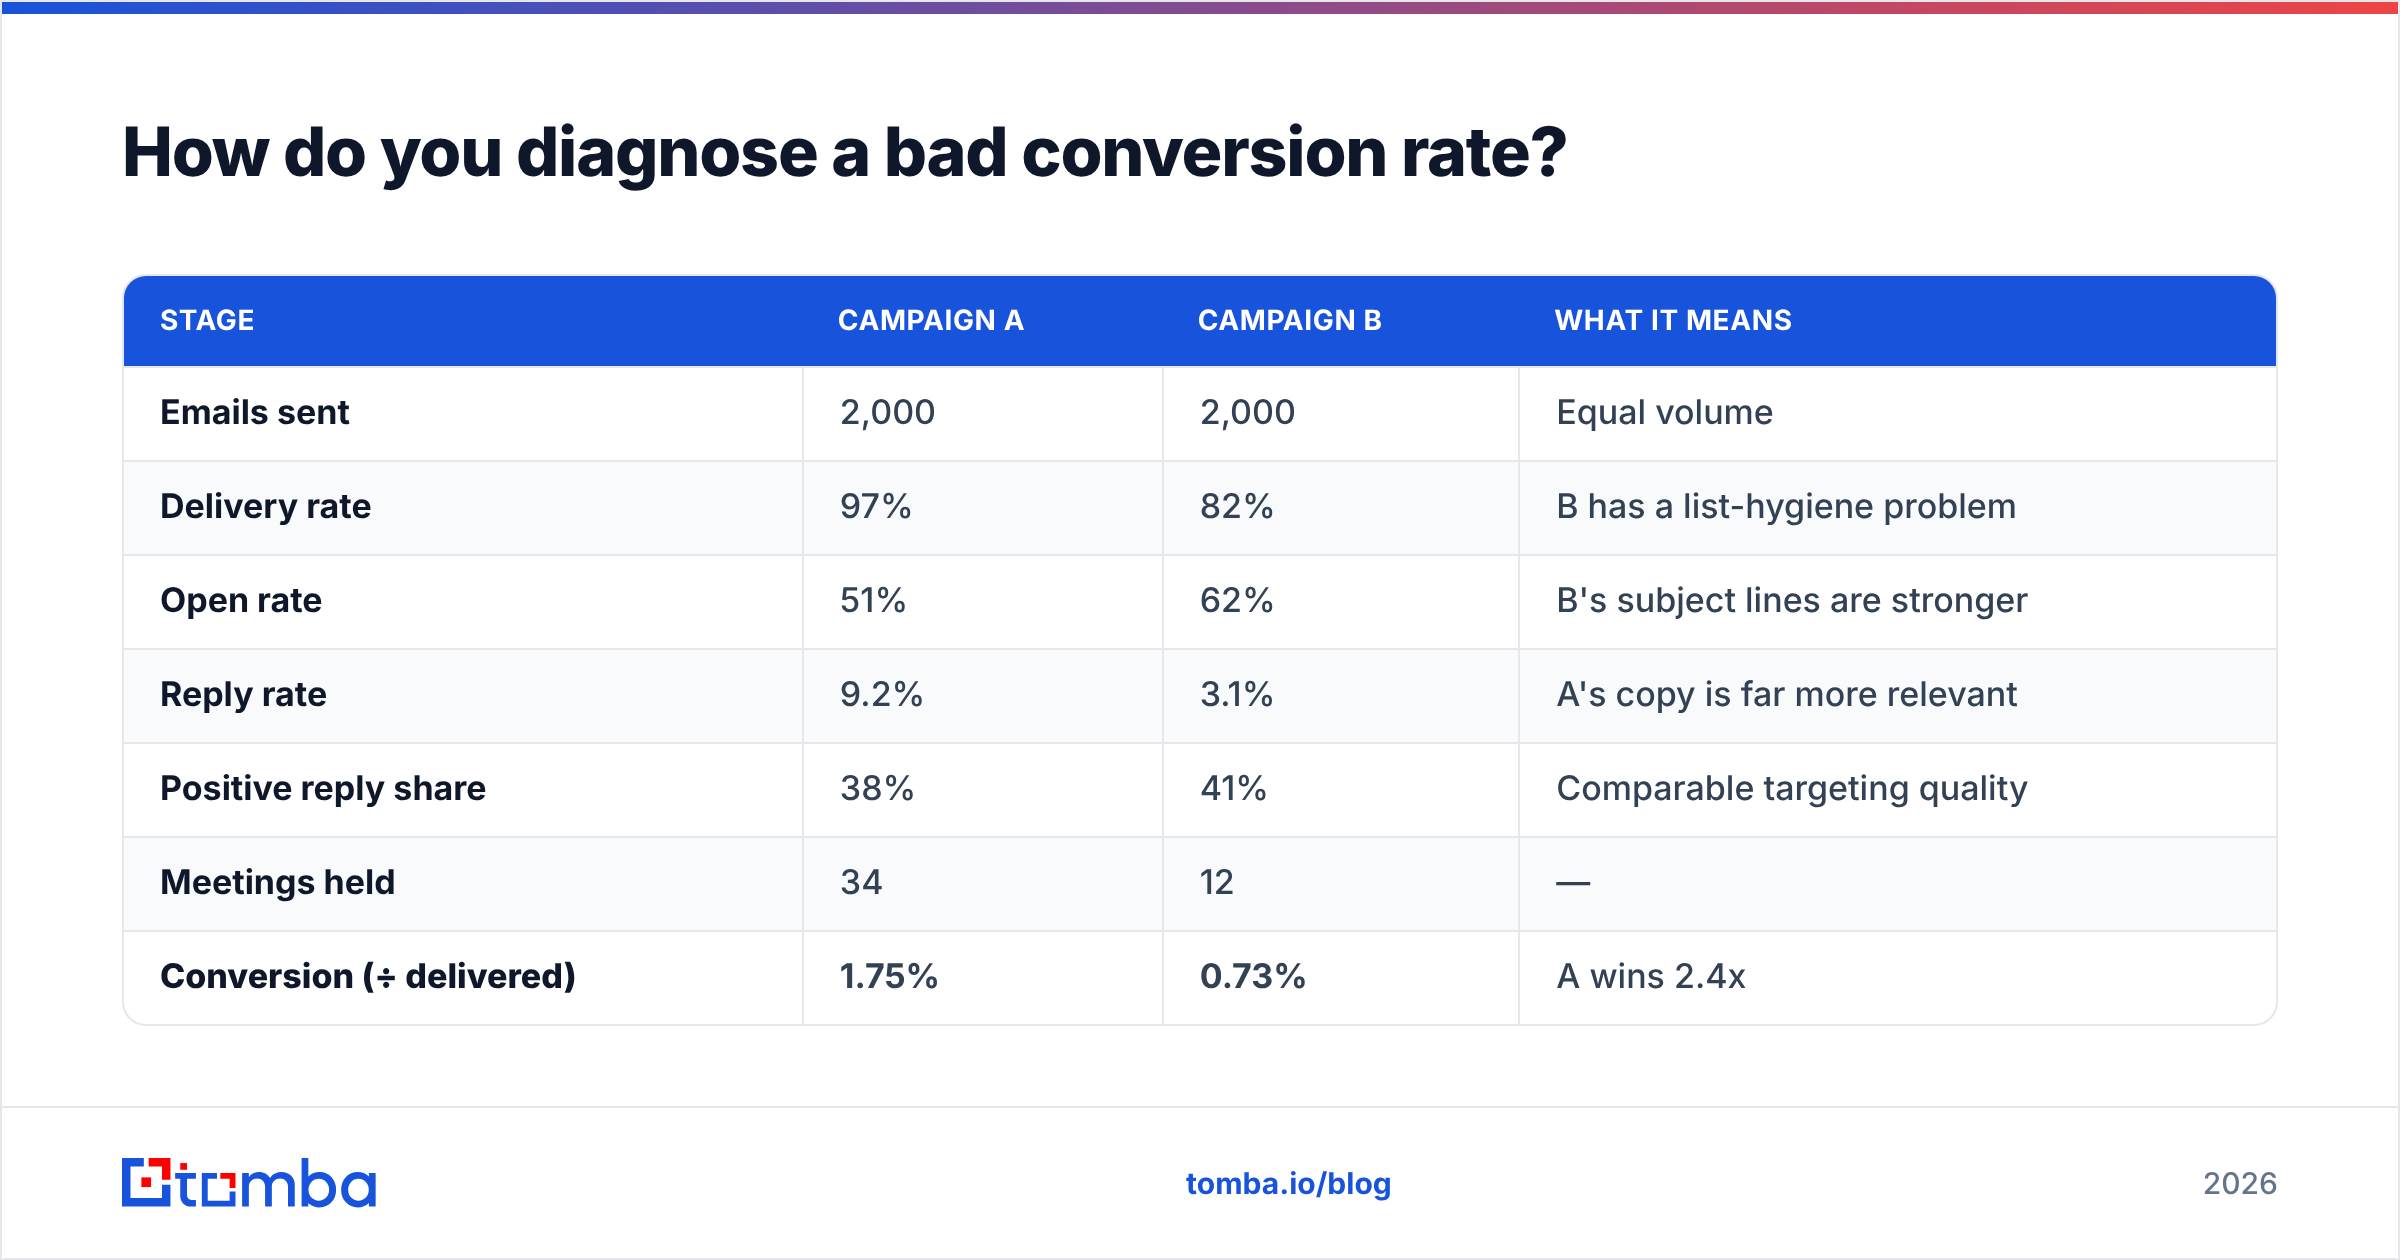
Conversion rate = Delivery% × Open% × Reply% × Meeting-from-reply%Run two campaigns through it:
| Stage | Campaign A | Campaign B | What it means |
|---|---|---|---|
| Emails sent | 2,000 | 2,000 | Equal volume |
| Delivery rate | 97% | 82% | B has a list-hygiene problem |
| Open rate | 51% | 62% | B's subject lines are stronger |
| Reply rate | 9.2% | 3.1% | A's copy is far more relevant |
| Positive reply share | 38% | 41% | Comparable targeting quality |
| Meetings held | 34 | 12 | — |
| Conversion (÷ delivered) | 1.75% | 0.73% | A wins 2.4x |
Campaign B doesn't have a "conversion problem." It has two separate problems: 18% of its emails never arrived, and the copy that did arrive got read but ignored. Fixing subject lines — the thing most teams reach for first — would make B worse, because its opens are already fine.
Here's the diagnostic ladder, in the order you should walk it:
- Delivery below 95%? Stop everything else. You're burning domain reputation and your denominator is lying to you. Clean the list with an email verifier before your next send.
- Delivery fine but opens below 30%? Subject line and sender-name problem, or you're landing in Promotions. Check your SPF record and authentication stack first — placement issues masquerade as copy issues.
- Opens fine but replies below 3%? Relevance problem. Your body copy is generic or the offer doesn't match the segment.
- Replies fine but meetings low? Qualification or follow-up problem. You're generating curiosity you can't convert. Look at reply-to-meeting handoff speed — responses handled within an hour convert dramatically better than same-day.
- Meetings fine but revenue flat? ICP problem. You're booking meetings with people who can't buy.
What are realistic email conversion rate benchmarks in 2026?#
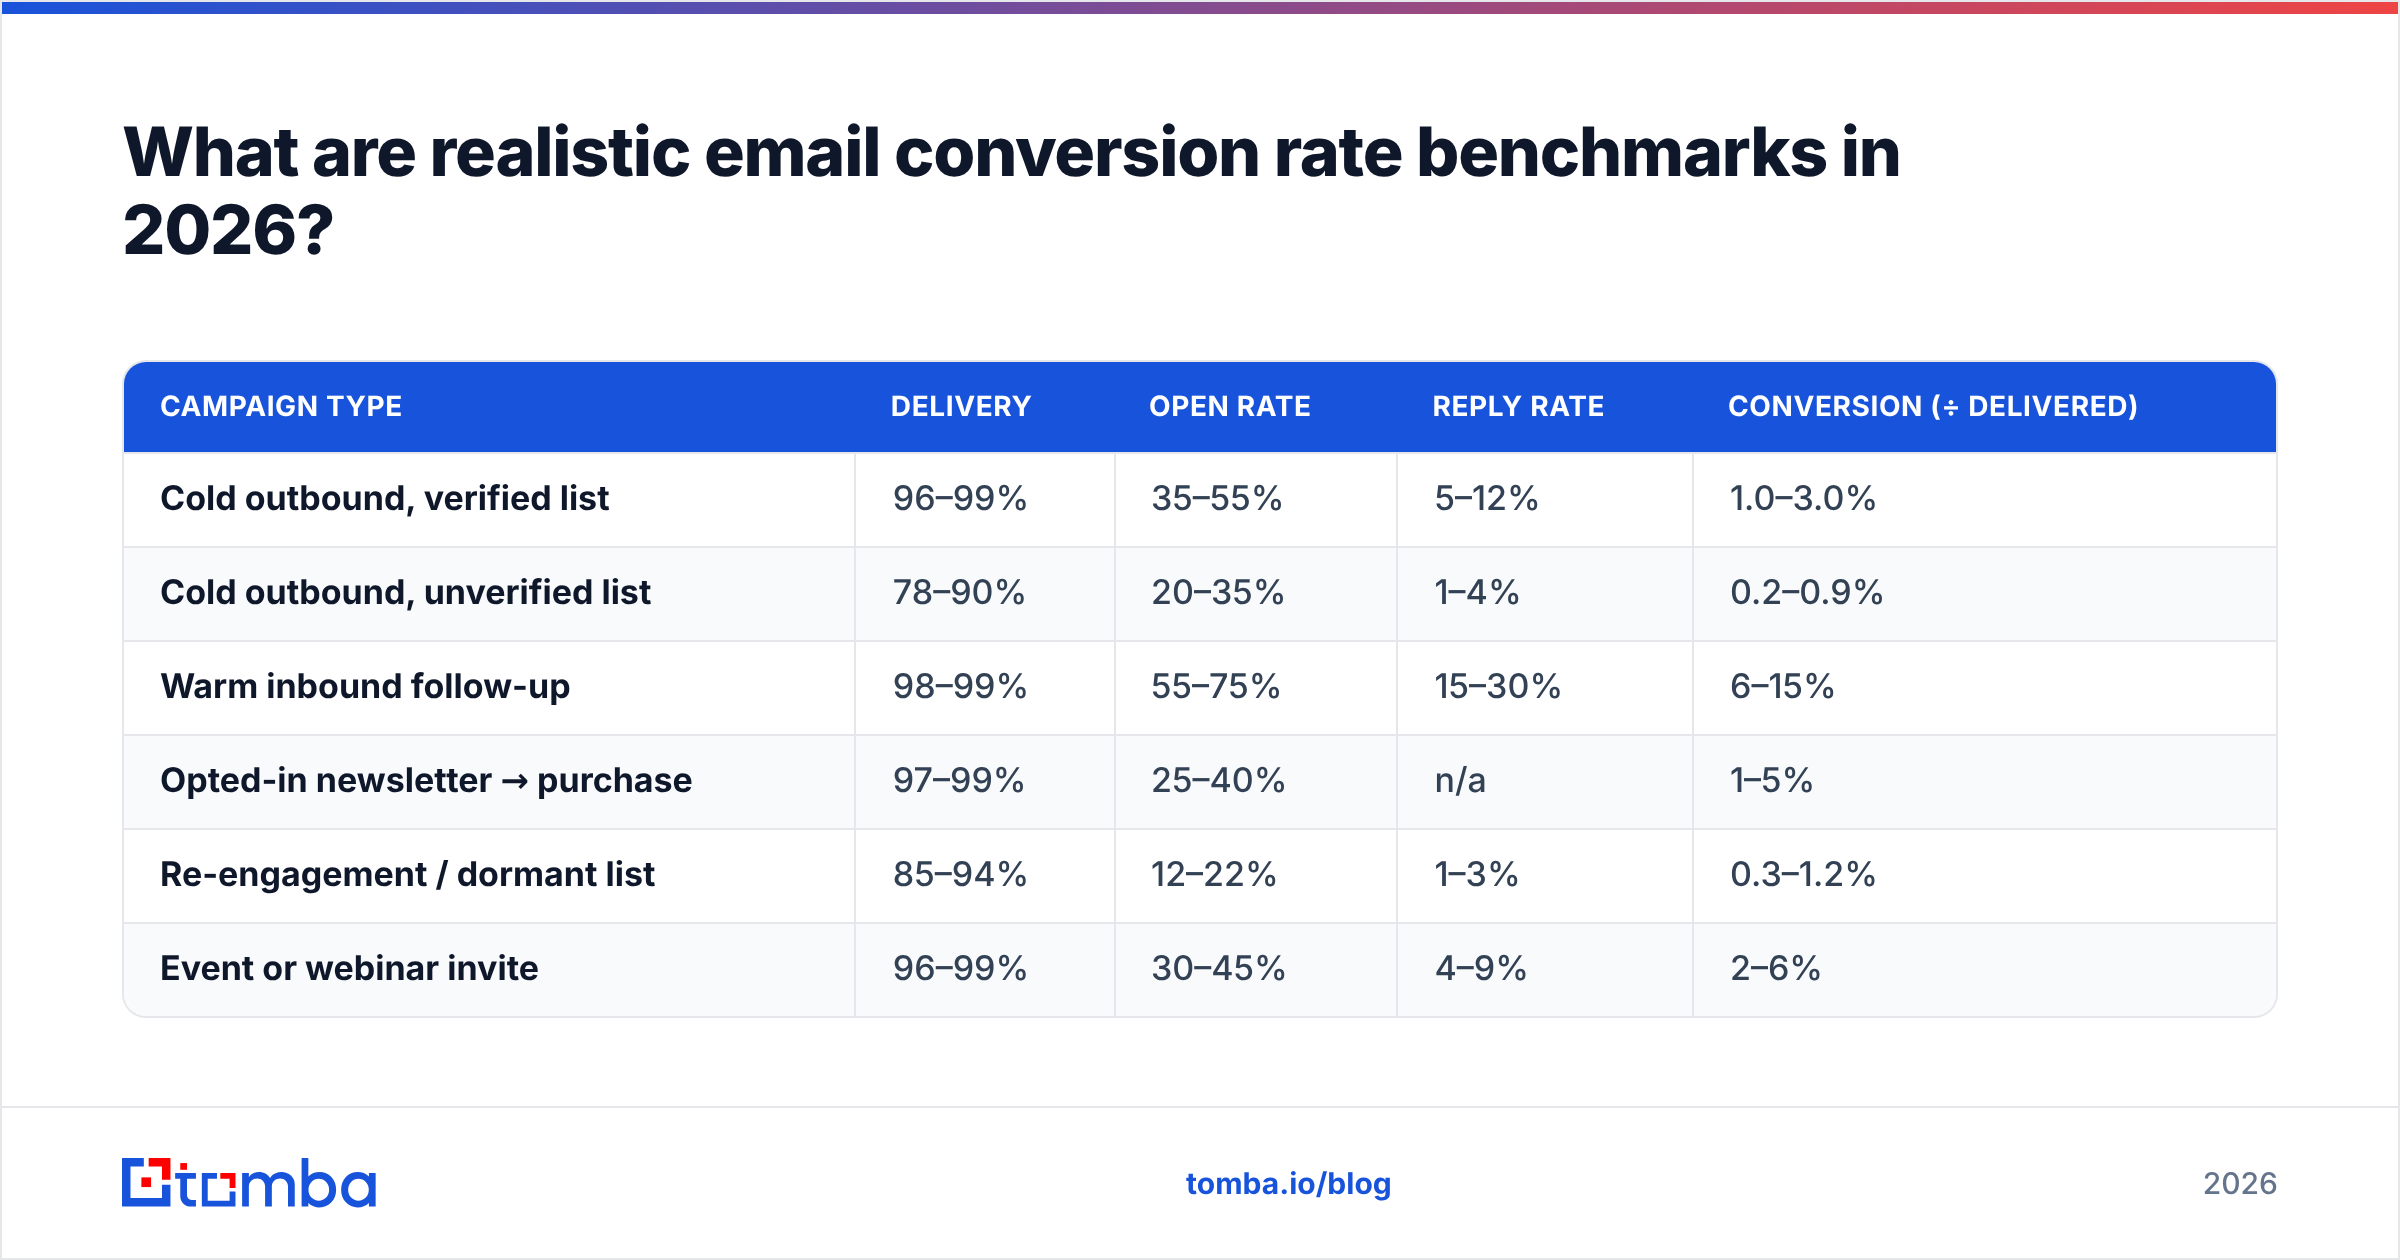
Benchmarks are context-dependent, but here's a defensible reference set based on aggregated B2B outbound and lifecycle data. Use them as sanity checks, not targets.
| Campaign type | Delivery | Open rate | Reply rate | Conversion (÷ delivered) |
|---|---|---|---|---|
| Cold outbound, verified list | 96–99% | 35–55% | 5–12% | 1.0–3.0% |
| Cold outbound, unverified list | 78–90% | 20–35% | 1–4% | 0.2–0.9% |
| Warm inbound follow-up | 98–99% | 55–75% | 15–30% | 6–15% |
| Opted-in newsletter → purchase | 97–99% | 25–40% | n/a | 1–5% |
| Re-engagement / dormant list | 85–94% | 12–22% | 1–3% | 0.3–1.2% |
| Event or webinar invite | 96–99% | 30–45% | 4–9% | 2–6% |
Two things stand out. First, the gap between a verified and an unverified list isn't marginal — it's roughly 3x on end-to-end conversion, because bad data hurts you twice (fewer deliveries and worse sender reputation dragging down inbox placement for the good addresses).
Second, warm follow-up converts 5–10x better than cold. If your conversion rate is under pressure, reallocating volume from cold to warm channels usually beats optimizing cold copy for the fourth time.
For broader industry context, HubSpot's marketing benchmark research and vendor comparison data on G2 are reasonable cross-references — though note that most published benchmarks blend B2C into the average, which pulls B2B numbers in odd directions.
How does data quality change the math?#
More than anything else you can control in a week.
Walk through the arithmetic on a 5,000-contact list with a 15% invalid rate:
- 5,000 sent, 750 hard bounce → 4,250 delivered (85% delivery)
- Bounce rate above 5% triggers throttling at major providers; assume 20% of the remaining volume lands in spam → ~3,400 in the inbox
- At a 2% inbox-to-meeting rate: 68 meetings
Now the same list, verified before sending:
- 4,250 valid contacts sent, ~85 bounce → 4,165 delivered (98% delivery)
- Clean reputation, ~5% spam placement → ~3,957 in the inbox
- Same 2% inbox-to-meeting rate: 79 meetings
Same copy. Same offer. Same headcount. 16% more meetings, plus a domain that isn't quietly degrading for every future campaign. And the reported conversion rate goes from 1.36% to 1.90% — a 40% swing driven entirely by data hygiene, with zero change to messaging.
This is why the denominator argument matters so much. If you report against sent, list cleaning looks like it barely moved the needle. If you report against delivered, you see the real picture: your offer was always fine, your list wasn't.
The practical fixes, in order of return:
- Verify before every send, not once a quarter. B2B data decays at roughly 2–3% per month from job changes alone.
- Segment catch-all domains separately. Catch-all servers accept everything, so a "valid" result means less. Run them through a catch-all verifier and track them as their own cohort.
- Suppress anyone who hasn't engaged in 180 days. Dead weight in the denominator suppresses your rate and your reputation simultaneously.
- Source emails from a verified-at-lookup provider rather than scraping and hoping. Tools like Tomba's email finder or peers such as BookYourData return addresses that have already been validated, which shifts the cleanup burden upstream where it's cheaper.
How do you build a conversion rate report that people trust?#
Four columns, one definition, no negotiation:
| Column | Definition | Source of truth |
|---|---|---|
| Delivered | Sent minus hard bounces and blocks | Sending platform (ESP/sequencer) |
| Conversions | Meetings held, CRM-stamped | CRM, not the sequencer |
| Conversion rate | (Conversions ÷ Delivered) × 100 | Calculated, never self-reported |
| Cohort | Send week + segment + sender domain | Tagged at send time |
Three practices separate a report people act on from one they ignore:
- Cohort by send week, not report week. A meeting booked in week 3 from a week-1 email belongs to week 1. Otherwise your Monday numbers always look worse than Friday's for no real reason.
- Report a confidence interval, not a point estimate. At 500 sends and 8 conversions, your 1.6% has a margin of error near ±1.1%. Declaring a winner at n=500 is coin-flipping with extra steps.
- Attribute conversions to the touch that created the reply, not the last email in the sequence. Otherwise every sequence "proves" that email 5 is the magic one, and you'll keep bolting on email 6.
For teams running this at scale, pull the numerator from your CRM via API and the denominator from your sending platform, then join them on a campaign ID. Manual spreadsheet joins are where conversion reporting quietly goes to die — someone renames a campaign, the join breaks, and nobody notices for a month.
What's the fastest way to improve the number?#
Ranked by how much movement you get per hour invested:
- Fix the list. Highest return, lowest effort, works on the denominator and the numerator. Nothing else on this list competes.
- Tighten the segment. A 200-contact list where every contact matches a real trigger beats a 2,000-contact list matching a title filter. Smaller denominator, higher numerator, both directions helping you.
- Rewrite the offer, not the subject line. Opens are usually not your constraint. If people open and don't reply, the ask is wrong.
- Speed up reply handling. Meetings-from-replies is the stage teams measure least and lose most in.
- Add a channel. Pair email with a call to the same contact. Sourcing B2B phone numbers alongside emails typically lifts sequence-level conversion meaningfully versus email alone.
- Then, and only then, A/B test copy. Copy tests need volume to reach significance. Doing them before the first five items is optimizing a leaky bucket's paint job.
Frequently asked questions#
Is conversion rate the same as reply rate? No. Reply rate measures interest; conversion rate measures outcomes. A campaign with a 12% reply rate and a 0.6% conversion rate is attracting the wrong people efficiently.
Should I include unsubscribes in the denominator? Yes, if they were delivered. They received the email and chose an action. Excluding them flatters your numbers.
What if a contact converts after 6 touches? Attribute the conversion to the campaign, with the denominator as unique recipients — not total sends. Otherwise a 6-email sequence looks 6x worse than a 1-email blast at identical performance.
How large does a sample need to be? For a 2% baseline rate, detecting a meaningful lift with confidence takes several thousand sends per variant. Under 1,000, you're reading noise.
Does this formula work for transactional email? The math does, but the benchmarks don't. Transactional email converts at 10–40x marketing email and should be tracked in its own report entirely.
Where to start#
Calculate today's number honestly: conversions from your CRM, divided by delivered from your sending platform, times 100. Write it down. Then run your active list through verification and recalculate next month against the same denominator. That single change usually moves the rate more than a quarter of copy testing.
If bad data is what's dragging your denominator, start at the source. Tomba's Email Finder returns verified professional addresses by domain, name, or company, so the list you send to is clean before it ever hits your sequencer — not cleaned up after the bounces roll in. The free tier includes 25 searches per month; paid plans start at $49/mo for Starter and $99/mo for Growth, with full Tomba pricing laid out per credit tier. Build the denominator right, and the conversion rate takes care of itself.
Related guides#
Ready to find emails that actually work?
Join 150,000+ professionals who stopped guessing and started sending. Free credits on signup — no credit card required.
Get the Tomba newsletter
Practical outbound tactics and product updates — once every two weeks.
About the author