Email Marketing Click Through Rate Benchmark 2026 by Industry
Most "average CTR" numbers you see are averaged across broken lists and inflated bot clicks. Here's what a realistic email marketing click through rate benchmark looks like in 2026 — by industry, by list type, and by what you can actually control.
TL;DR
- A realistic email marketing click through rate benchmark in 2026 sits between 1.8% and 3.2% for broadcast newsletters, 2.5% and 5% for segmented lifecycle emails, and 0.8% to 2% for cold B2B outreach.
- Open rates have been unreliable since Apple Mail Privacy Protection started pre-fetching images. CTR and click-to-open rate (CTOR) are now the two metrics worth reporting.
- Bot clicks from security scanners inflate CTR by 10–35% on B2B lists. If your CTR jumped without a campaign change, suspect link scanners, not genius copy.
- The single biggest lever on CTR is not copy — it's list quality. Unverified addresses, role accounts, and stale contacts drag the denominator down before anyone reads a word.
- Benchmark against your own trailing 12 campaigns first, industry averages second. Cross-industry averages hide 5x variance inside the same vertical.
What is a good email marketing click through rate benchmark in 2026?#
Short answer: 2.6% is the honest cross-industry midpoint for permission-based marketing email, and anything above 4% on a list larger than 10,000 contacts is genuinely strong.
That number is lower than the "5–8% CTR" figures floating around older blog posts, and the gap is not because email got worse. It's because measurement got more honest. Three things changed:
- Image pre-fetching broke opens. Apple's Mail Privacy Protection, plus similar proxying at Gmail and Outlook, means open events fire whether or not a human looked at the message. Any metric derived from opens inherited that noise.
- Link scanners started clicking. Enterprise security gateways detonate every URL in an inbound email to check for malware. Those clicks land in your ESP as real clicks with real timestamps.
- List sizes grew faster than list quality. Bigger lists dilute the denominator. A 50,000-contact list assembled over four years without re-verification will underperform a 6,000-contact list cleaned quarterly, every single time.
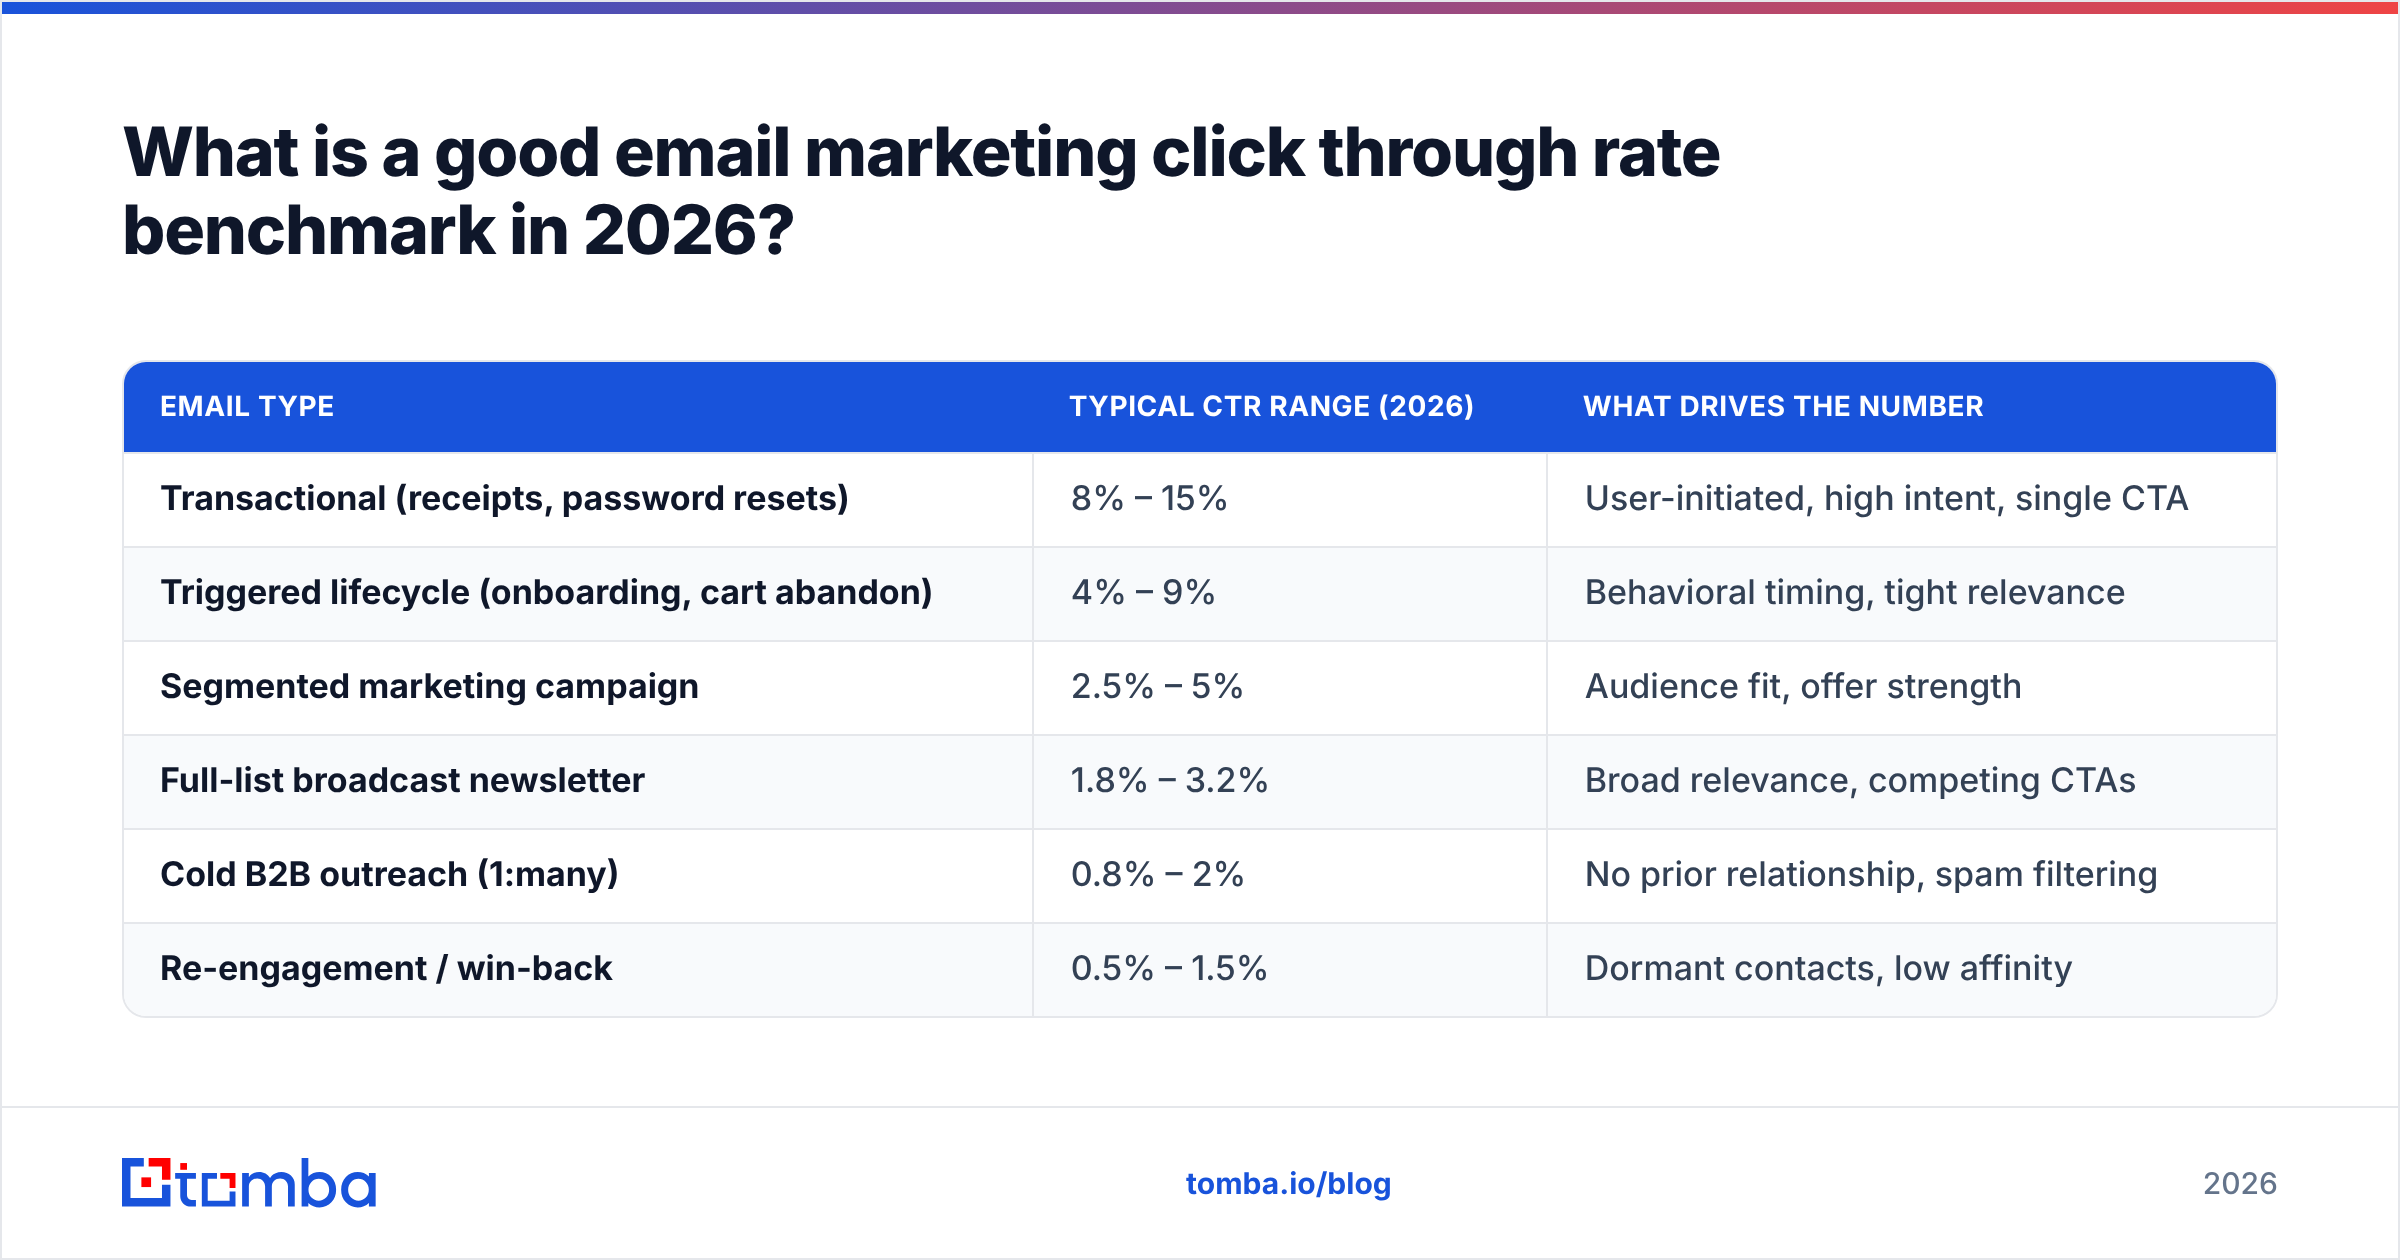
So when you compare your campaign against a published benchmark, first make sure you're comparing the same thing. Most vendor benchmark reports mix transactional email (which clicks at 8–15% because people asked for it) with promotional broadcasts. That mixing is where the inflated averages come from.
| Email type | Typical CTR range (2026) | What drives the number |
|---|---|---|
| Transactional (receipts, password resets) | 8% – 15% | User-initiated, high intent, single CTA |
| Triggered lifecycle (onboarding, cart abandon) | 4% – 9% | Behavioral timing, tight relevance |
| Segmented marketing campaign | 2.5% – 5% | Audience fit, offer strength |
| Full-list broadcast newsletter | 1.8% – 3.2% | Broad relevance, competing CTAs |
| Cold B2B outreach (1:many) | 0.8% – 2% | No prior relationship, spam filtering |
| Re-engagement / win-back | 0.5% – 1.5% | Dormant contacts, low affinity |
Use that table as your starting frame. If you're running a weekly newsletter and hitting 2.9%, you're fine — chasing an 8% figure borrowed from a transactional benchmark is a way to waste a quarter.
How do you actually calculate click through rate?#
There are two formulas in circulation and they produce wildly different numbers, which is a large part of why benchmark comparisons go sideways.
CTR (click-through rate) = unique clicks ÷ delivered emails × 100
CTOR (click-to-open rate) = unique clicks ÷ unique opens × 100
CTR measures the whole funnel: did the email get delivered, did the subject line earn attention, did the body earn a click. CTOR isolates the content: given that someone opened, did the message convince them. Wikipedia's entry on click-through rate covers the general definition, but email adds a wrinkle — the "opens" denominator in CTOR is now polluted by privacy proxies, which means CTOR has quietly become the less trustworthy of the two.
That's a reversal from 2021 advice. If your CTOR dropped from 14% to 9% over the last few years while CTR held steady, nothing broke. Your open count got inflated by machine opens, which pushed the denominator up.
One more distinction that trips people up: unique clicks versus total clicks. If one person clicks three links in your newsletter, that's 1 unique click and 3 total clicks. Total-click CTR can exceed 100% on a small enthusiastic list, which is meaningless. Always report unique.
Sorry — that image should render as:
What are email click through rate benchmarks by industry?#
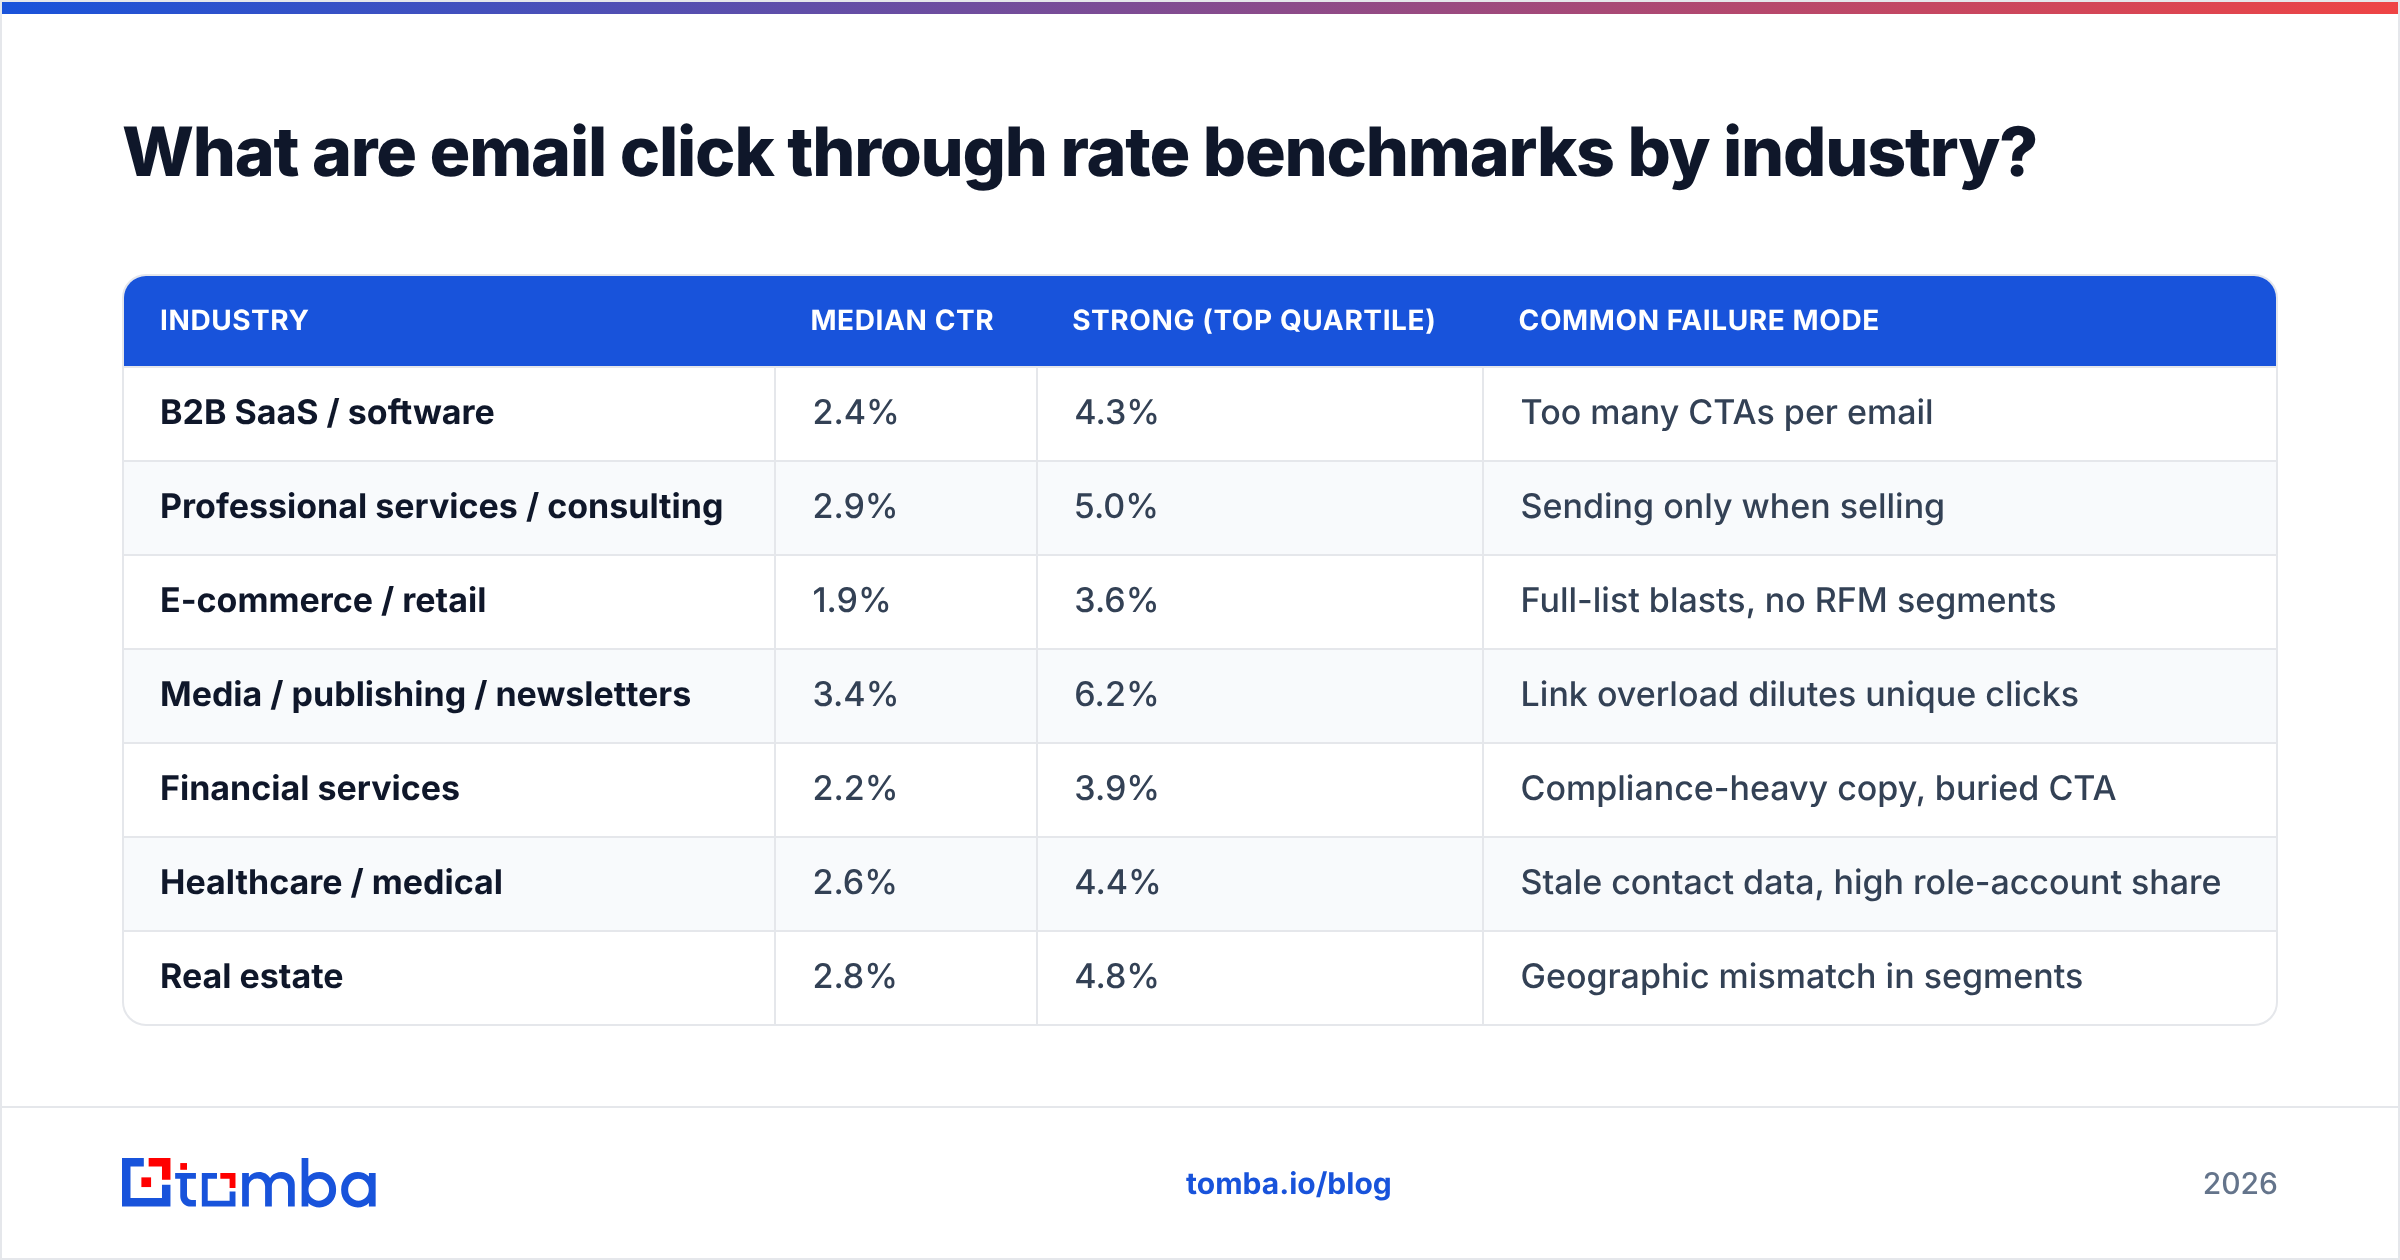
Industry averages are useful as sanity checks and dangerous as targets. The spread inside a vertical is usually wider than the spread between verticals. Two SaaS companies with identical audiences can sit at 1.4% and 5.1% purely on list hygiene and segmentation discipline.
With that caveat, here's where the 2026 ranges cluster for permission-based marketing email:
| Industry | Median CTR | Strong (top quartile) | Common failure mode |
|---|---|---|---|
| B2B SaaS / software | 2.4% | 4.3% | Too many CTAs per email |
| Professional services / consulting | 2.9% | 5.0% | Sending only when selling |
| E-commerce / retail | 1.9% | 3.6% | Full-list blasts, no RFM segments |
| Media / publishing / newsletters | 3.4% | 6.2% | Link overload dilutes unique clicks |
| Financial services | 2.2% | 3.9% | Compliance-heavy copy, buried CTA |
| Healthcare / medical | 2.6% | 4.4% | Stale contact data, high role-account share |
| Real estate | 2.8% | 4.8% | Geographic mismatch in segments |
| Nonprofit / advocacy | 3.1% | 5.6% | Ask fatigue in Q4 |
| Manufacturing / industrial | 2.0% | 3.5% | Long buying cycles, generic content |
| Education | 3.0% | 5.2% | Academic-calendar timing errors |
Cross-check these against the published benchmark sets from major ESPs — Mailchimp's benchmark report segments by industry, and HubSpot's marketing statistics library aggregates across several sources. Both are directionally useful; neither should be treated as a target you owe your CEO.
The more valuable benchmark is internal. Pull your last 12 campaigns, drop the top and bottom outlier, and average the middle 10. That's your baseline. Everything you do next is measured against that, not against a stranger's e-commerce list.
Why are bot clicks wrecking your CTR benchmark?#
Because on B2B lists, a meaningful slice of your "clicks" were never human.
Corporate email security — Microsoft Defender Safe Links, Proofpoint URL Defense, Mimecast, Barracuda — fetches every URL in an inbound message to scan it. Your ESP records that fetch as a click. On lists heavy with enterprise domains, this inflates raw CTR by roughly 10% to 35%.
You can spot the signature:
- Sub-second click timing. A click registered 0.4 seconds after delivery is a scanner. Humans take at least a few seconds to open, read, and click.
- Full-sweep clicking. One recipient "clicking" every link in the email, including the unsubscribe and the privacy policy, in the same second.
- Datacenter user agents. Clicks from AWS, Azure, or known security-vendor IP ranges rather than consumer ISPs.
- Zero downstream behavior. The click lands but the session bounces instantly with no scroll, no page-two, no conversion.
- Domain clustering. CTR at 22% for one enterprise domain and 2% everywhere else means that domain runs a scanner, not that they love you.
Most modern ESPs now offer bot-click filtering. Turn it on, then re-baseline — your CTR will drop and your conversion-per-click will jump, because the denominator finally reflects humans. Don't panic-report the drop as a performance regression; annotate the date in your dashboard.
Does list quality matter more than copy for CTR?#
Yes, and the math isn't close.
CTR uses delivered emails as the denominator. Every address that lands but never engages — a departed employee, a typo'd signup, a role account like info@ that three people ignore — permanently drags your rate down. You cannot copywrite your way out of a denominator problem.
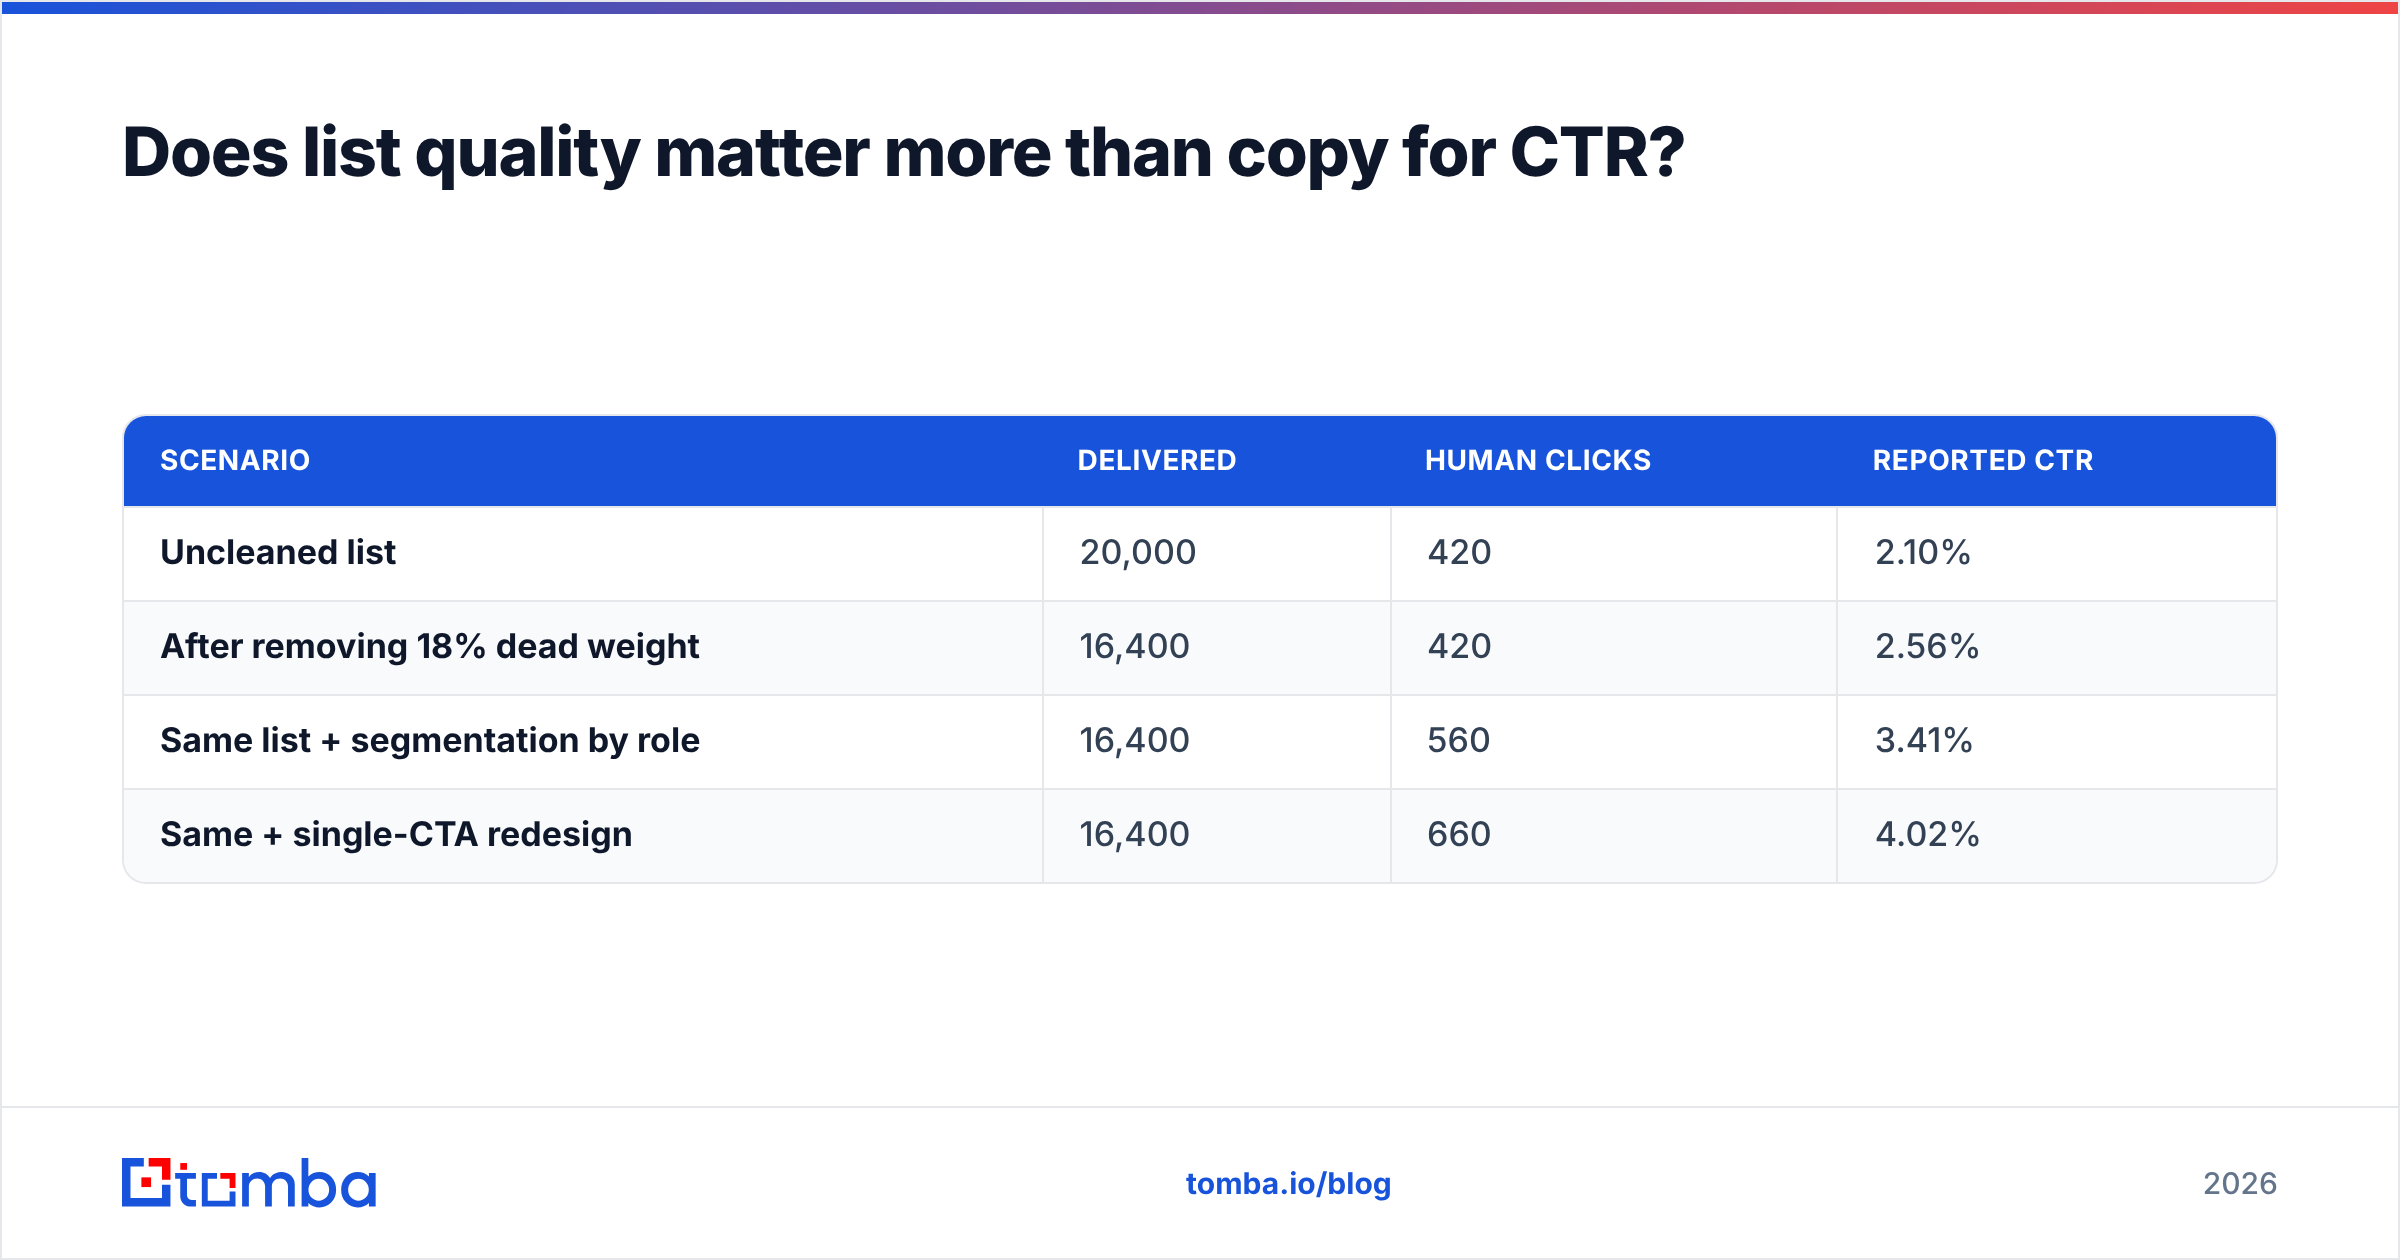
Consider a 20,000-contact list where 18% of addresses are dead or unengaged:
| Scenario | Delivered | Human clicks | Reported CTR |
|---|---|---|---|
| Uncleaned list | 20,000 | 420 | 2.10% |
| After removing 18% dead weight | 16,400 | 420 | 2.56% |
| Same list + segmentation by role | 16,400 | 560 | 3.41% |
| Same + single-CTA redesign | 16,400 | 660 | 4.02% |
The first row to the second required zero creative work — just verification. That's a 22% relative lift from deleting addresses that were never going to click. Running your list through an email verifier before a major send is the cheapest CTR improvement available, and it protects email deliverability at the same time, since high bounce rates trigger throttling at the mailbox providers.
Catch-all domains deserve special attention on B2B lists. They accept everything at the SMTP layer, so a naive verifier marks them "valid" and you find out the truth only when engagement flatlines. A dedicated catch-all verifier resolves a large share of those to a real accept/reject decision rather than shrugging.
What actually moves click through rate, ranked?#
In rough order of impact per hour of effort:
- List verification and pruning — removes the dead denominator. Biggest single lever, lowest creative cost. Re-verify quarterly; B2B data decays at roughly 2–2.5% per month from job changes alone.
- Segmentation — sending three relevant emails to three segments consistently beats one email to everyone. Expect 30–60% relative CTR lift versus full-list broadcast.
- One CTA per email — every additional link splits attention and cannibalizes unique clicks. Newsletters are the exception, but even there, one hero link outperforms eight equal-weight links.
- Send-time alignment — not the mythical "Tuesday 10am" rule, but matching send time to when your segment historically clicks. Pull it from your own data, not a blog post.
- Subject line and preview text — matters, but mostly upstream of CTR via opens. Test with a subject line tester before you assume the body copy is the problem.
- Plain-text-leaning design — image-heavy templates get clipped, blocked, and filtered. Text-forward emails with one styled button routinely outclick designed templates on B2B lists.
Notice that four of the six are structural, not creative. Teams usually spend their time on item five and wonder why nothing moves.
How do cold outreach CTR benchmarks differ?#
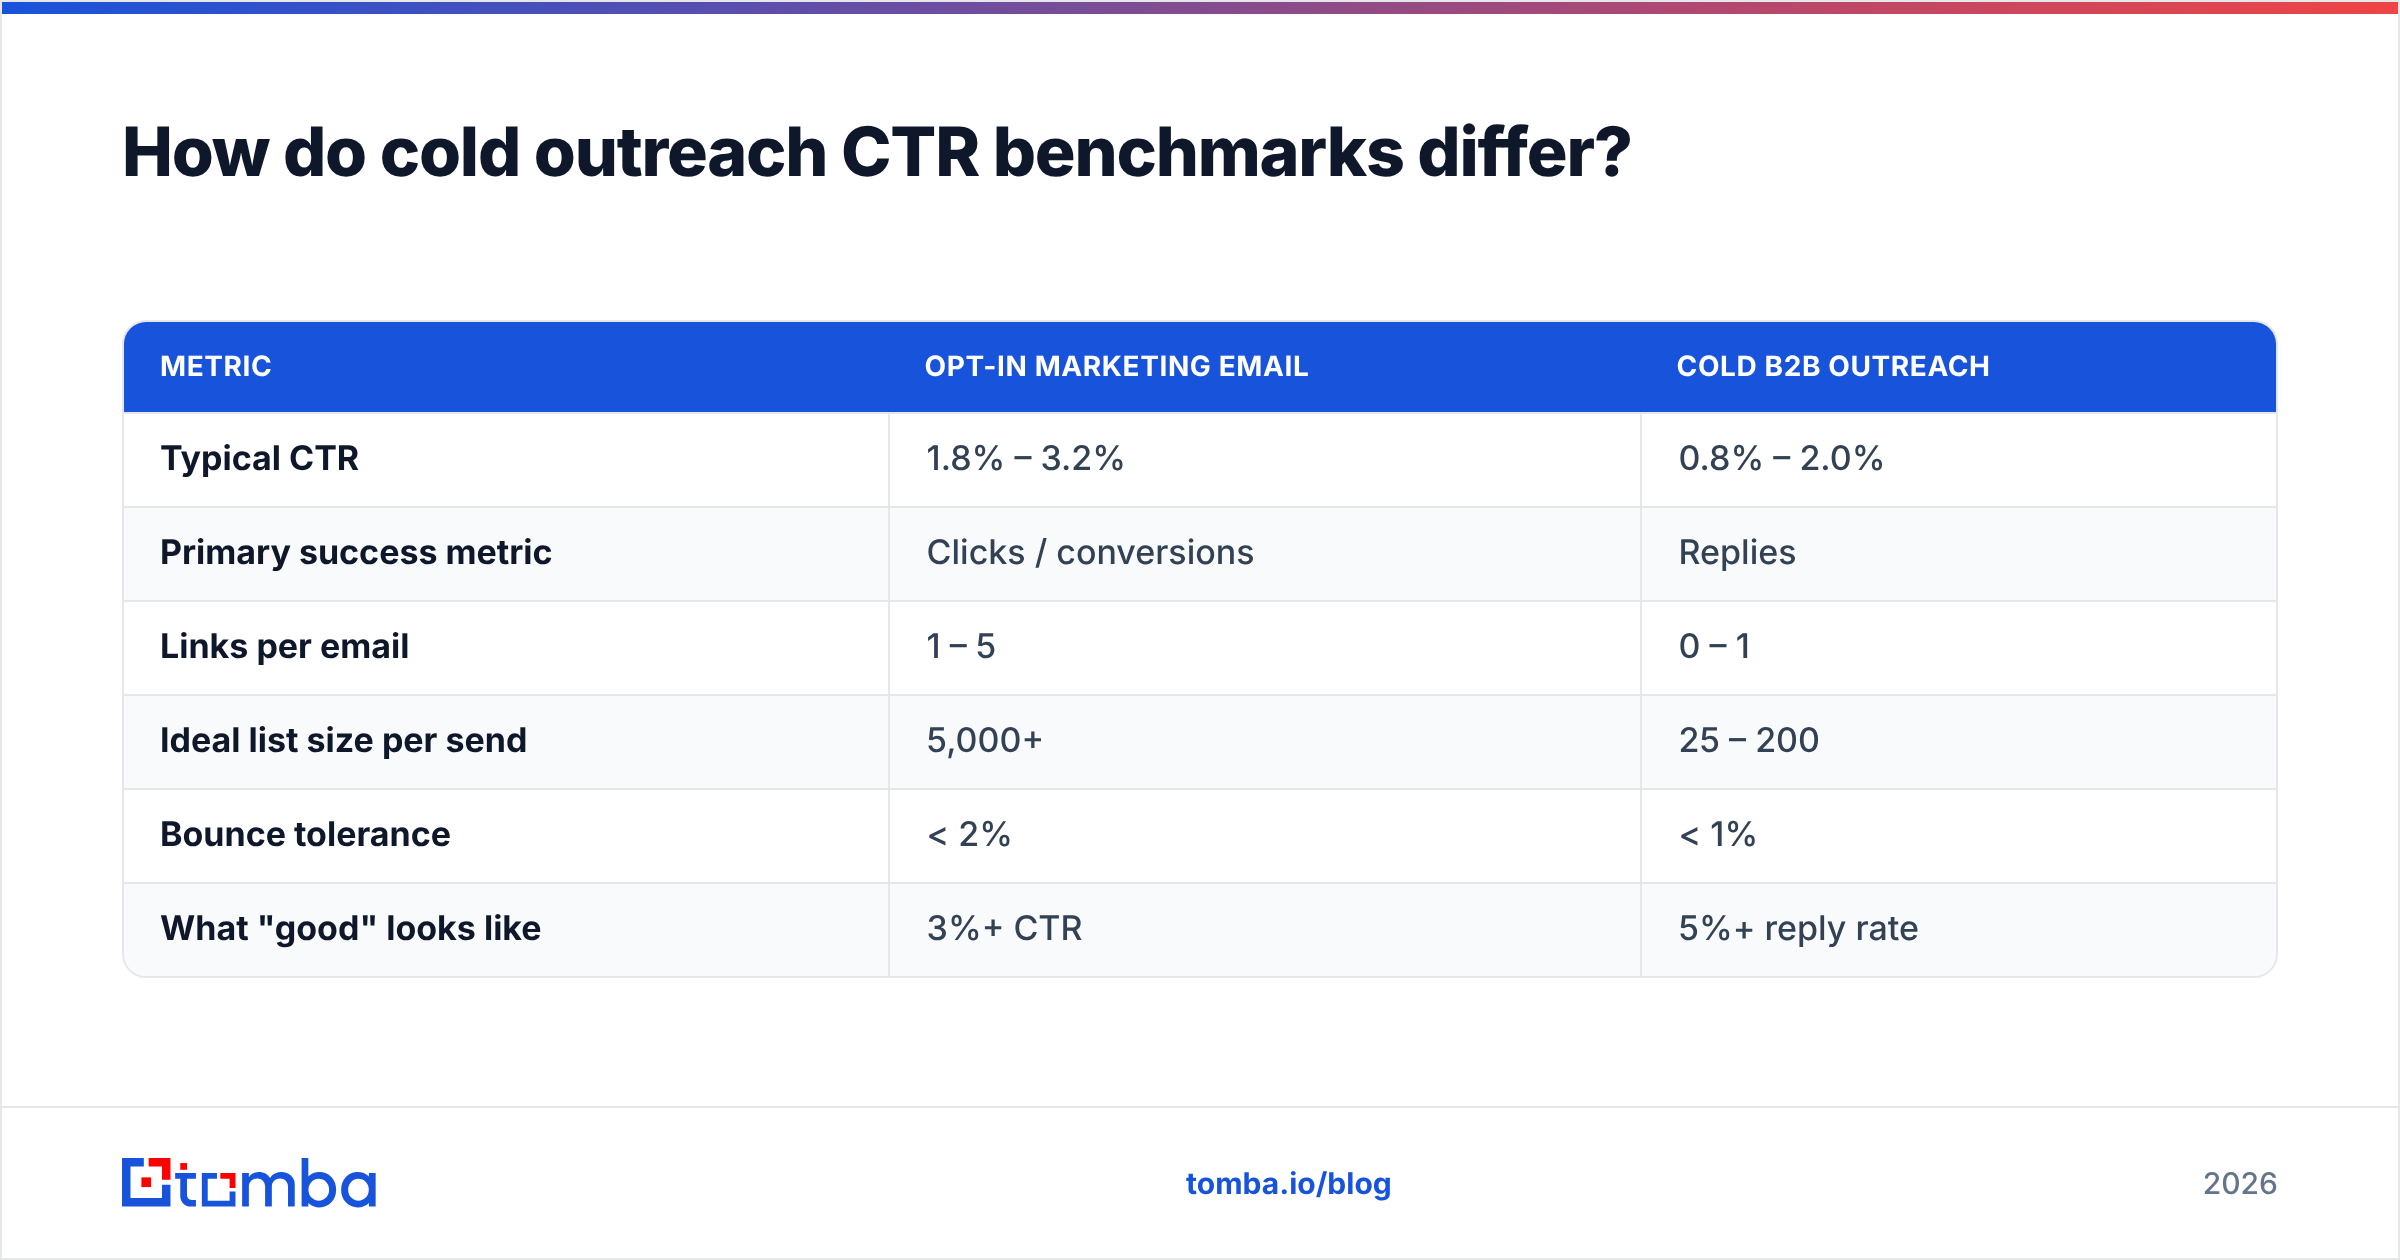
Cold email plays by different rules, and applying a newsletter benchmark to a cold sequence will make a healthy campaign look broken.
| Metric | Opt-in marketing email | Cold B2B outreach |
|---|---|---|
| Typical CTR | 1.8% – 3.2% | 0.8% – 2.0% |
| Primary success metric | Clicks / conversions | Replies |
| Links per email | 1 – 5 | 0 – 1 |
| Ideal list size per send | 5,000+ | 25 – 200 |
| Bounce tolerance | < 2% | < 1% |
| What "good" looks like | 3%+ CTR | 5%+ reply rate |
The key insight: in cold outreach, a link is a liability. Links in a first-touch cold email raise spam-filter scrutiny and give the recipient something to ignore instead of something to answer. The best-performing cold sequences often carry zero links in email one and measure success by response rate rather than CTR entirely.
If you're running cold outbound and your CTR is 0.6%, that's not necessarily a failure — check replies before you rewrite anything. And if your bounce rate is above 3%, stop the campaign and fix the data; you're actively burning sending-domain reputation, which will depress every metric downstream for weeks.
How do you diagnose a low CTR in 30 minutes?#
Work the funnel backwards. Each step rules out a layer.
- Check delivery, not just "sent." If 8% never landed, your CTR problem is a deliverability problem wearing a costume. Look at bounce breakdown — hard bounces mean bad data, soft bounces at scale mean reputation.
- Check inbox placement, not just delivery. Delivered-to-spam still counts as delivered. Run a seed test across Gmail, Outlook, and Yahoo.
- Compare CTOR to CTR. Healthy CTOR (10%+) with weak CTR means the content works and opens are the bottleneck — a subject-line and sender-name problem. Weak CTOR means the body or the offer is the problem.
- Filter bot clicks and re-read. If filtered CTR is 40% below raw, your dashboard has been lying to you and your real baseline is lower than you thought.
- Segment the report by domain age and source. Contacts acquired more than 18 months ago with no re-verification almost always show a distinct, much lower CTR band. That's your cleanup list.
- Look at click heat by link position. If 80% of clicks hit the first link, your later CTAs are decoration. Cut them.
Most "our CTR is terrible" investigations end at step one or step five. Copy is rarely the culprit that people assume it is.
Which benchmark should you actually commit to?#
Pick a target that is your trailing 12-campaign median plus 15%, reviewed quarterly. Then hold two guardrails alongside it: bounce rate under 1.5%, and unsubscribe rate under 0.3%. A CTR that climbs while unsubscribes climb faster isn't a win — it's a list being consumed rather than built.
Report CTR with the bot-filter status stated explicitly, and always pair it with a downstream number: clicks-to-demo, clicks-to-purchase, clicks-to-reply. A 5% CTR that converts nothing is worse than a 2% CTR that fills the pipeline. Benchmarks are a diagnostic tool, not a scoreboard.
Start with the data layer#
If you take one thing from this: your click through rate benchmark is a function of your list before it's a function of your writing. Dead addresses, catch-all domains, and contacts who changed jobs 14 months ago sit in the denominator quietly costing you a full percentage point.
Fix that layer first. Use the Tomba Email Finder to build lists from verified, current sources rather than scraped exports, and run existing lists through verification before your next major send. The free tier covers 25 searches a month if you want to test the accuracy on a sample before committing; paid plans start at $49/mo on Starter, with Growth at $99/mo — see Tomba pricing for the full breakdown. Clean the denominator, then go optimize the copy.
Related guides#
Ready to find emails that actually work?
Join 150,000+ professionals who stopped guessing and started sending. Free credits on signup — no credit card required.
Get the Tomba newsletter
Practical outbound tactics and product updates — once every two weeks.
About the author