Email Open Rate Calculator: Formula, Benchmarks & Fixes
Your open rate is probably wrong — Apple MPP inflates it and bounces skew the denominator. Here's the exact formula, 2026 benchmarks, and how to fix a number you can actually trust.
TL;DR
- The email open rate formula is
(unique opens ÷ delivered emails) × 100. Using sent instead of delivered is the single most common mistake, and it under-reports your rate by however big your bounce rate is. - Apple Mail Privacy Protection (MPP) pre-fetches tracking pixels, so roughly 40-60% of B2C-heavy lists report opens that no human ever made. Your raw open rate is inflated, not measured.
- A realistic 2026 cold-email open rate on a clean, verified list sits at 40-60%. If you're seeing 80%+, you're counting bots. If you're under 25%, you have a deliverability or list-hygiene problem, not a subject-line problem.
- Open rate is a diagnostic, not a goal. Reply rate and meetings booked are what get you paid.
- The fastest way to move the number: verify the list before you send. Invalid addresses bounce, bounces poison sender reputation, and reputation is what decides whether you land in the inbox at all.
What Is an Email Open Rate Calculator?#
An email open rate calculator is a small piece of arithmetic that turns two raw campaign numbers into a percentage you can compare across sends. That's it — no magic. The value comes from using the right two numbers and knowing what the output can and can't tell you.
Here's the analogy: your open rate is like a restaurant's door counter. It tells you how many people walked in — not how many sat down, ordered, or paid. A door counter that also counts the delivery drivers and the guy checking his phone in the doorway is exactly what MPP has done to email since 2021.
The core formula:
Open Rate = (Unique Opens ÷ Emails Delivered) × 100And the number you need before that one:
Emails Delivered = Emails Sent − Hard Bounces − Soft BouncesRun a concrete example. You send 2,000 emails. 180 bounce. 620 unique opens get logged.
- Wrong math: 620 ÷ 2,000 = 31.0%
- Right math: 620 ÷ 1,820 = 34.1%
A three-point swing on a single campaign sounds small. Across a quarter of sends, it's the difference between "our messaging is working" and "kill this sequence."
How Do You Calculate Open Rate Correctly?#
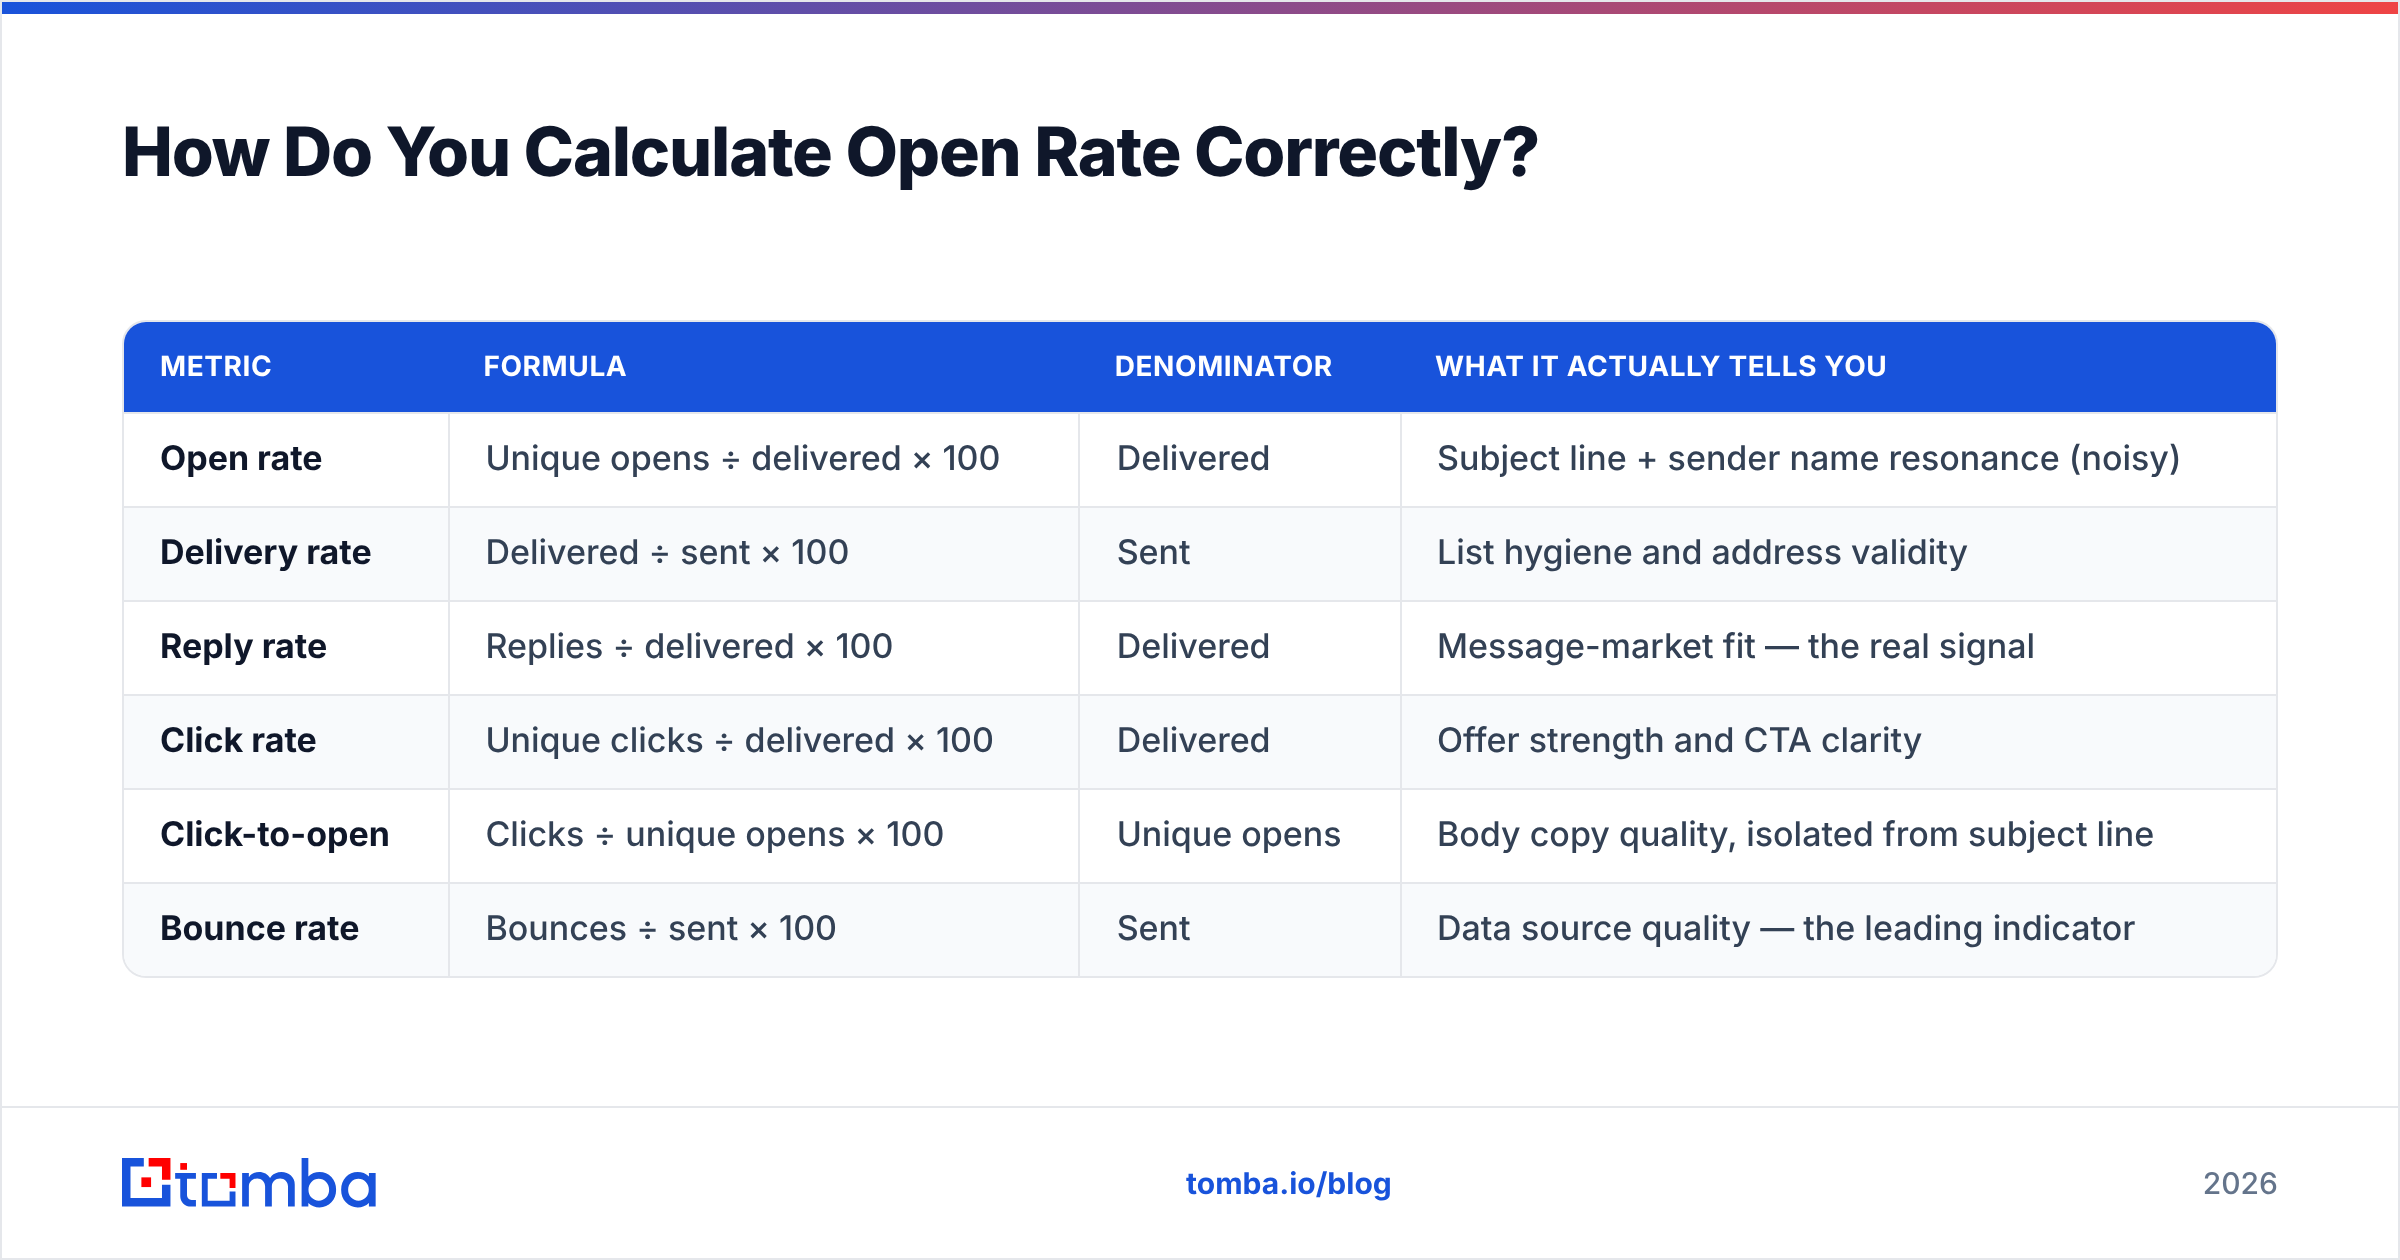
Work through these six inputs in order. Each one changes the answer.
- Emails sent — the raw count your sending tool queued. This is the number that flatters you. Do not use it as the denominator.
- Hard bounces — permanent failures: the mailbox doesn't exist, the domain is dead. Subtract these. They also predict your next problem: more than 2-3% hard bounces and mailbox providers start throttling you.
- Soft bounces — temporary: full mailbox, server timeout, greylisting. Subtract these too for the delivered count, but track them separately. A rising soft-bounce trend on the same domains usually means you're being quietly filtered.
- Unique opens — one per recipient, not total opens. Total opens counts the same prospect re-reading your email four times, which inflates everything and tells you nothing about reach.
- Machine opens — MPP pre-fetches, corporate security scanners (Proofpoint, Mimecast, Barracuda), and link-safety crawlers all fire your tracking pixel. Most modern ESPs let you filter or flag these. If yours doesn't, assume a chunk of your opens are synthetic.
- Human opens (estimated) — unique opens minus the machine portion. This is the only number worth reporting to a leadership team.
| Metric | Formula | Denominator | What it actually tells you |
|---|---|---|---|
| Open rate | Unique opens ÷ delivered × 100 | Delivered | Subject line + sender name resonance (noisy) |
| Delivery rate | Delivered ÷ sent × 100 | Sent | List hygiene and address validity |
| Reply rate | Replies ÷ delivered × 100 | Delivered | Message-market fit — the real signal |
| Click rate | Unique clicks ÷ delivered × 100 | Delivered | Offer strength and CTA clarity |
| Click-to-open | Clicks ÷ unique opens × 100 | Unique opens | Body copy quality, isolated from subject line |
| Bounce rate | Bounces ÷ sent × 100 | Sent | Data source quality — the leading indicator |
Note the pattern: everything except delivery rate and bounce rate uses delivered as the denominator. Mixing denominators across a dashboard is how teams end up arguing about numbers that were never comparable.

Why Is Apple MPP Breaking Your Open Rate?#
Because it opens your email before your prospect does.
Since iOS 15, Apple Mail Privacy Protection routes images — including your invisible 1×1 tracking pixel — through a proxy server that downloads them the moment the message hits the mailbox. Nobody has to look at anything. Apple's own Mail Privacy Protection documentation is explicit that this hides IP address and read activity from senders.
The practical damage:
- Every MPP recipient registers as an open, usually within minutes of delivery, regardless of whether the email is ever read.
- Open-based automations fire on nothing. "If opened and no reply after 3 days, send follow-up B" now branches on noise.
- Open-time and open-location data are garbage. The proxy's timestamp and geography aren't your prospect's.
- A/B tests on subject lines lose statistical power. If half your opens are machines and machines open both variants at 100%, your measured difference shrinks toward zero.
How much of your list is affected depends on audience. Apple Mail's share of email opens has hovered near 50%+ in Litmus's email client market share tracking — heavily consumer-skewed, but plenty of B2B founders and executives read work mail on iPhones.
What to do about it:
- Segment reporting by mail client where your ESP exposes it, and report Apple/non-Apple open rates separately.
- Treat click rate and reply rate as your primary optimization targets. Neither is spoofed by pixel pre-fetching.
- Rebuild open-triggered sequences around clicks, replies, and time delays.
- Keep tracking opens anyway — as a relative trend on the same segment over time, they still catch a deliverability cliff faster than anything else.
What Are Realistic Open Rate Benchmarks in 2026?#
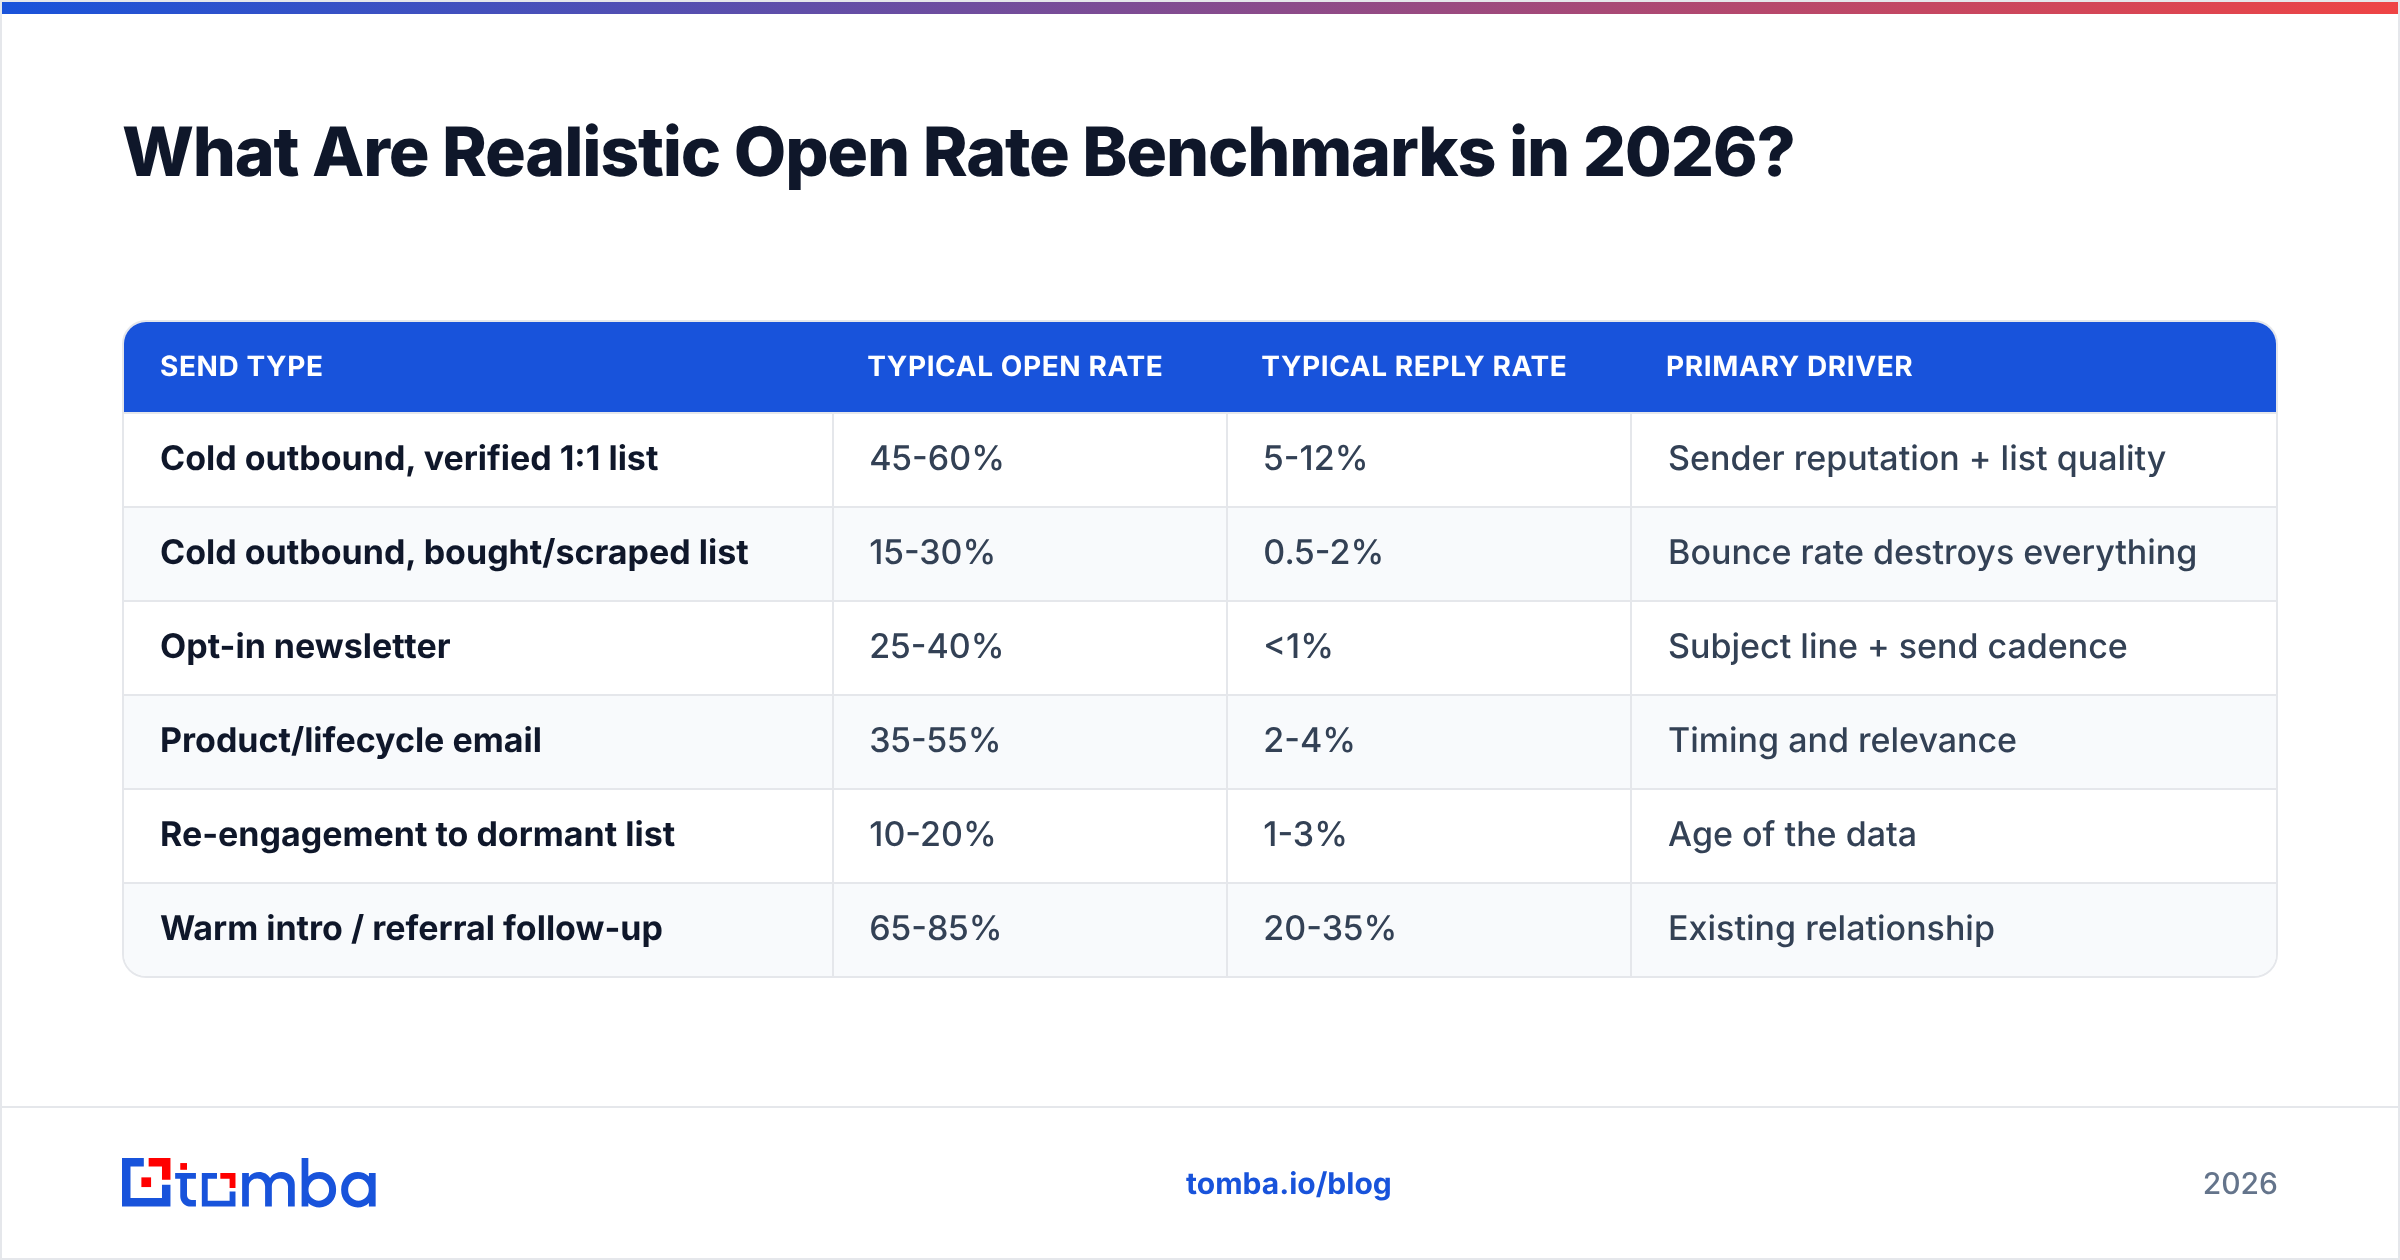
Context first: a "good" open rate for a 5,000-person newsletter and a 200-person hand-picked cold sequence are not the same animal, and comparing them is malpractice.
| Send type | Typical open rate | Typical reply rate | Primary driver |
|---|---|---|---|
| Cold outbound, verified 1:1 list | 45-60% | 5-12% | Sender reputation + list quality |
| Cold outbound, bought/scraped list | 15-30% | 0.5-2% | Bounce rate destroys everything |
| Opt-in newsletter | 25-40% | <1% | Subject line + send cadence |
| Product/lifecycle email | 35-55% | 2-4% | Timing and relevance |
| Re-engagement to dormant list | 10-20% | 1-3% | Age of the data |
| Warm intro / referral follow-up | 65-85% | 20-35% | Existing relationship |
Two rules of thumb worth internalizing:
- Above 80% on cold outbound is a red flag, not a trophy. Either MPP is doing the opening, or a security appliance is scanning every message before it reaches a human.
- Below 20% on a verified list means deliverability, not copy. No subject line rescues a message sitting in spam. Check your SPF record, DKIM alignment, and DMARC policy before you touch a word of the email.
For a broader cross-industry view, HubSpot's email marketing benchmark research publishes updated averages by vertical and company size — useful for sanity-checking your own numbers against your segment rather than against a global average that includes retail blast campaigns.
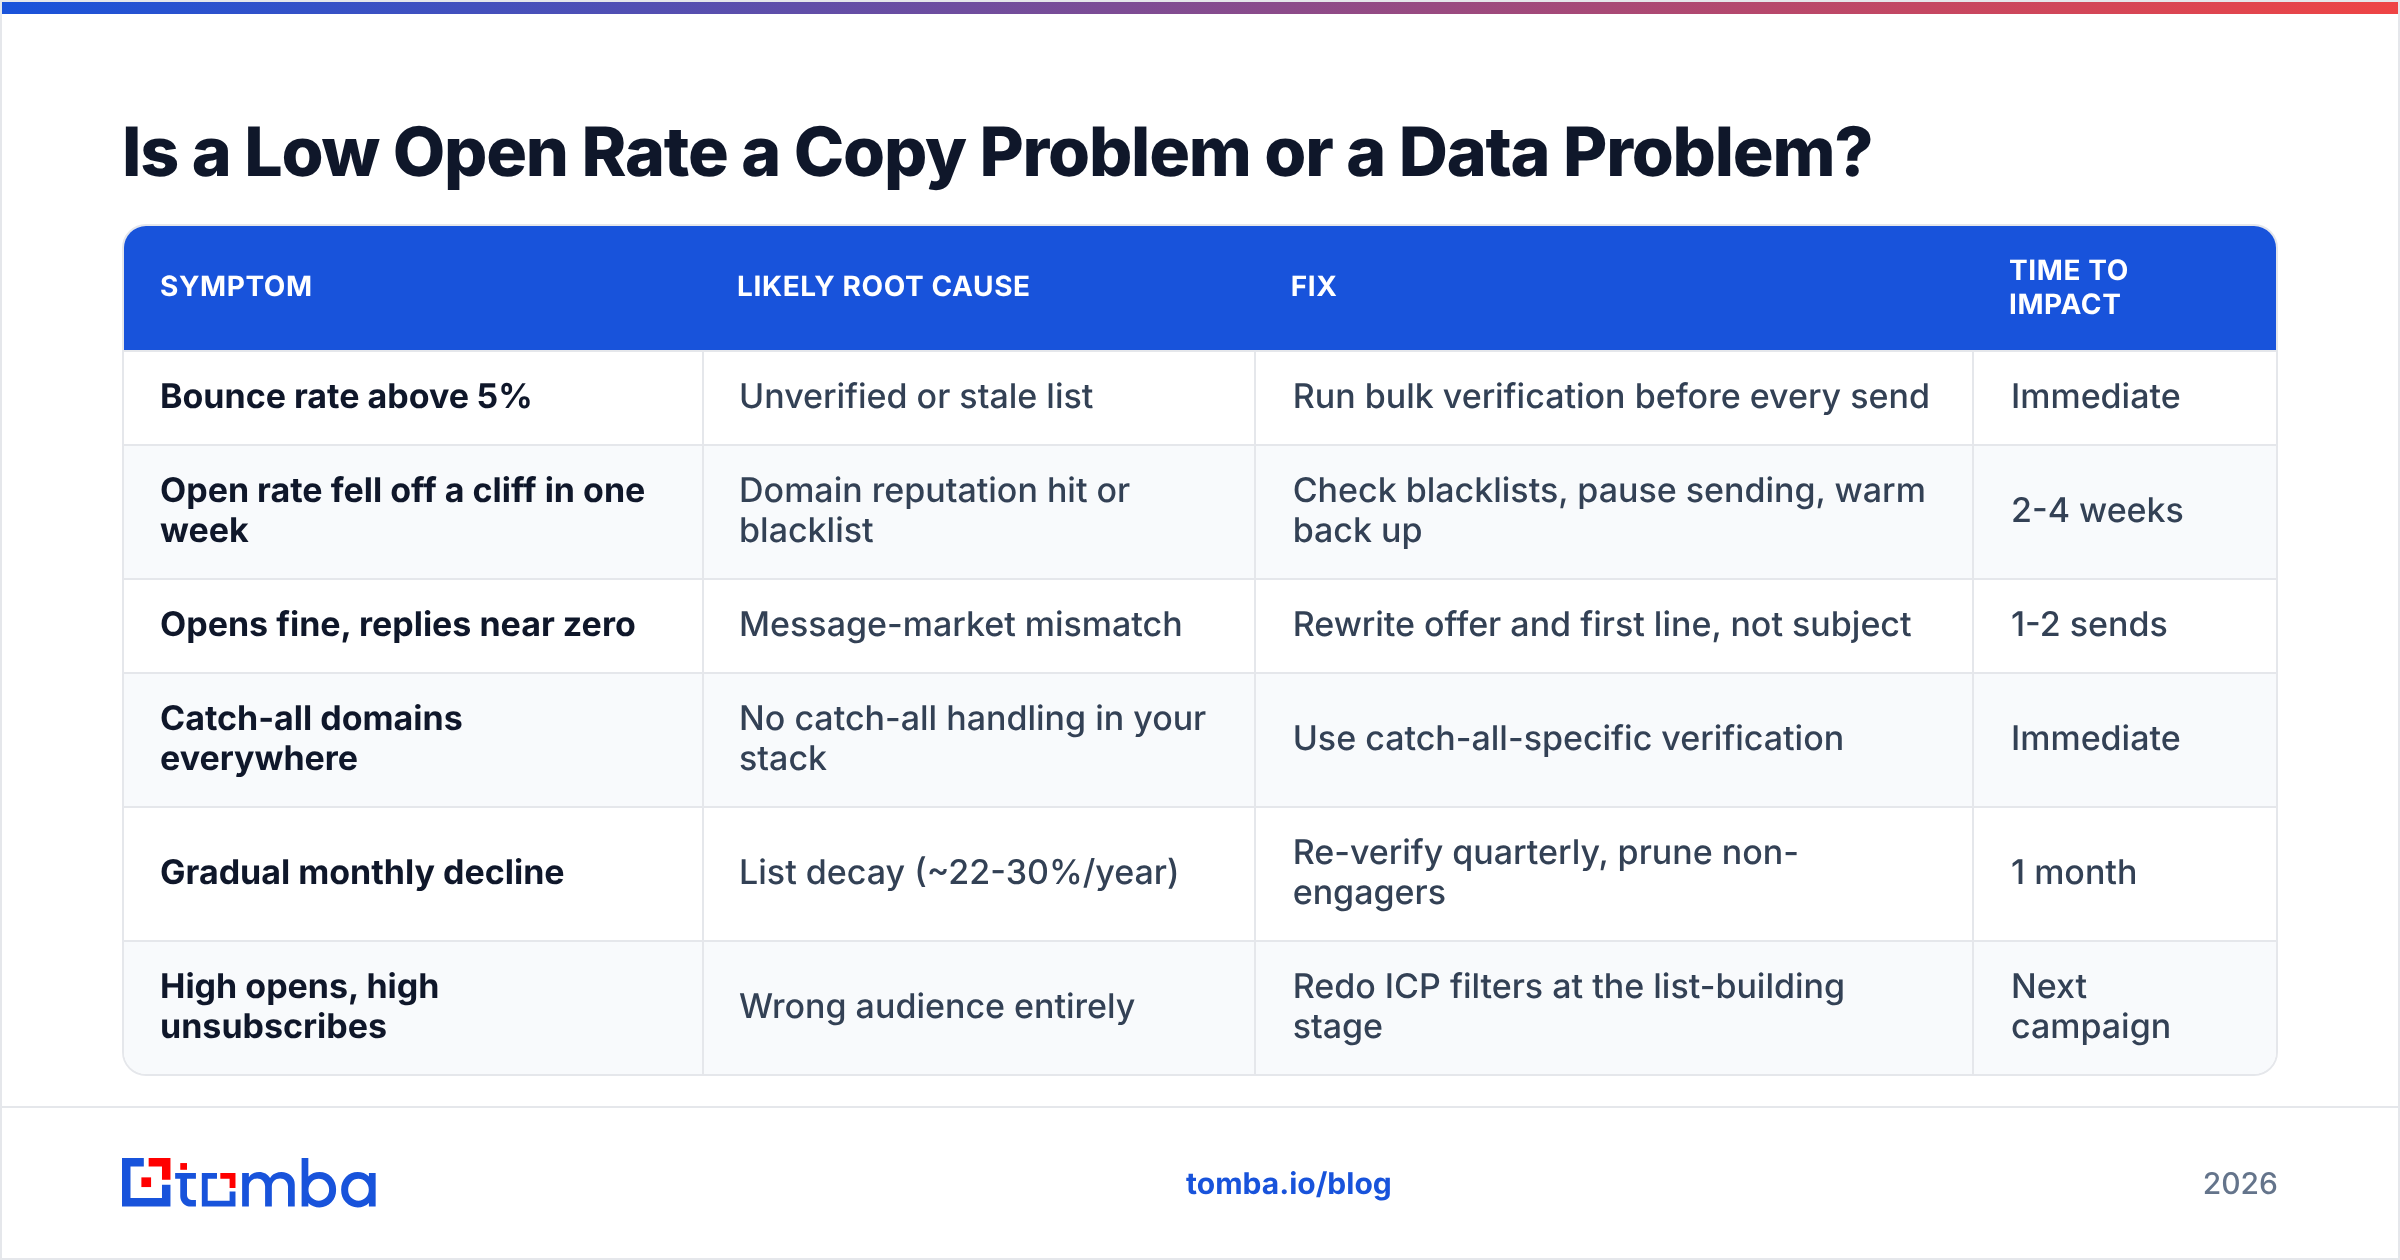
Is a Low Open Rate a Copy Problem or a Data Problem?#
Nine times out of ten on cold outbound: data.
Diagnose in this order, because fixing step 4 while step 1 is broken changes nothing.
| Symptom | Likely root cause | Fix | Time to impact |
|---|---|---|---|
| Bounce rate above 5% | Unverified or stale list | Run bulk verification before every send | Immediate |
| Open rate fell off a cliff in one week | Domain reputation hit or blacklist | Check blacklists, pause sending, warm back up | 2-4 weeks |
| Opens fine, replies near zero | Message-market mismatch | Rewrite offer and first line, not subject | 1-2 sends |
| Catch-all domains everywhere | No catch-all handling in your stack | Use catch-all-specific verification | Immediate |
| Gradual monthly decline | List decay (~22-30%/year) | Re-verify quarterly, prune non-engagers | 1 month |
| High opens, high unsubscribes | Wrong audience entirely | Redo ICP filters at the list-building stage | Next campaign |
The mechanism behind row one deserves spelling out, because it's the one most teams underestimate. Hard bounces don't just shrink your denominator. Mailbox providers read a high bounce rate as a signal that you're sending to a purchased or scraped list — the exact behavior spam operators exhibit. Your sender reputation drops, more of your good mail routes to spam, and your open rate collapses on valid addresses too. One dirty campaign contaminates the next five clean ones.
That's why verification belongs at the front of the pipeline, not the end. Running an email verifier across your list before the first send is cheaper than the two weeks of reputation repair a 12% bounce rate costs you. If your target accounts run catch-all domains — common at mid-market and enterprise — a general verifier will mark everything "accept-all" and leave you guessing; a dedicated catch-all verifier is what separates a usable address from a coin flip.
What Should You Track Instead of Open Rate?#
Build a small hierarchy and read it top-down. Each layer tells you something the layer above can't.
- Delivery rate (target: 97%+) — the foundation. If this is broken, every metric below it is measuring a smaller audience than you think you have.
- Reply rate (target: 5-12% cold) — the only metric that survived the privacy era untouched. A human has to type something. No proxy fakes this.
- Positive reply rate (target: 30-50% of all replies) — separate "interested, tell me more" from "unsubscribe" and "wrong person." Two campaigns with identical 8% reply rates can have wildly different pipelines behind them.
- Meetings booked per 100 delivered — the number a CRO actually cares about. Ties directly to pipeline and lets you back into cost-per-meeting.
- Click rate (when a link is present) — MPP proxies fetch images, not clicks. Still directionally honest, though some security scanners do follow links, so treat sub-1% differences as noise.
- Spam complaint rate (ceiling: 0.1%) — Google and Yahoo's bulk-sender requirements put 0.3% as the hard fail line. Above 0.1% you're on borrowed time.
If you're building this reporting layer yourself, note that most teams end up needing the same three inputs: a clean verified list, delivery/bounce data from the sending tool, and reply classification. Getting the first one right is upstream of everything, which is where a proper B2B database or an on-demand email finder beats a scraped CSV every time — the addresses are sourced and validated at the point of retrieval instead of six months before you send.
How Do You Improve Open Rate Without Gaming It?#
Ranked by expected impact per hour of effort.
1. Verify before every send. Not once a quarter — every send. B2B contact data decays around 22-30% annually as people change jobs, and that decay is lumpy: a single acquisition can invalidate 40 addresses at one account overnight.
2. Fix authentication properly. SPF, DKIM, and DMARC all aligned, with a DMARC policy at least at p=none and reporting turned on. Google and Yahoo have required this for bulk senders since 2024; without it you're not getting filtered, you're getting rejected.
3. Warm the domain and keep volume flat. Ramp new sending domains over 3-4 weeks. Spiky volume — 50 one day, 800 the next — reads as compromised-account behavior to mailbox providers.
4. Write the subject line for the preview pane, not the spec sheet. 30-50 characters, lowercase is fine, no brackets, no "Re:" fakery. The From name matters as much as the subject: a real person at a real company beats "Sales Team" by a wide margin.
5. Cut list size, raise list quality. 200 correctly targeted, verified contacts outperform 2,000 loosely-matched ones on every downstream metric, and they don't burn your domain. This is the single hardest change to sell internally and the one with the best returns.
6. Split by segment before you split by subject line. Most "the subject line didn't work" conclusions are actually "this offer doesn't apply to this segment." Segment first, then test copy inside the segment.
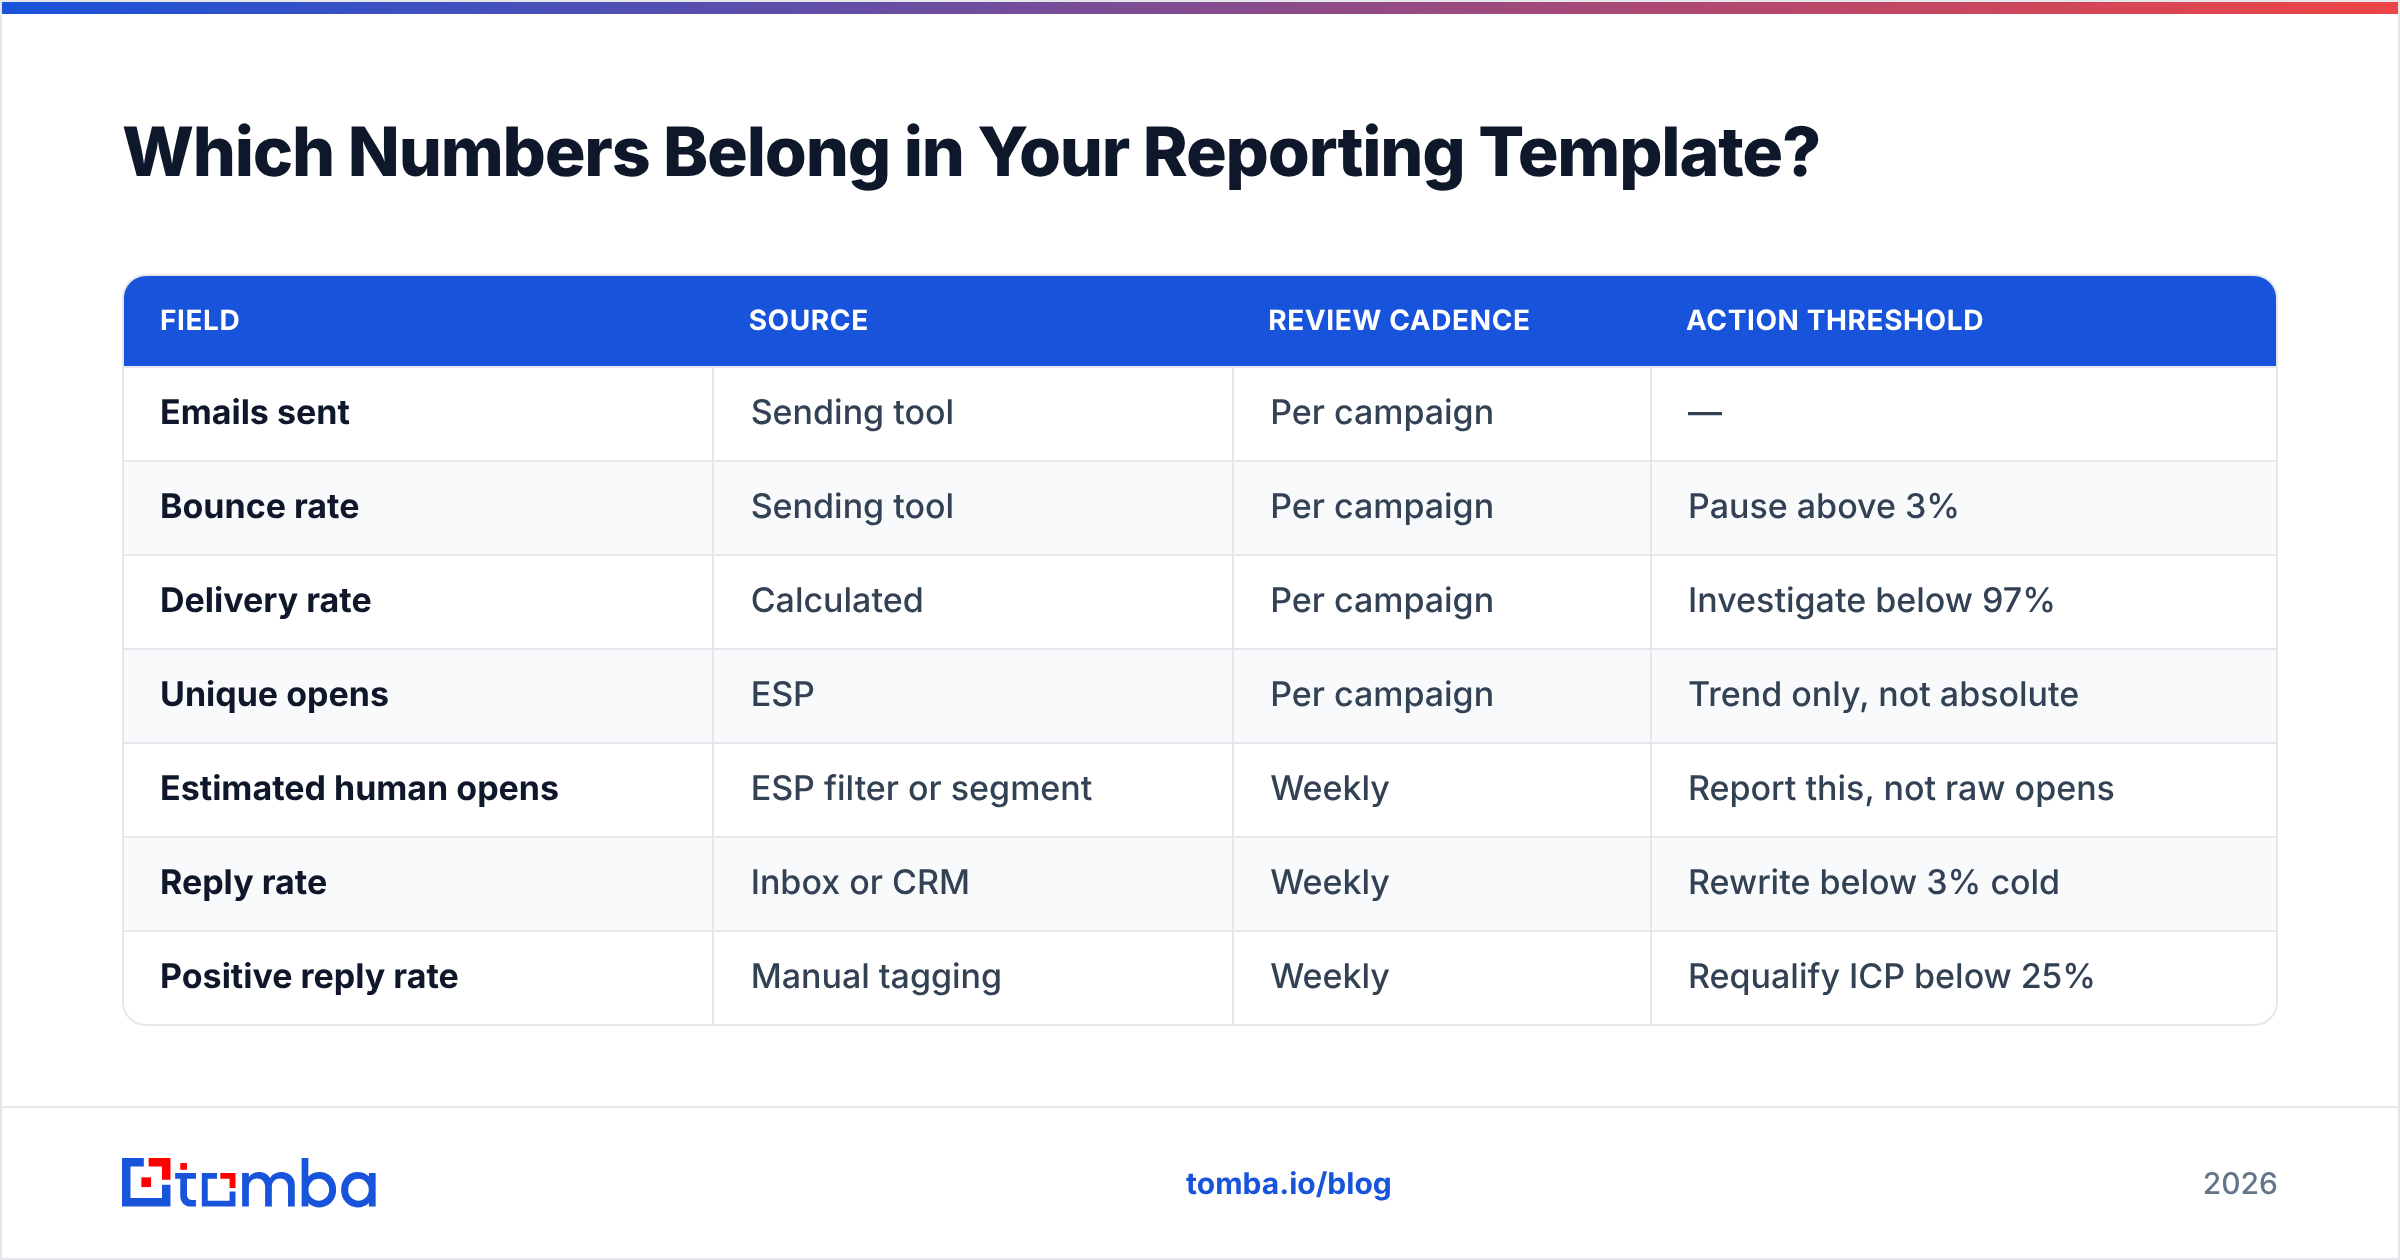
Which Numbers Belong in Your Reporting Template?#
Keep the dashboard to one screen. Anything you won't act on this week doesn't belong on it.
| Field | Source | Review cadence | Action threshold |
|---|---|---|---|
| Emails sent | Sending tool | Per campaign | — |
| Bounce rate | Sending tool | Per campaign | Pause above 3% |
| Delivery rate | Calculated | Per campaign | Investigate below 97% |
| Unique opens | ESP | Per campaign | Trend only, not absolute |
| Estimated human opens | ESP filter or segment | Weekly | Report this, not raw opens |
| Reply rate | Inbox or CRM | Weekly | Rewrite below 3% cold |
| Positive reply rate | Manual tagging | Weekly | Requalify ICP below 25% |
| Meetings booked | CRM | Weekly | The real scoreboard |
| Spam complaints | Postmaster tools | Weekly | Stop everything above 0.1% |
One operational note: pull bounce and delivery data from your sending tool and reply data from your CRM, then reconcile them weekly. ESP-reported replies routinely miss messages that came from a different address or got forwarded internally — which is exactly the kind of reply you most want to know about.
The Bottom Line#
Your open rate is a smoke alarm, not a thermostat. A sudden drop means something is genuinely on fire — usually deliverability. A high number means very little on its own, and in 2026 it very often means Apple's proxy is doing your engagement for you.
Calculate it correctly — unique opens over delivered, machine opens flagged, denominators consistent across your dashboard. Then stop optimizing it and go optimize reply rate, because that's the number attached to revenue.
And fix the input before you obsess over the output. Most open-rate problems are address-quality problems wearing a copywriting costume. Start your next campaign with a list that's actually deliverable: the Tomba Email Finder sources verified professional addresses by name, domain, or company, with a free tier at 25 searches a month to test against your own known-good contacts before you commit. Paid plans start at $49/mo (Starter), with Growth at $99/mo and Pro at $249/mo — see Tomba pricing for credit allocations. Verify first, send second, and your open rate calculator will finally be computing something real.
Related guides#
Ready to find emails that actually work?
Join 150,000+ professionals who stopped guessing and started sending. Free credits on signup — no credit card required.
Get the Tomba newsletter
Practical outbound tactics and product updates — once every two weeks.
About the author