Email Open Rate Tracking in 2026: A Complete, Honest Guide
Open rates stopped being a clean signal the day Apple started pre-fetching pixels. Here is what email open rate tracking still measures in 2026, where it lies, and the metrics that actually predict pipeline.
TL;DR
- Email open rate tracking works by loading a 1x1 invisible image from your sending platform's server. If the image never loads — or loads automatically in a privacy proxy — the number is wrong.
- Apple Mail Privacy Protection, Gmail's image proxy, and corporate security scanners now pre-load pixels for a large share of B2B recipients. Reported opens are inflated, sometimes by 30-60% on consumer-heavy lists.
- Open rate is still useful for relative comparisons inside one segment (subject line A vs B, Tuesday vs Thursday) and nearly useless as an absolute health metric.
- The metrics that survived: reply rate, positive reply rate, click-to-reply ratio, bounce rate, and spam-complaint rate. Track those as your primary dashboard.
- Before you blame your subject lines, check your list. A 12% bounce rate destroys deliverability faster than any tracking pixel, and it starts with unverified addresses.
What is email open rate tracking, and how does it actually work?#
Email open rate tracking is the practice of measuring what percentage of delivered emails were "opened" by recipients. The mechanism is older and dumber than most people expect.
Think of it like a tripwire across a doorway. Your email platform embeds a transparent 1x1 pixel image — a web beacon — at the bottom of the HTML body. The image URL contains a unique ID for that specific send to that specific recipient. When the recipient's mail client renders the message, it requests the image from your platform's server. That request is logged. One request equals one "open."
That is the entire system. There is no read receipt, no confirmation from the mail server, no signal from the recipient. You are inferring human attention from an image request.
Which means every assumption baked into open rate depends on one condition: only a human viewing the email causes the image to load. In 2026, that condition is false more often than it is true.
Three things break it:
- Images off by default. Plain-text clients and some corporate Outlook configurations never load remote images. A real human reads your email, replies, buys — and registers as "not opened."
- Automated pre-fetching. Privacy proxies and security scanners load every image in every message before the human sees it. Nobody read anything, but you logged an open.
- Plain-text sending. If you send true plain text (common in cold outbound, because it looks like a normal person wrote it), there is no HTML to embed a pixel in. Your open rate is structurally zero or your platform silently converts you to HTML.
Why did Apple Mail Privacy Protection break open rate tracking?#
Apple shipped Mail Privacy Protection (MPP) with iOS 15 in 2021, and it flipped the default. When enabled, Apple Mail routes messages through Apple's proxy servers, downloads all remote content in advance, and strips the IP address. Every message gets its pixel fired whether the user opens it or not.
The scale is what matters. Apple Mail holds a large share of email opens globally, and MPP is opt-in via a prompt that most users accept without reading. Vendors like Litmus, which track client market share, have documented the shift consistently since launch: a meaningful chunk of every list now reports 100% open rates by construction.
Gmail's image proxy is a different problem. Google has cached remote images since 2013 — it fetches the pixel once, serves it from Google's cache, and masks the recipient's IP and location. Opens are recorded, but repeat-open counts and geolocation data are garbage.
Then there is the enterprise layer. Security gateways (Proofpoint, Mimecast, Microsoft Defender for Office 365) detonate links and load images in sandboxes to check for malware. In B2B outbound, this is the single most common source of phantom opens — and worse, phantom clicks. If you have ever seen a lead "open" your email 14 times in 3 seconds at 4am, you met a security scanner.
How inflated is your open rate right now?#
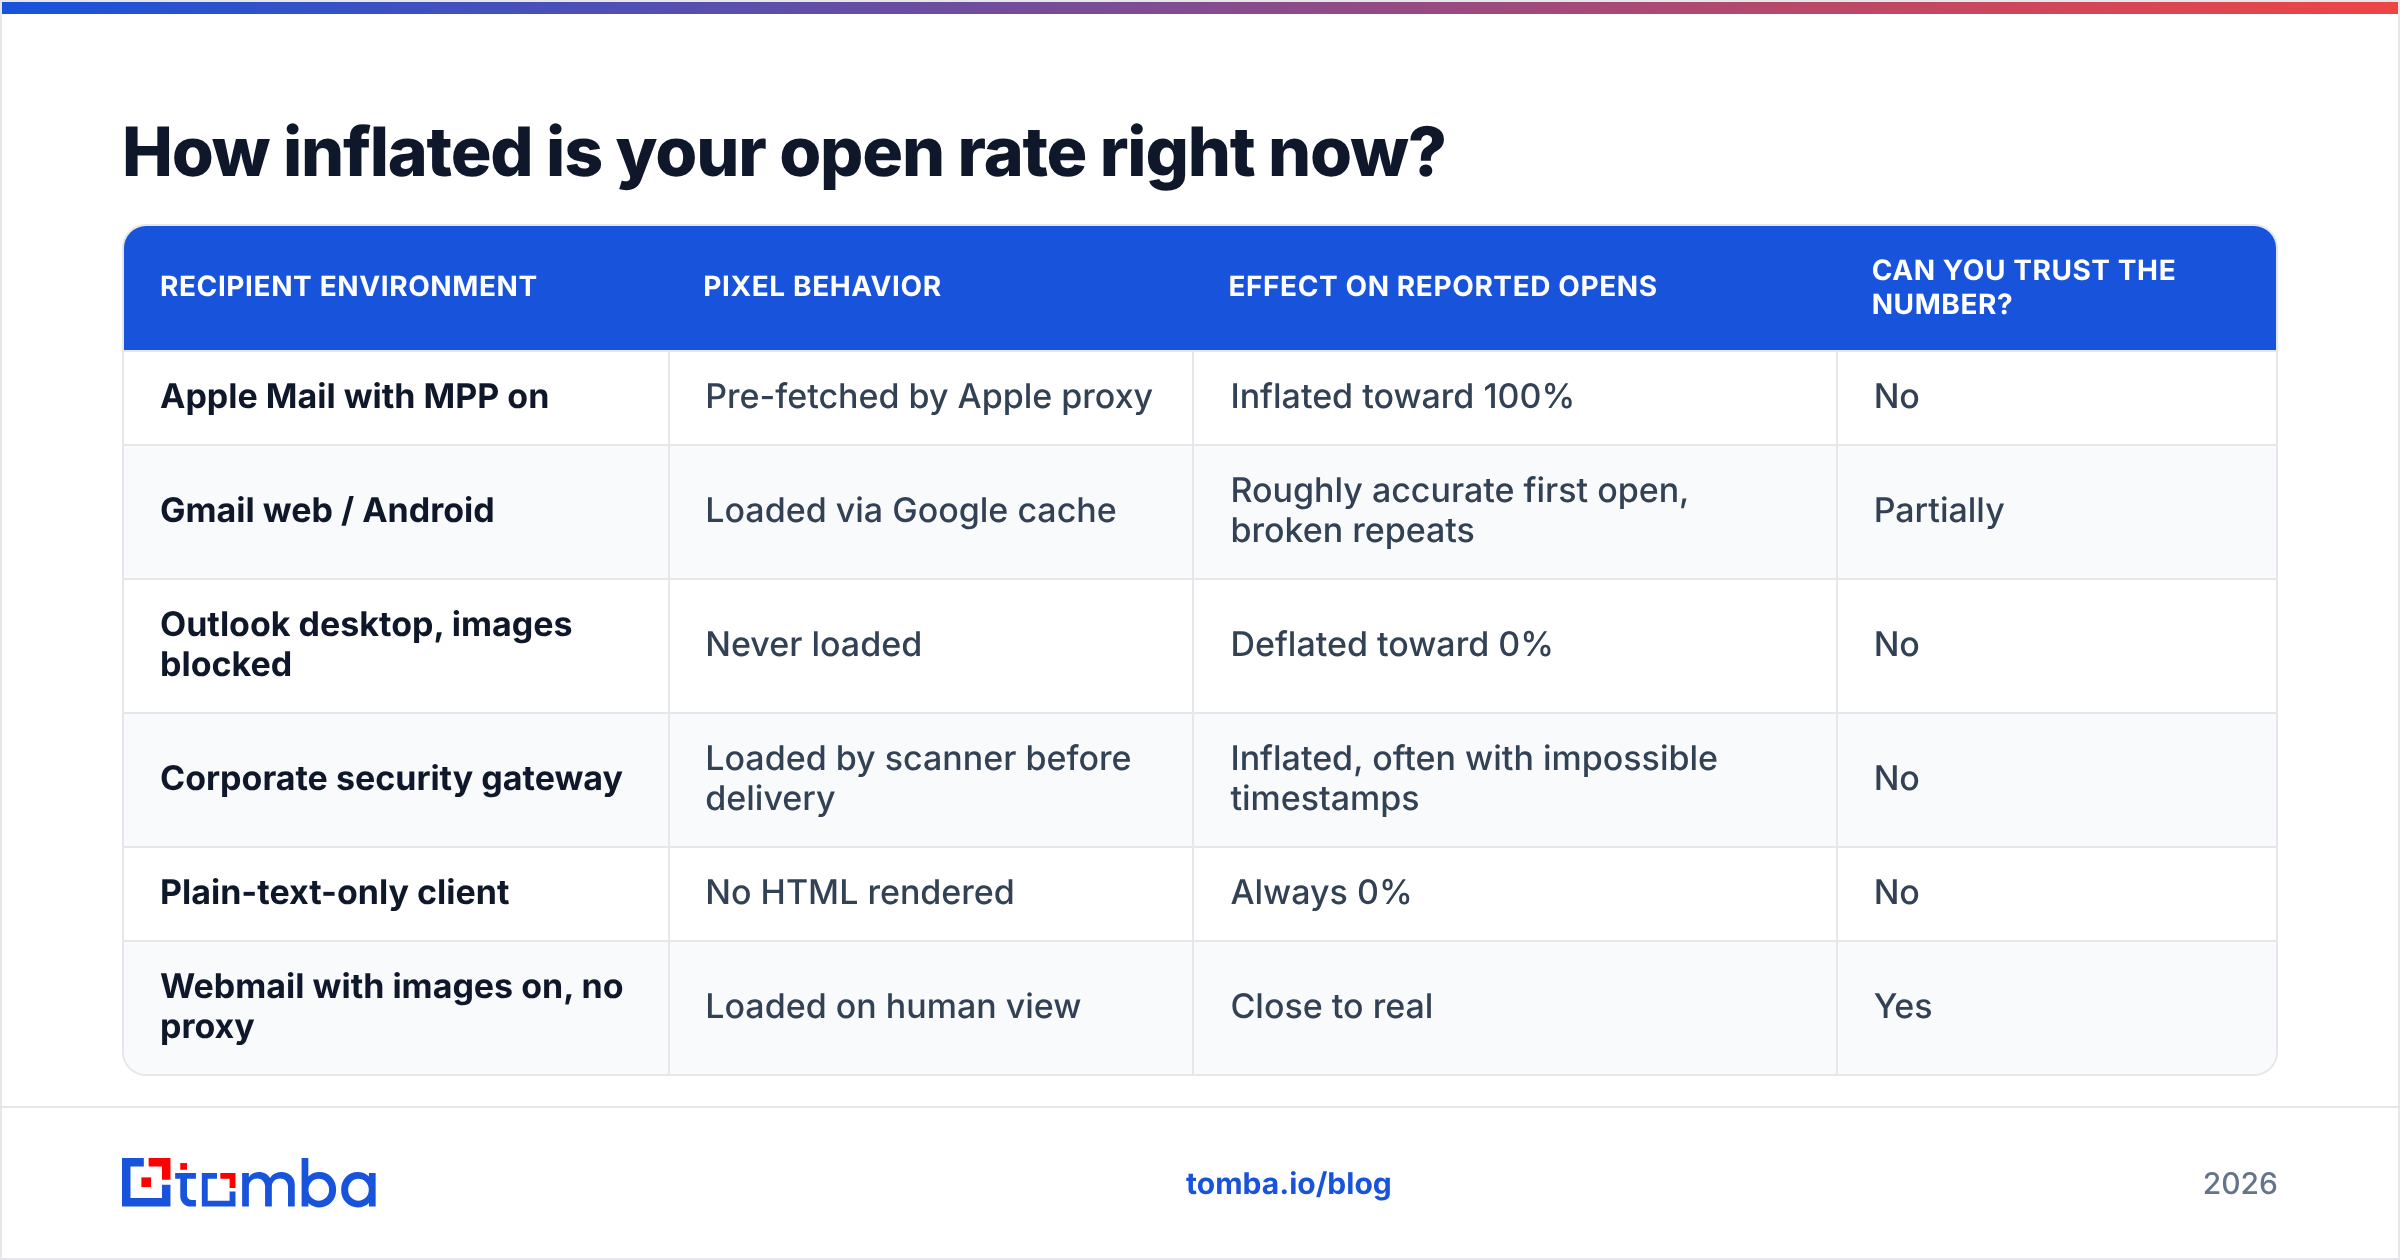
Inflation is not uniform. It depends on who you are emailing and what they use. Here is the practical breakdown:
| Recipient environment | Pixel behavior | Effect on reported opens | Can you trust the number? |
|---|---|---|---|
| Apple Mail with MPP on | Pre-fetched by Apple proxy | Inflated toward 100% | No |
| Gmail web / Android | Loaded via Google cache | Roughly accurate first open, broken repeats | Partially |
| Outlook desktop, images blocked | Never loaded | Deflated toward 0% | No |
| Corporate security gateway | Loaded by scanner before delivery | Inflated, often with impossible timestamps | No |
| Plain-text-only client | No HTML rendered | Always 0% | No |
| Webmail with images on, no proxy | Loaded on human view | Close to real | Yes |
The practical consequence: if your reported open rate went from 38% to 61% between 2021 and 2026, you did not get better at subject lines. Your list composition changed.
There is a second-order problem that hurts more. Many sales teams built automation on top of open data — "if opened twice, notify the rep," "if opened and no reply in 3 days, send follow-up two." Those rules now fire on scanner traffic. Reps call people who never saw the email. That is not a reporting inconvenience; it is wasted selling time and a worse prospect experience.
Which metrics should replace open rate in 2026?#
Replace one soft signal with a stack of hard ones. Each metric answers a different question, and none of them can be faked by a proxy server.
- Bounce rate — Did the address exist? This is your data-quality metric. Above 3% and mailbox providers start throttling you. Above 5% and you are actively damaging your domain. Fix it upstream with an email verifier, not downstream with apologies.
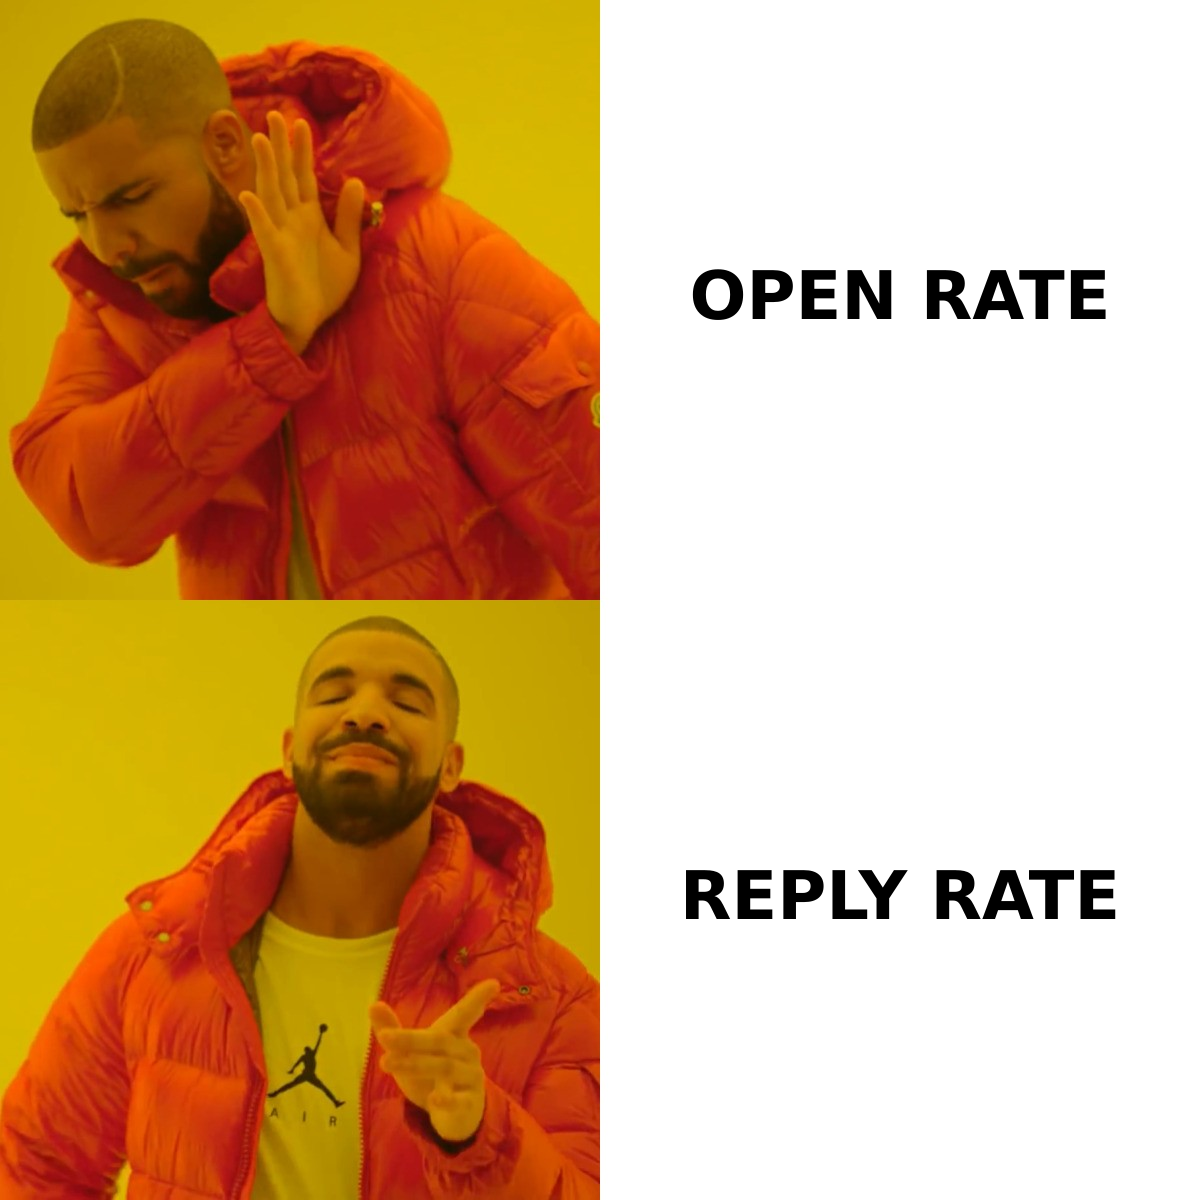
- Reply rate — Did a human respond? Unfakeable, because a proxy cannot type. This is the closest thing to ground truth in outbound. Track it per sequence step, not just per campaign.
- Positive reply rate — Did a human respond favorably? Splitting "interested" from "unsubscribe me" is the difference between a campaign that looks fine and one that works. Most teams that measure this discover 60-70% of their replies are negative.
- Click-to-reply ratio — Of the people who clicked, how many replied? A high click rate with near-zero replies usually means scanner traffic, not interest. This ratio exposes it fast.
- Spam complaint rate — Did they report you? Google and Yahoo enforce a 0.3% threshold. This is a hard operational limit, not a vanity number, and it should sit on the same dashboard as revenue.
- Meetings booked per 100 sends — The only metric your CRO cares about. Everything above is a diagnostic for this one.
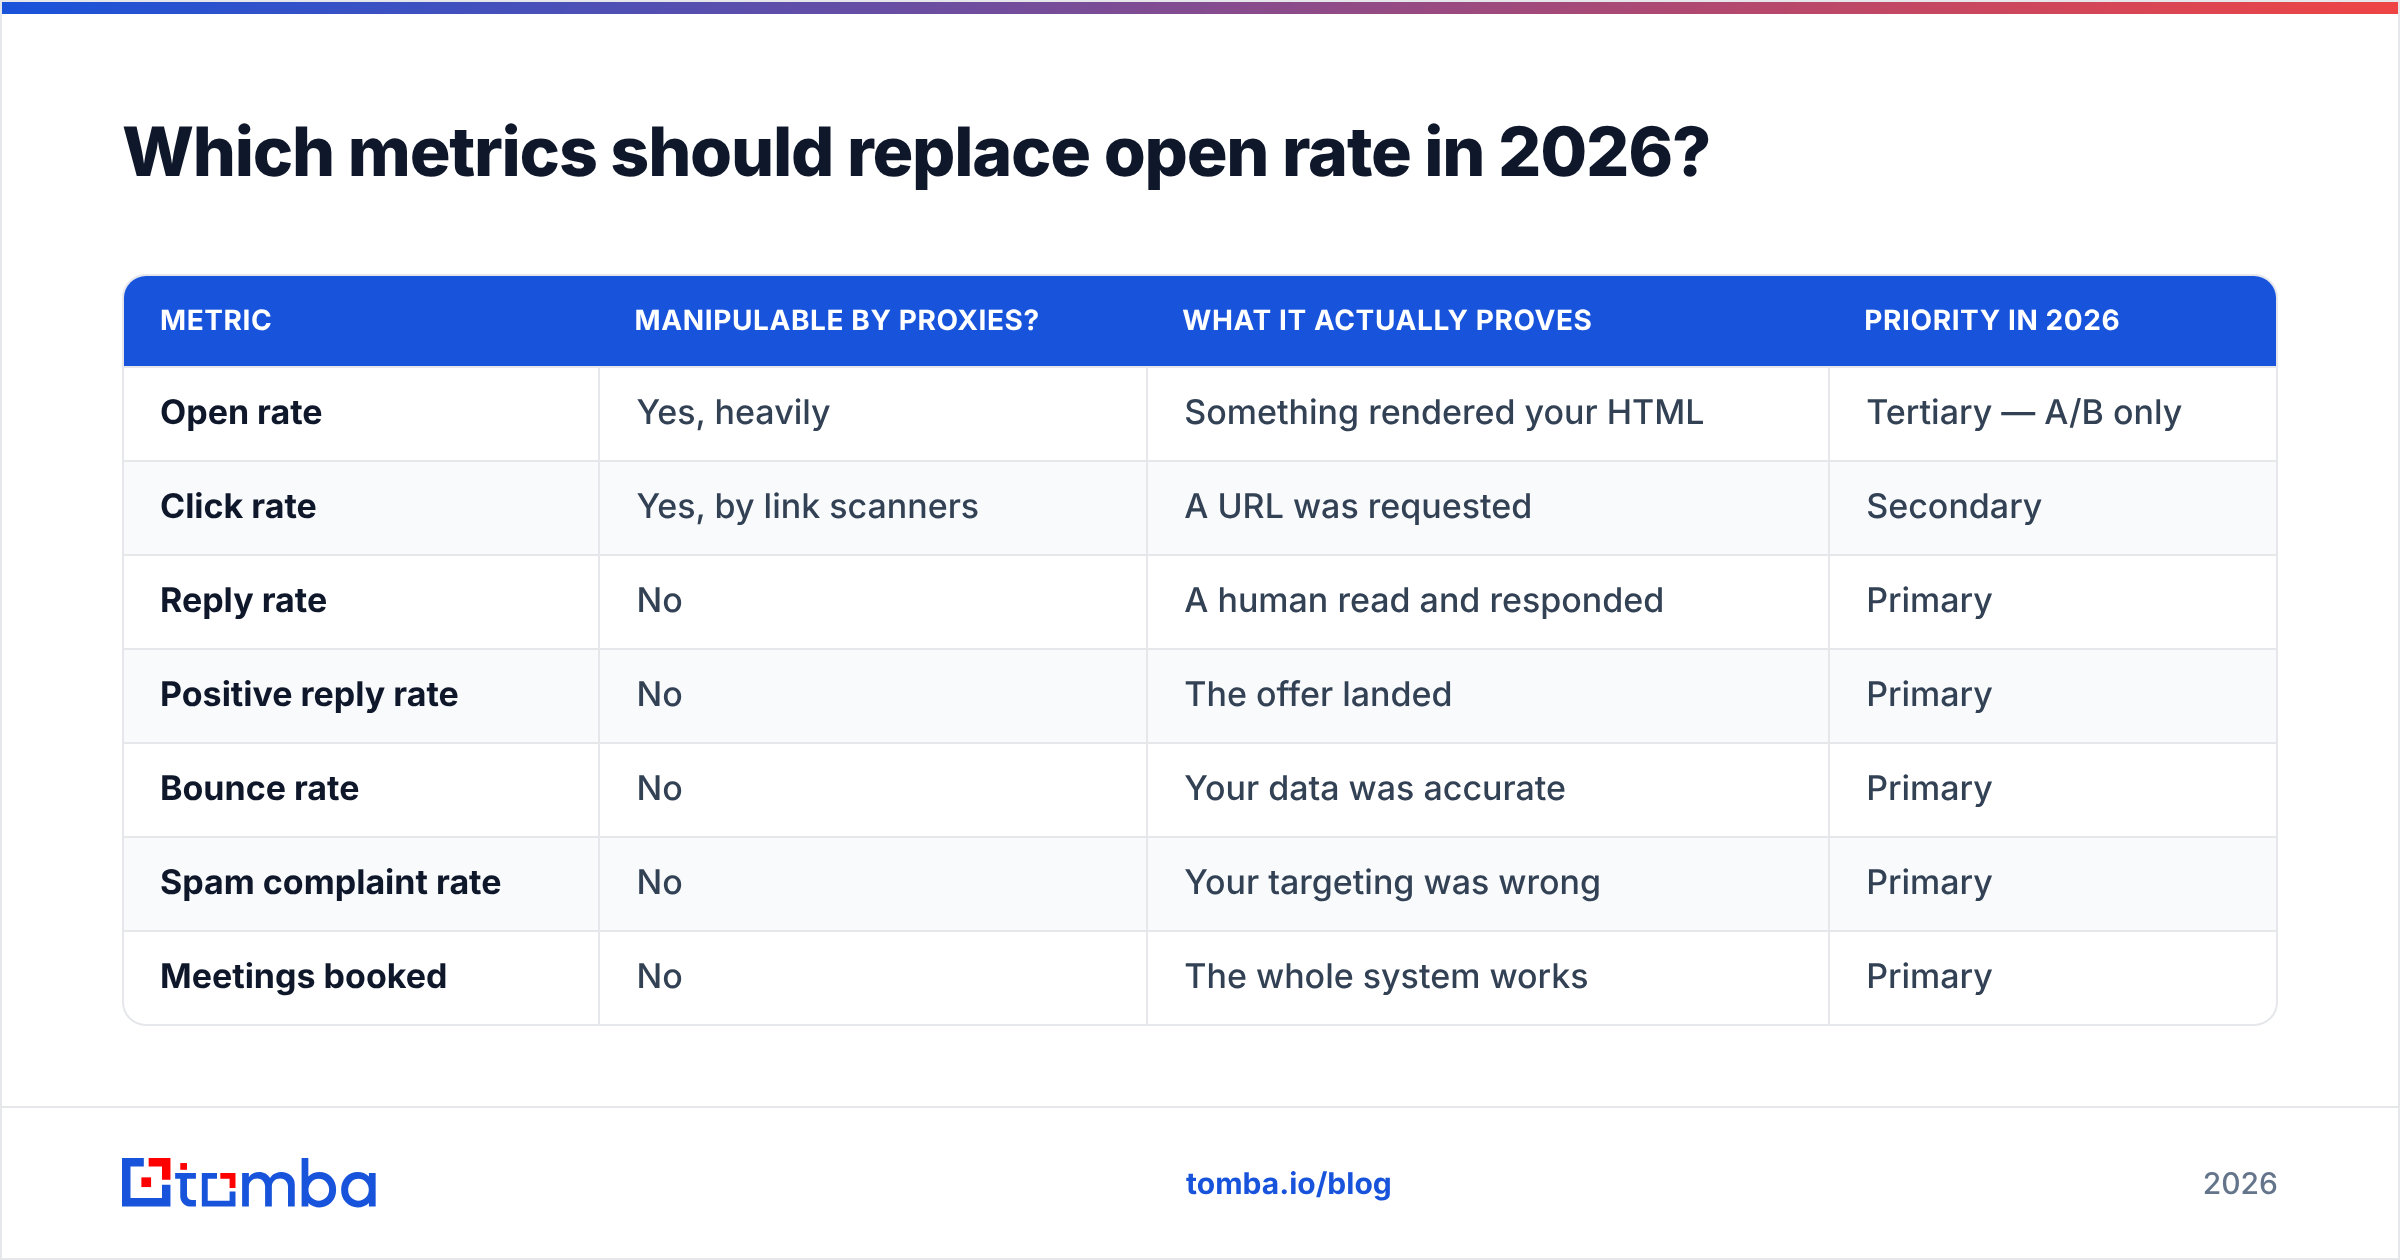
Here is how the old dashboard maps to the new one:
| Metric | Manipulable by proxies? | What it actually proves | Priority in 2026 |
|---|---|---|---|
| Open rate | Yes, heavily | Something rendered your HTML | Tertiary — A/B only |
| Click rate | Yes, by link scanners | A URL was requested | Secondary |
| Reply rate | No | A human read and responded | Primary |
| Positive reply rate | No | The offer landed | Primary |
| Bounce rate | No | Your data was accurate | Primary |
| Spam complaint rate | No | Your targeting was wrong | Primary |
| Meetings booked | No | The whole system works | Primary |
Is email open rate tracking still worth using at all?#
Yes — narrowly. Open rate retains value in exactly one situation: comparing two variants within the same list segment, sent in the same window.
Proxy inflation applies roughly equally to both variants. If subject line A reports 54% and subject line B reports 71% across a randomized split of the same 2,000 contacts, the delta is real even though neither absolute number is. The noise is a constant; you are measuring the difference.
What you cannot do:
- Compare your open rate to an industry benchmark. Different list composition, different inflation.
- Compare this quarter to two years ago. Client market share shifted underneath you.
- Use open rate as a lead-scoring input. You will score security scanners as hot prospects.
- Use "opened but didn't reply" as a follow-up trigger. Most of those people never saw it.
One more caveat that gets overlooked: tracking pixels are themselves a deliverability liability in cold outbound. The pixel adds a remote image hosted on a shared tracking domain that thousands of other senders also use. Spam filters weight domain reputation, and a shared tracking domain with poor neighbors is a real signal. If you send cold, either use a custom tracking domain on a subdomain you control, or turn open tracking off entirely and rely on replies.
If you are unsure how your current template scores, run it through a spam checker before you scale the send. It takes ninety seconds and catches the obvious problems — image-to-text ratio, spam-trigger phrases, missing plain-text alternative.

How do you set up open tracking without wrecking deliverability?#
If you keep open tracking, do it carefully. The setup below is the version that survives scrutiny:
Use a custom tracking domain. Set up link.yourdomain.com or t.yourdomain.com as a CNAME pointing at your sending platform. Your pixel and click URLs then carry your own reputation instead of a shared pool's. Every serious platform supports this; if yours does not, that tells you something.
Warm the domain before you scale. A brand-new tracking subdomain with sudden high volume is a pattern filters recognize. Ramp over 2-4 weeks. A warmup calculator will give you a realistic daily ramp rather than a guess.
Authenticate properly. SPF, DKIM, and DMARC are table stakes since the 2024 Google and Yahoo bulk-sender requirements. Missing DMARC does more damage to your open rate than any pixel decision, because unauthenticated mail does not reach the inbox to be opened. HubSpot's ongoing marketing statistics research is a reasonable place to sanity-check where inbox placement benchmarks sit.
Filter machine opens in your reporting. Most platforms now offer an "exclude Apple MPP" or "machine open" filter. Turn it on. It will not be perfect — it typically works off user-agent and timing heuristics — but a filtered number beats an unfiltered one. Expect your reported open rate to drop 20-40 points. That drop is the truth arriving, not a performance regression.
Suppress opens from your alerting. No Slack notifications on open. No task creation on open. Reps should be triggered by replies and by intent signals that come from your own site, not from a pixel request that a sandbox generated.
What causes bad tracking data before the email even sends?#
The uncomfortable answer: your list.
Open rate is calculated on delivered emails. If your delivery denominator is polluted with invalid addresses, catch-all domains that accept everything and route nothing, and role accounts nobody reads, then every downstream percentage is computed on sand.
Three failure modes, in order of frequency:
- Invalid addresses inflate bounces, suppress delivery, and pull your domain reputation down. Every bounce is a strike with the mailbox provider.
- Catch-all domains accept every message at the SMTP level, so a naive verifier marks them "valid." They may route to a black hole. A dedicated catch-all verifier applies deeper checks rather than trusting the SMTP handshake.
- Guessed patterns. Generating
first.last@company.comfrom a permutator and sending without confirmation is how teams end up at 15% bounce rates. Pattern generation is a hypothesis; verification is the test.
The fix is boring and it works: source addresses from a system that confirms them, verify in bulk before every send, and re-verify anything older than 90 days. B2B contact data decays at roughly 2-3% per month as people change jobs. A list you built in January is measurably worse in June. If you are sourcing at volume, a bulk email finder that verifies as it finds removes an entire manual step from the process.
What open and reply rates are realistic in 2026?#
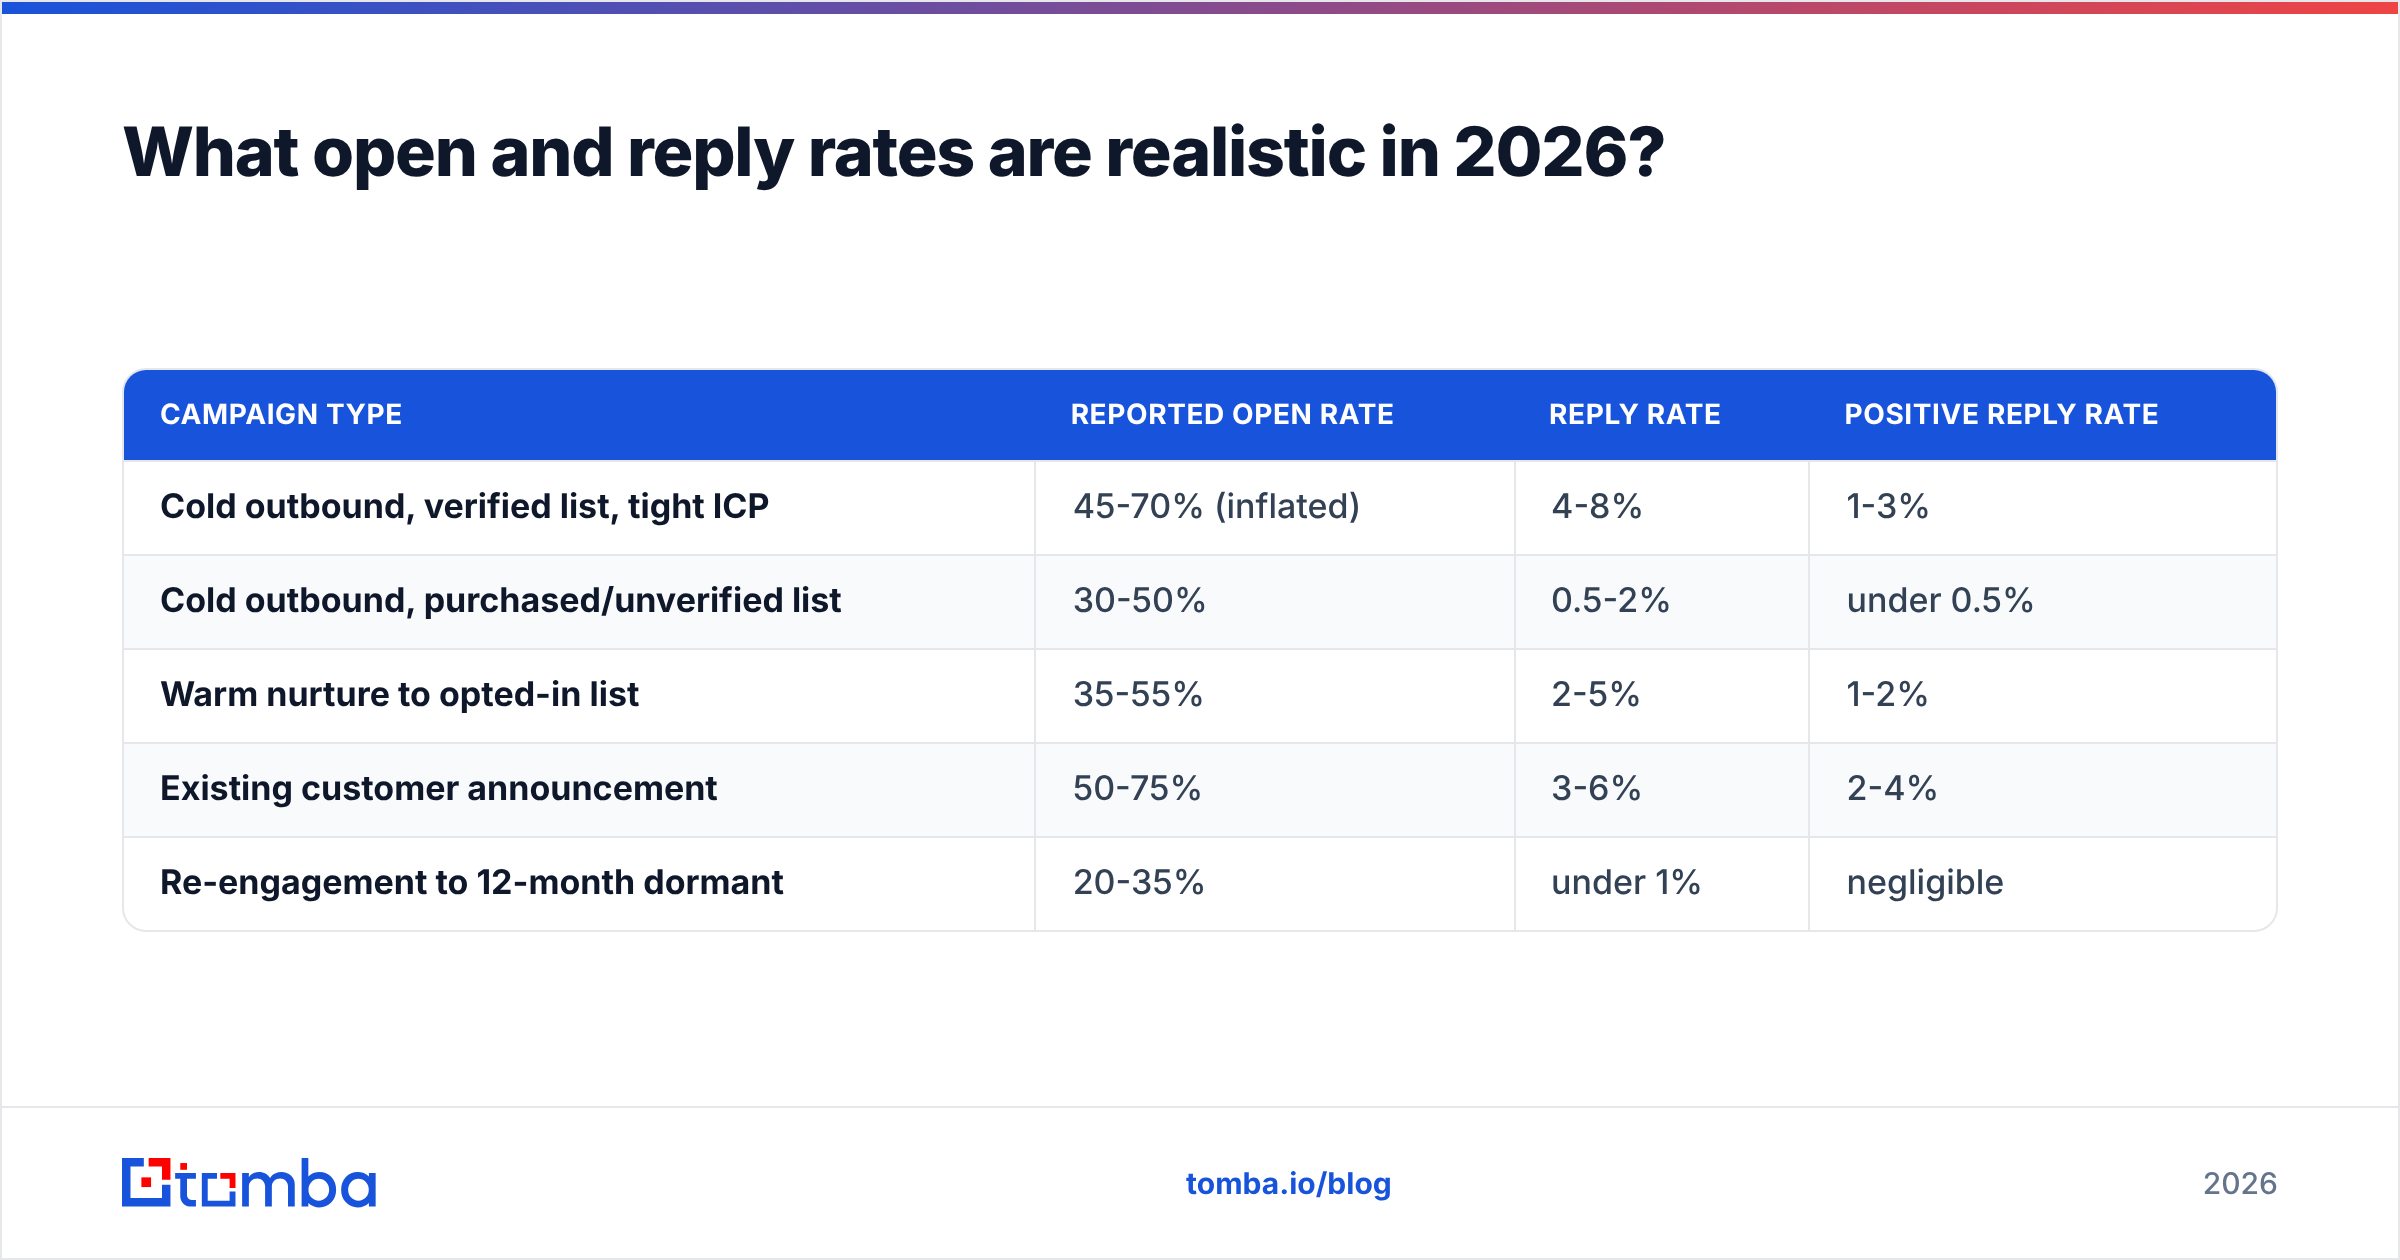
Treat these as orientation, not targets. Your segment, offer, and list quality move them more than any tactic.
| Campaign type | Reported open rate | Reply rate | Positive reply rate |
|---|---|---|---|
| Cold outbound, verified list, tight ICP | 45-70% (inflated) | 4-8% | 1-3% |
| Cold outbound, purchased/unverified list | 30-50% | 0.5-2% | under 0.5% |
| Warm nurture to opted-in list | 35-55% | 2-5% | 1-2% |
| Existing customer announcement | 50-75% | 3-6% | 2-4% |
| Re-engagement to 12-month dormant | 20-35% | under 1% | negligible |
Notice the pattern: open rate barely separates a great campaign from a terrible one — the cold outbound rows differ by 15 points. Reply rate separates them by a factor of four to eight. That is why the reporting priority has to shift.
If your reply rate sits below 1% on a verified list with a defined ICP, the problem is the message or the targeting, not the tracking. Rewriting the subject line to chase opens will not move it.
How should you rebuild your reporting this quarter?#
A pragmatic sequence you can run in two weeks:
- Audit the denominator. Export your last 90 days of sends. Calculate real bounce rate and identify how much of your list was never verified. Fix this first — everything else is downstream.
- Turn on machine-open filtering in your sending platform and re-baseline. Accept the lower numbers.
- Demote open rate to a secondary panel on your dashboard, labeled "A/B testing only."
- Instrument positive reply rate. Even a manual tagging pass on replies (interested / not now / no / unsubscribe) for two weeks will tell you more than a year of open data.
- Rewire alerts so reps get pinged on replies and site visits, never on opens.
- Set a spam-complaint alarm at 0.1% so you have room to react before you hit the 0.3% enforcement line.
The teams that made this shift did not lose visibility. They lost a comforting number and gained an accurate one — and most of them found their pipeline forecasts got more reliable within a quarter.
Where should you start?#
Start with the data, because tracking accuracy is a downstream problem and list accuracy is the upstream one. No amount of pixel tuning fixes a list where one in eight addresses does not exist.
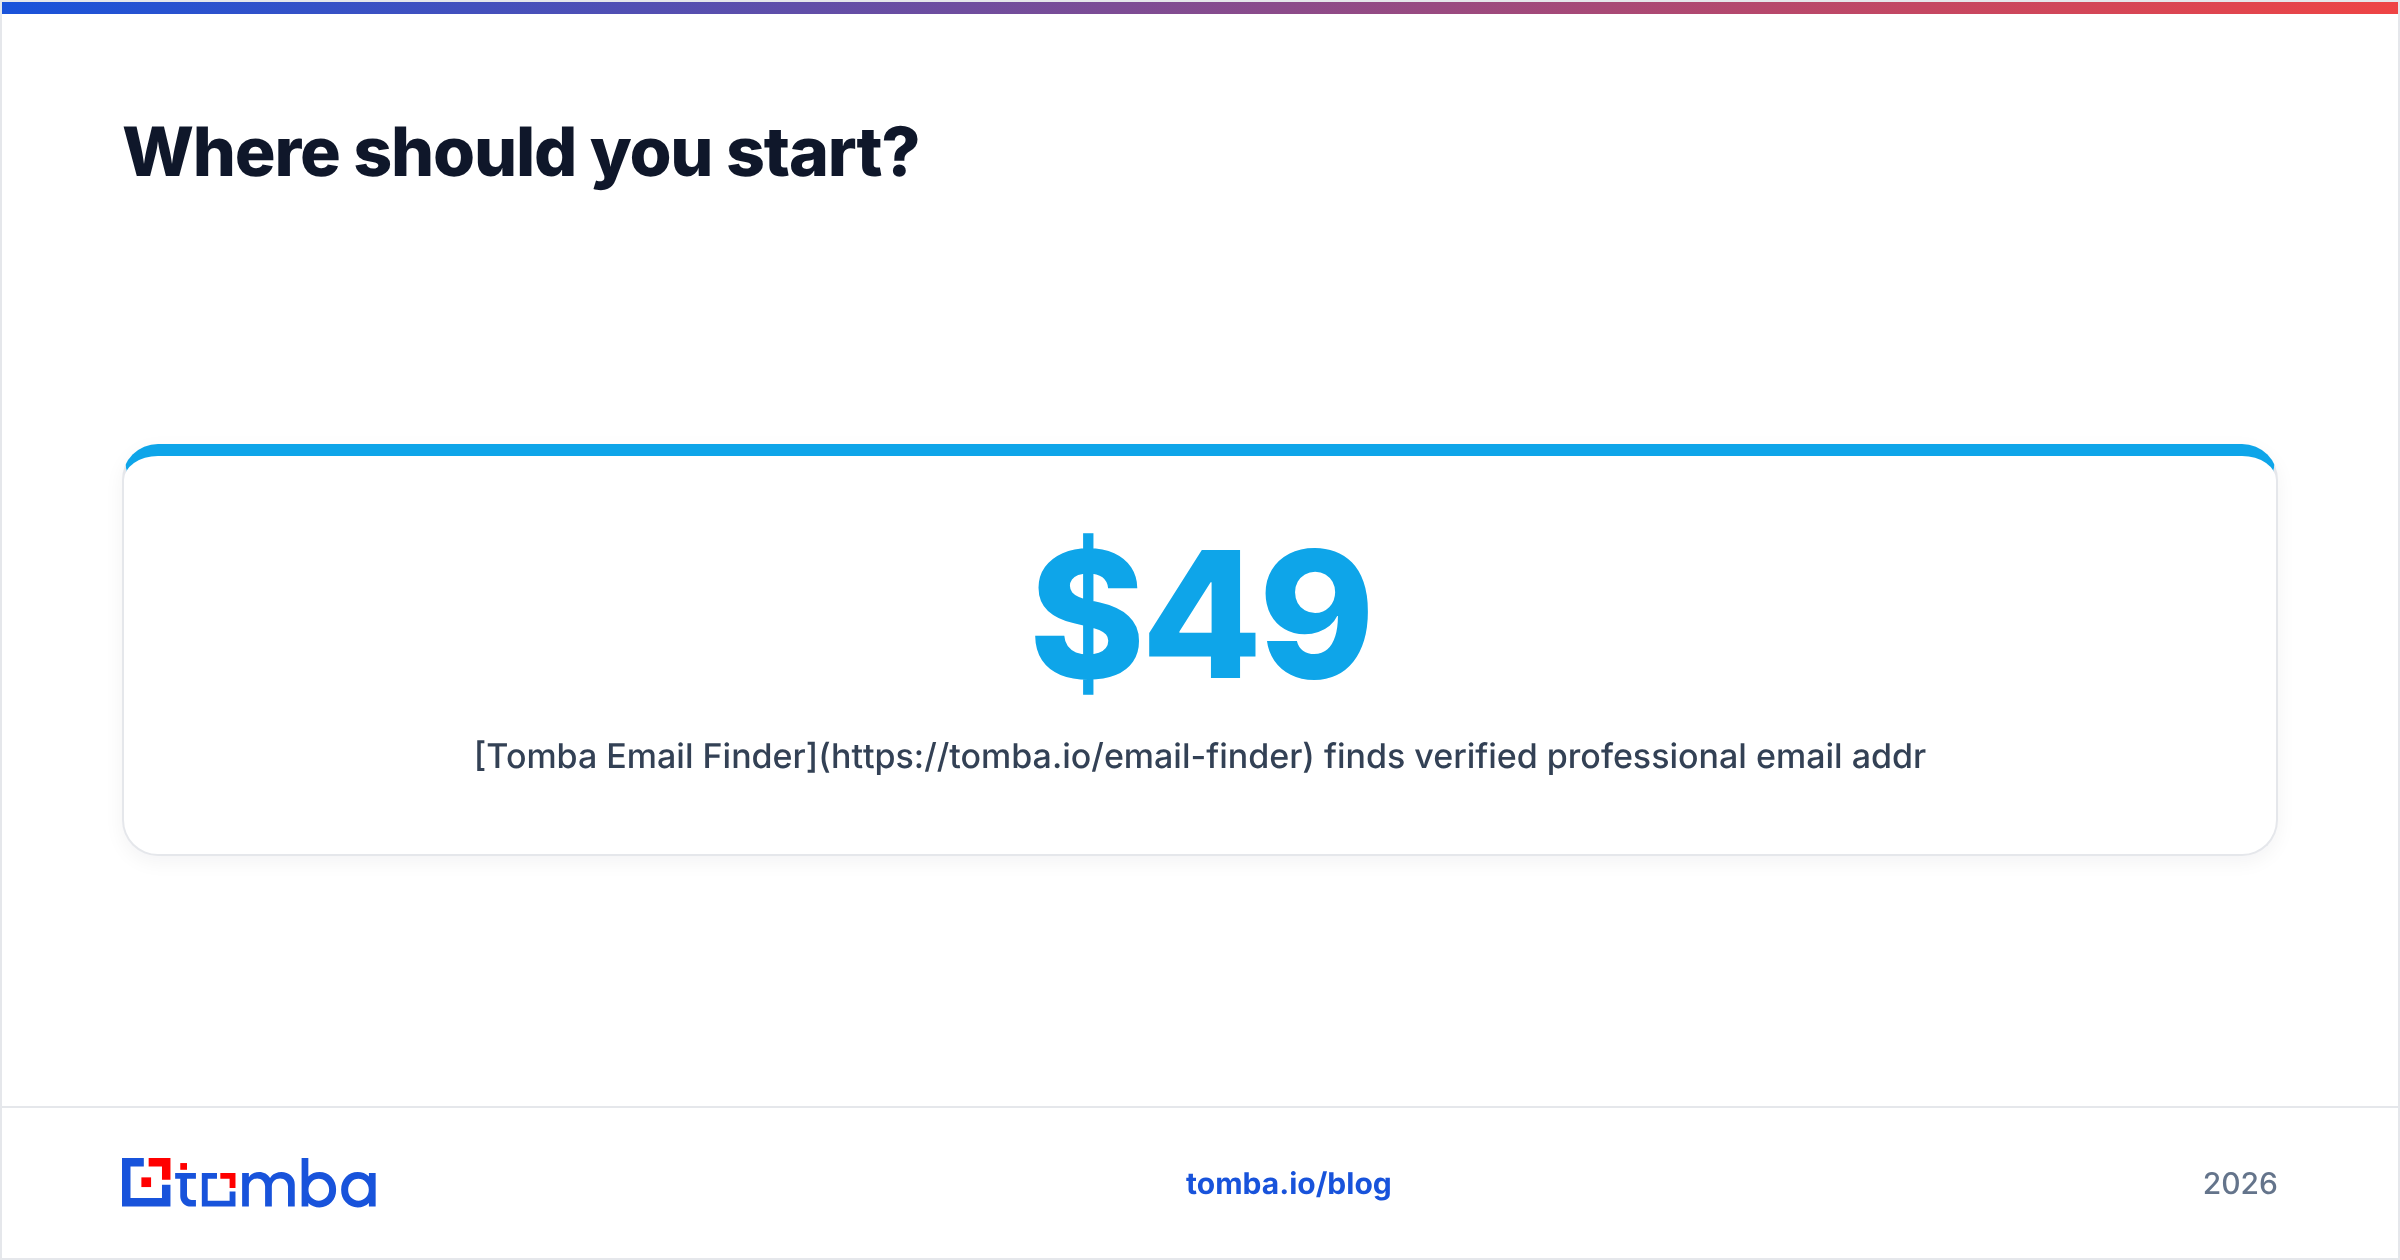
Tomba Email Finder finds verified professional email addresses by domain, name, or company, with verification built into the lookup rather than bolted on afterward — so the addresses entering your sequences are ones that actually resolve. The free tier gives you 25 searches a month to test the accuracy against a list you already know; paid plans start at $49/mo on Starter, $99/mo on Growth, and $249/mo on Pro. Full Tomba pricing is public, and everything is available through the Tomba API if you want verification running inside your own enrichment pipeline.
Get the denominator right, and every metric above it starts telling you the truth.
Related guides#
Ready to find emails that actually work?
Join 150,000+ professionals who stopped guessing and started sending. Free credits on signup — no credit card required.
Get the Tomba newsletter
Practical outbound tactics and product updates — once every two weeks.
About the author