Email Outreach ROI: How to Measure and Improve It in 2026
Most teams report email outreach ROI on the wrong denominator — and end up scaling the campaigns that lose money. Here is the full cost stack, the real funnel math, and the three levers that actually move the number.
TL;DR
- Email outreach ROI is
(pipeline value × close rate − total campaign cost) ÷ total campaign cost. Most teams leave 60–80% of the cost side out, which makes losing campaigns look profitable. - Your real cost stack is data + sending infrastructure + tooling + rep hours. Rep hours are usually the biggest line and almost never get counted.
- Bad data is the fastest way to destroy ROI: a 25% bounce rate does not just waste 25% of your list, it damages the domain reputation that determines whether the other 75% lands.
- Targeting beats volume by a wide margin. Doubling list size roughly doubles cost; tightening ICP fit can triple reply rate at flat cost.
- Track four numbers weekly — deliverable rate, reply rate, meeting rate, cost per meeting. Everything else is decoration.
What is email outreach ROI, exactly?#
Email outreach ROI is the revenue your outbound email program generates divided by everything it cost you to generate it, expressed as a ratio or percentage. That's the textbook return on investment definition applied to a channel where the inputs are unusually easy to under-report.
The formula looks harmless:
ROI = (Revenue Generated − Total Cost) ÷ Total Cost × 100The trouble is that "Total Cost" in most outbound dashboards means one thing: the sending tool subscription. Somebody pays $97/month for a sequencer, closes $40,000 of pipeline, and reports a 41,137% ROI in the QBR deck. That number is fiction. It ignores the two SDRs who spent 340 combined hours building lists, the data vendor bill, the four burner domains, the inbox warmup service, and the deals that came from referrals but got attributed to the sequence because a prospect happened to open an email in the window.
A defensible email outreach ROI calculation is boring and pessimistic. It counts everything, attributes conservatively, and reports per-cohort rather than in aggregate.
How do you calculate email outreach ROI properly?#
Build the cost side first, then the revenue side. In that order — because if you build revenue first you will unconsciously trim costs until the ratio looks good.
- Data acquisition cost. Credits burned on finding and verifying contacts, plus any list purchases. Count credits spent on records you didn't use — a 40% waste rate on prospecting is normal and it's still money.
- Sending infrastructure. Secondary domains, mailbox seats, warmup services, SPF/DKIM/DMARC setup time. A ten-domain, thirty-mailbox setup runs $300–600/month before you send a single email.
- Tooling. Sequencer, CRM seats attributable to outbound, enrichment, any AI copy assistant. Only count the portion actually used for this program.
- Human hours. Fully-loaded cost, not salary. An SDR on $60K base costs roughly $45/hour loaded. If they spend 12 hours a week on list building and personalization, that's $2,160/month of list building alone.
- Opportunity cost of reputation damage. Hard to price, real anyway. If a sloppy campaign gets your primary domain flagged, the recovery cost is weeks of degraded inbox placement across every email your company sends.
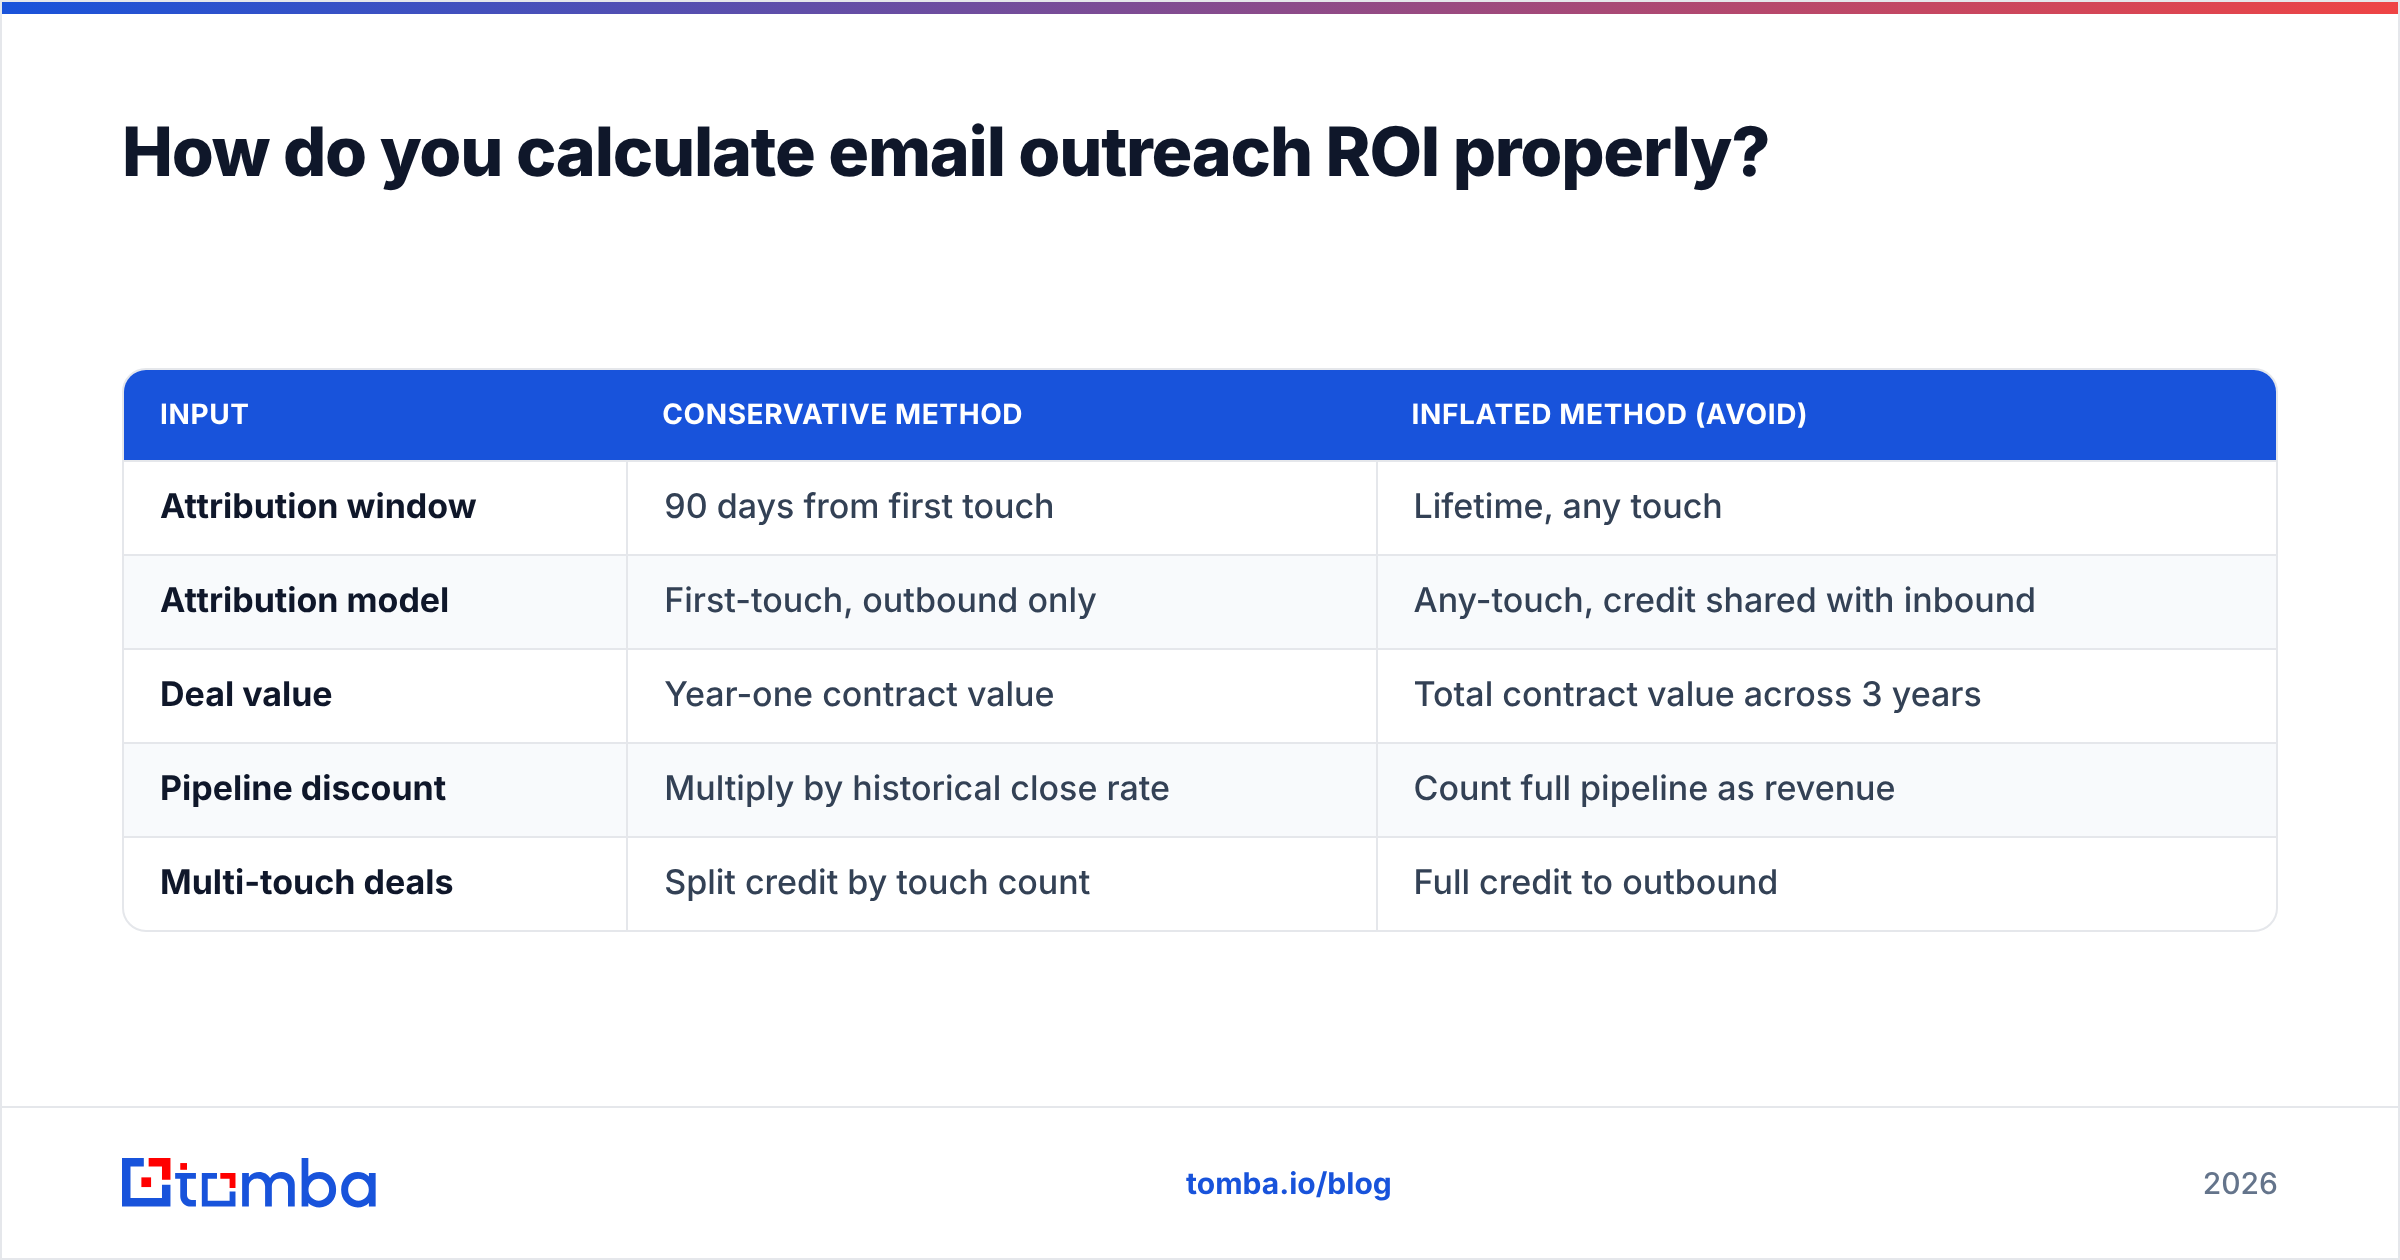
Now the revenue side. Use closed-won revenue where you have it and a discounted pipeline figure where you don't:
| Input | Conservative method | Inflated method (avoid) |
|---|---|---|
| Attribution window | 90 days from first touch | Lifetime, any touch |
| Attribution model | First-touch, outbound only | Any-touch, credit shared with inbound |
| Deal value | Year-one contract value | Total contract value across 3 years |
| Pipeline discount | Multiply by historical close rate | Count full pipeline as revenue |
| Multi-touch deals | Split credit by touch count | Full credit to outbound |
Run both versions if you like. Report the conservative one. The gap between them is the size of the lie your team would otherwise be telling itself.
What does a realistic outreach funnel look like in 2026?#
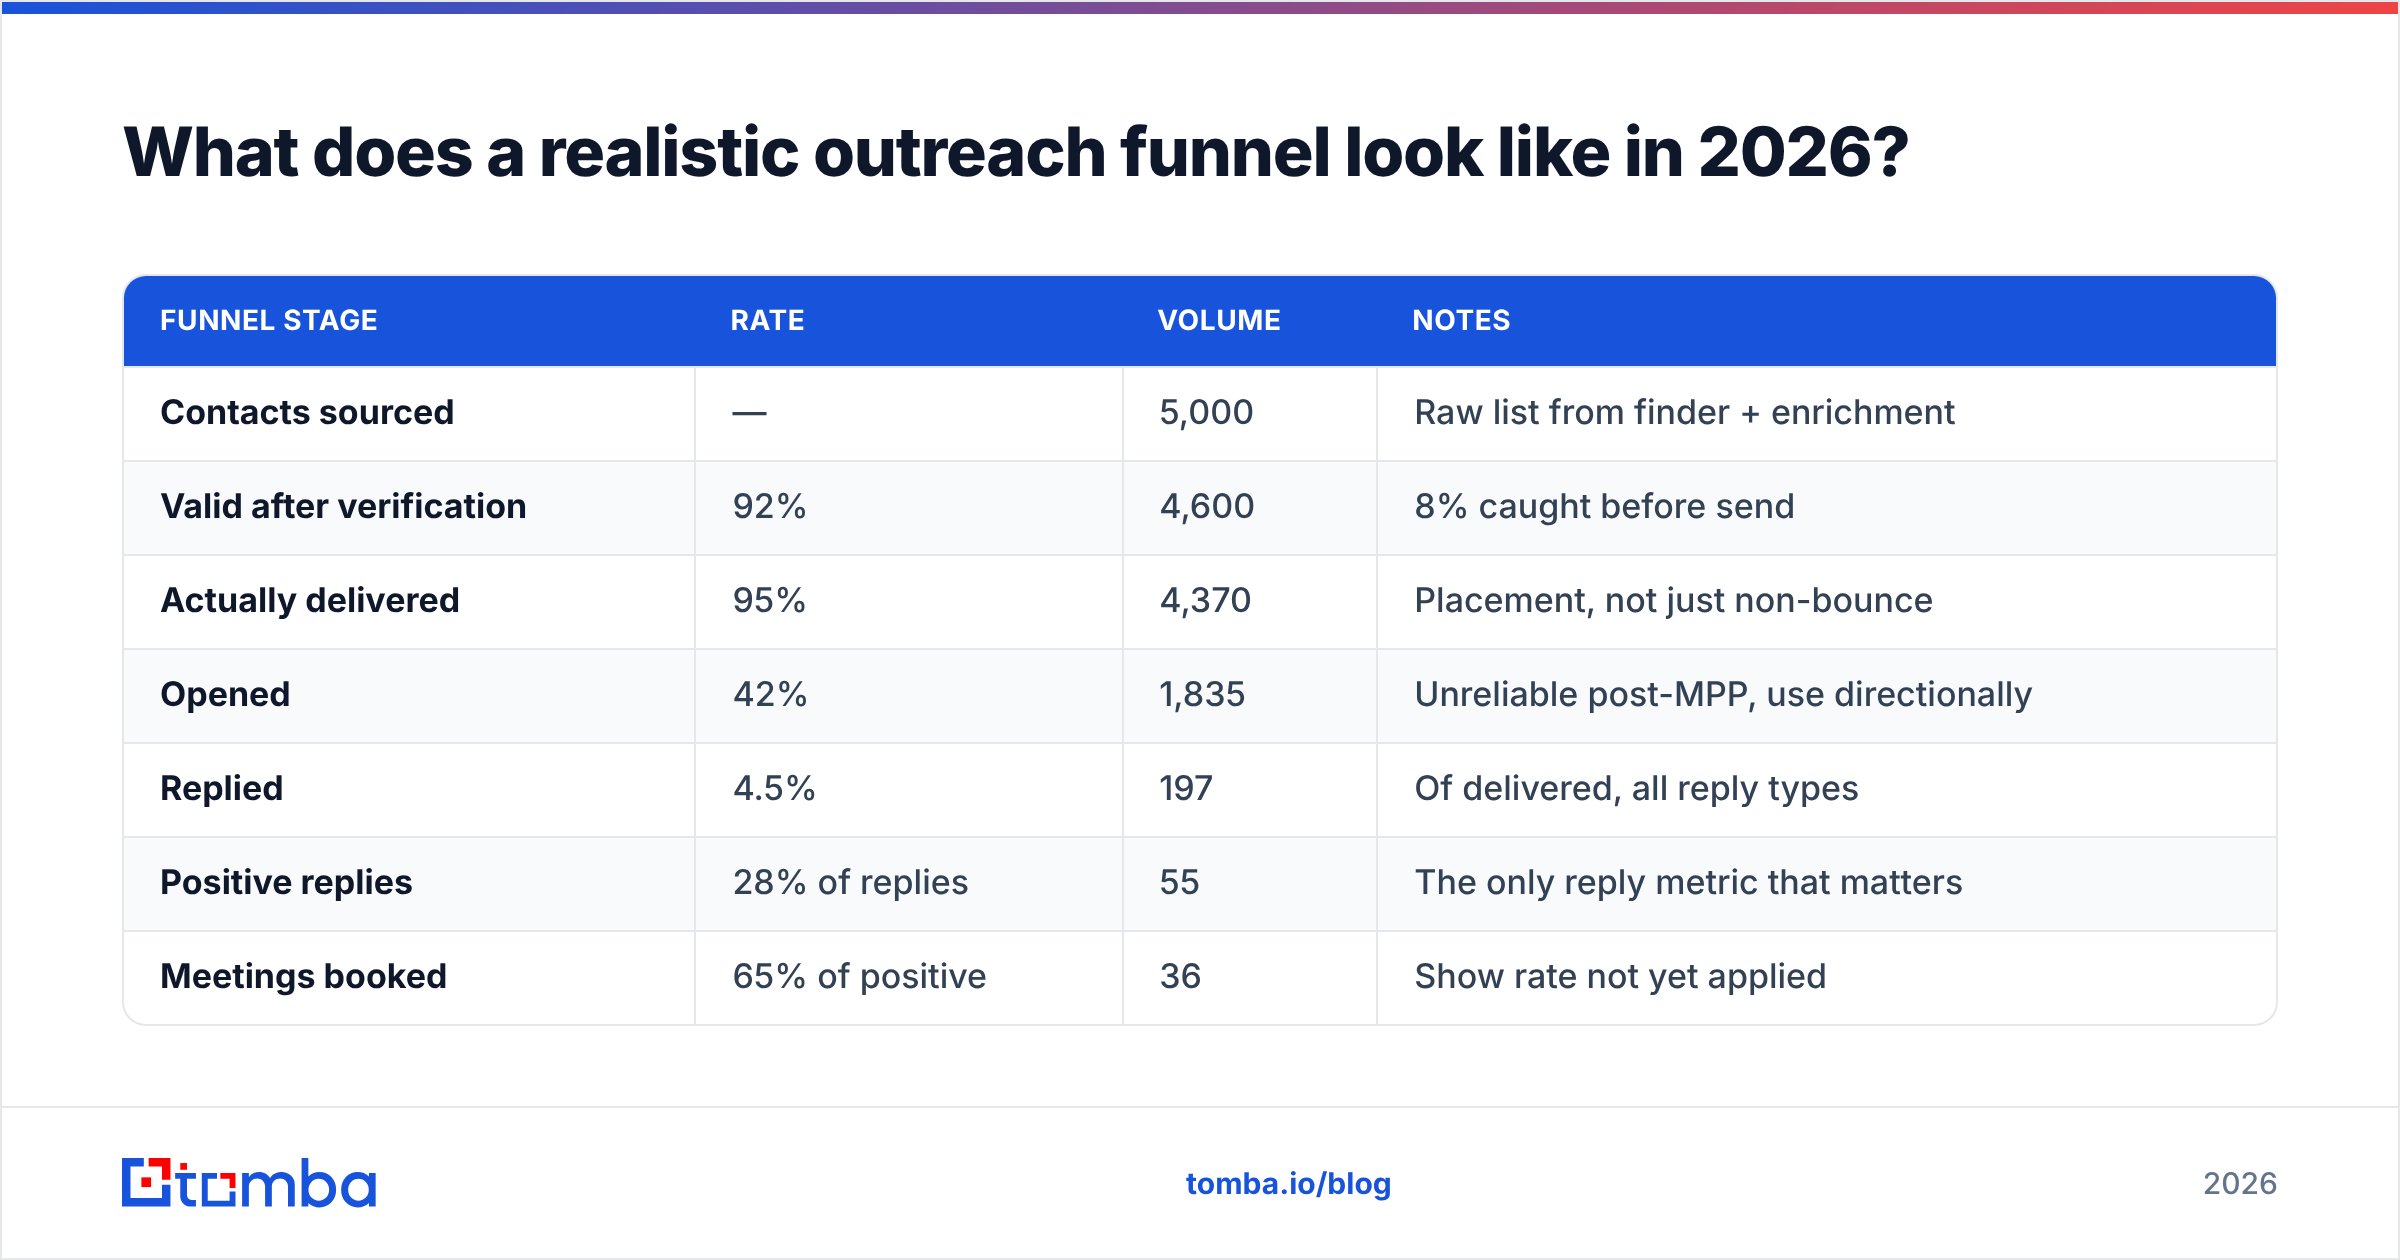
Here is a worked example for a 5,000-contact quarterly campaign selling a $12,000 ACV product. These conversion rates sit in the range most B2B teams see once you strip out the vendor case studies — HubSpot's sales statistics roundup is a reasonable sanity check on the top of the funnel.
| Funnel stage | Rate | Volume | Notes |
|---|---|---|---|
| Contacts sourced | — | 5,000 | Raw list from finder + enrichment |
| Valid after verification | 92% | 4,600 | 8% caught before send |
| Actually delivered | 95% | 4,370 | Placement, not just non-bounce |
| Opened | 42% | 1,835 | Unreliable post-MPP, use directionally |
| Replied | 4.5% | 197 | Of delivered, all reply types |
| Positive replies | 28% of replies | 55 | The only reply metric that matters |
| Meetings booked | 65% of positive | 36 | Show rate not yet applied |
| Meetings held | 78% | 28 | No-shows are a real cost |
| Opportunities | 55% | 15 | Qualified past discovery |
| Closed-won | 22% | 3.3 | ~$39,600 year-one revenue |
Against a fully-loaded cost of roughly $14,800 for the quarter (data $1,100, infrastructure $1,500, tooling $1,400, 220 rep hours at $45 = $9,900, misc $900), that's an ROI of 168%. Not a 41,000% miracle. A solid, repeatable, 2.7x return that you can actually forecast against.

Notice which stage does the most damage. Between 5,000 sourced and 4,370 delivered you have already lost 12.6% of your spend. Between delivered and positive reply you lose 98.7%. That second number is where the leverage lives — and it is almost entirely a function of who is on the list, not how clever the copy is.
Why do most email outreach ROI calculations come out wrong?#
Four failure modes, in rough order of frequency.
They count sends, not deliveries. A campaign that "sent 10,000 emails" with a 22% bounce rate reached 7,800 inboxes at best, and realistically fewer once spam-folder placement is accounted for. Cost per delivered email is the honest denominator. If your email deliverability is soft, every downstream metric is inflated.
They ignore the reputation tax. Bounces are not a one-campaign cost. Mailbox providers score sender behavior over rolling windows. A single 20%-bounce blast can suppress your inbox placement for six to eight weeks, which quietly taxes every subsequent campaign in the quarter. That cost lands on campaign #4's ROI report while campaign #1 gets to keep its clean numbers.
They price rep time at zero. This is the big one. Manual list building — LinkedIn tab, guess the email format, check the company site, paste into a sheet — runs 3 to 6 minutes per contact. At 5,000 contacts that's 250 to 500 hours. Nobody puts $20,000 of labor in the campaign cost line, so nobody notices that automating sourcing would have doubled the ROI on its own.
They aggregate across cohorts. One campaign to a perfectly-fit segment returns 600%. Three campaigns to loose lookalike lists return −40% each. Averaged together they look like a modest win, so all four keep running. Segment your ROI reporting by list source and ICP tier or you will keep funding the losers with the winner's returns.

What does bad data actually cost you?#
Concretely: here is the same 5,000-contact campaign run on three data qualities, holding copy, sequence, and rep effort constant.
| Metric | Unverified scraped list | Verified but loose ICP | Verified + tight ICP |
|---|---|---|---|
| Data cost | $180 | $940 | $1,340 |
| Bounce rate | 24% | 3% | 2% |
| Delivered | 3,610 | 4,675 | 4,720 |
| Reply rate (of delivered) | 1.1% | 3.2% | 6.8% |
| Positive replies | 12 | 44 | 112 |
| Meetings held | 5 | 22 | 58 |
| Closed-won (22%) | 0.6 | 2.6 | 6.9 |
| Year-one revenue | $7,200 | $31,200 | $82,800 |
| Total campaign cost | $13,900 | $14,650 | $15,050 |
| ROI | −48% | 113% | 450% |
| Domain reputation after | Damaged | Healthy | Healthy |
The cheap list cost $760 less in data and roughly $75,600 more in foregone revenue. That is the entire argument for verification in one row. Running contacts through an email verifier before send costs cents per record and is the highest-ROI single action available to most outbound teams.
The tight-ICP column is where the real money is, and it is not a data-vendor feature — it is a discipline. Fewer companies, better-fit personas, more research per account. The finder tool just makes it cheap to execute once you have decided who to target.
Which lever moves email outreach ROI the most?#
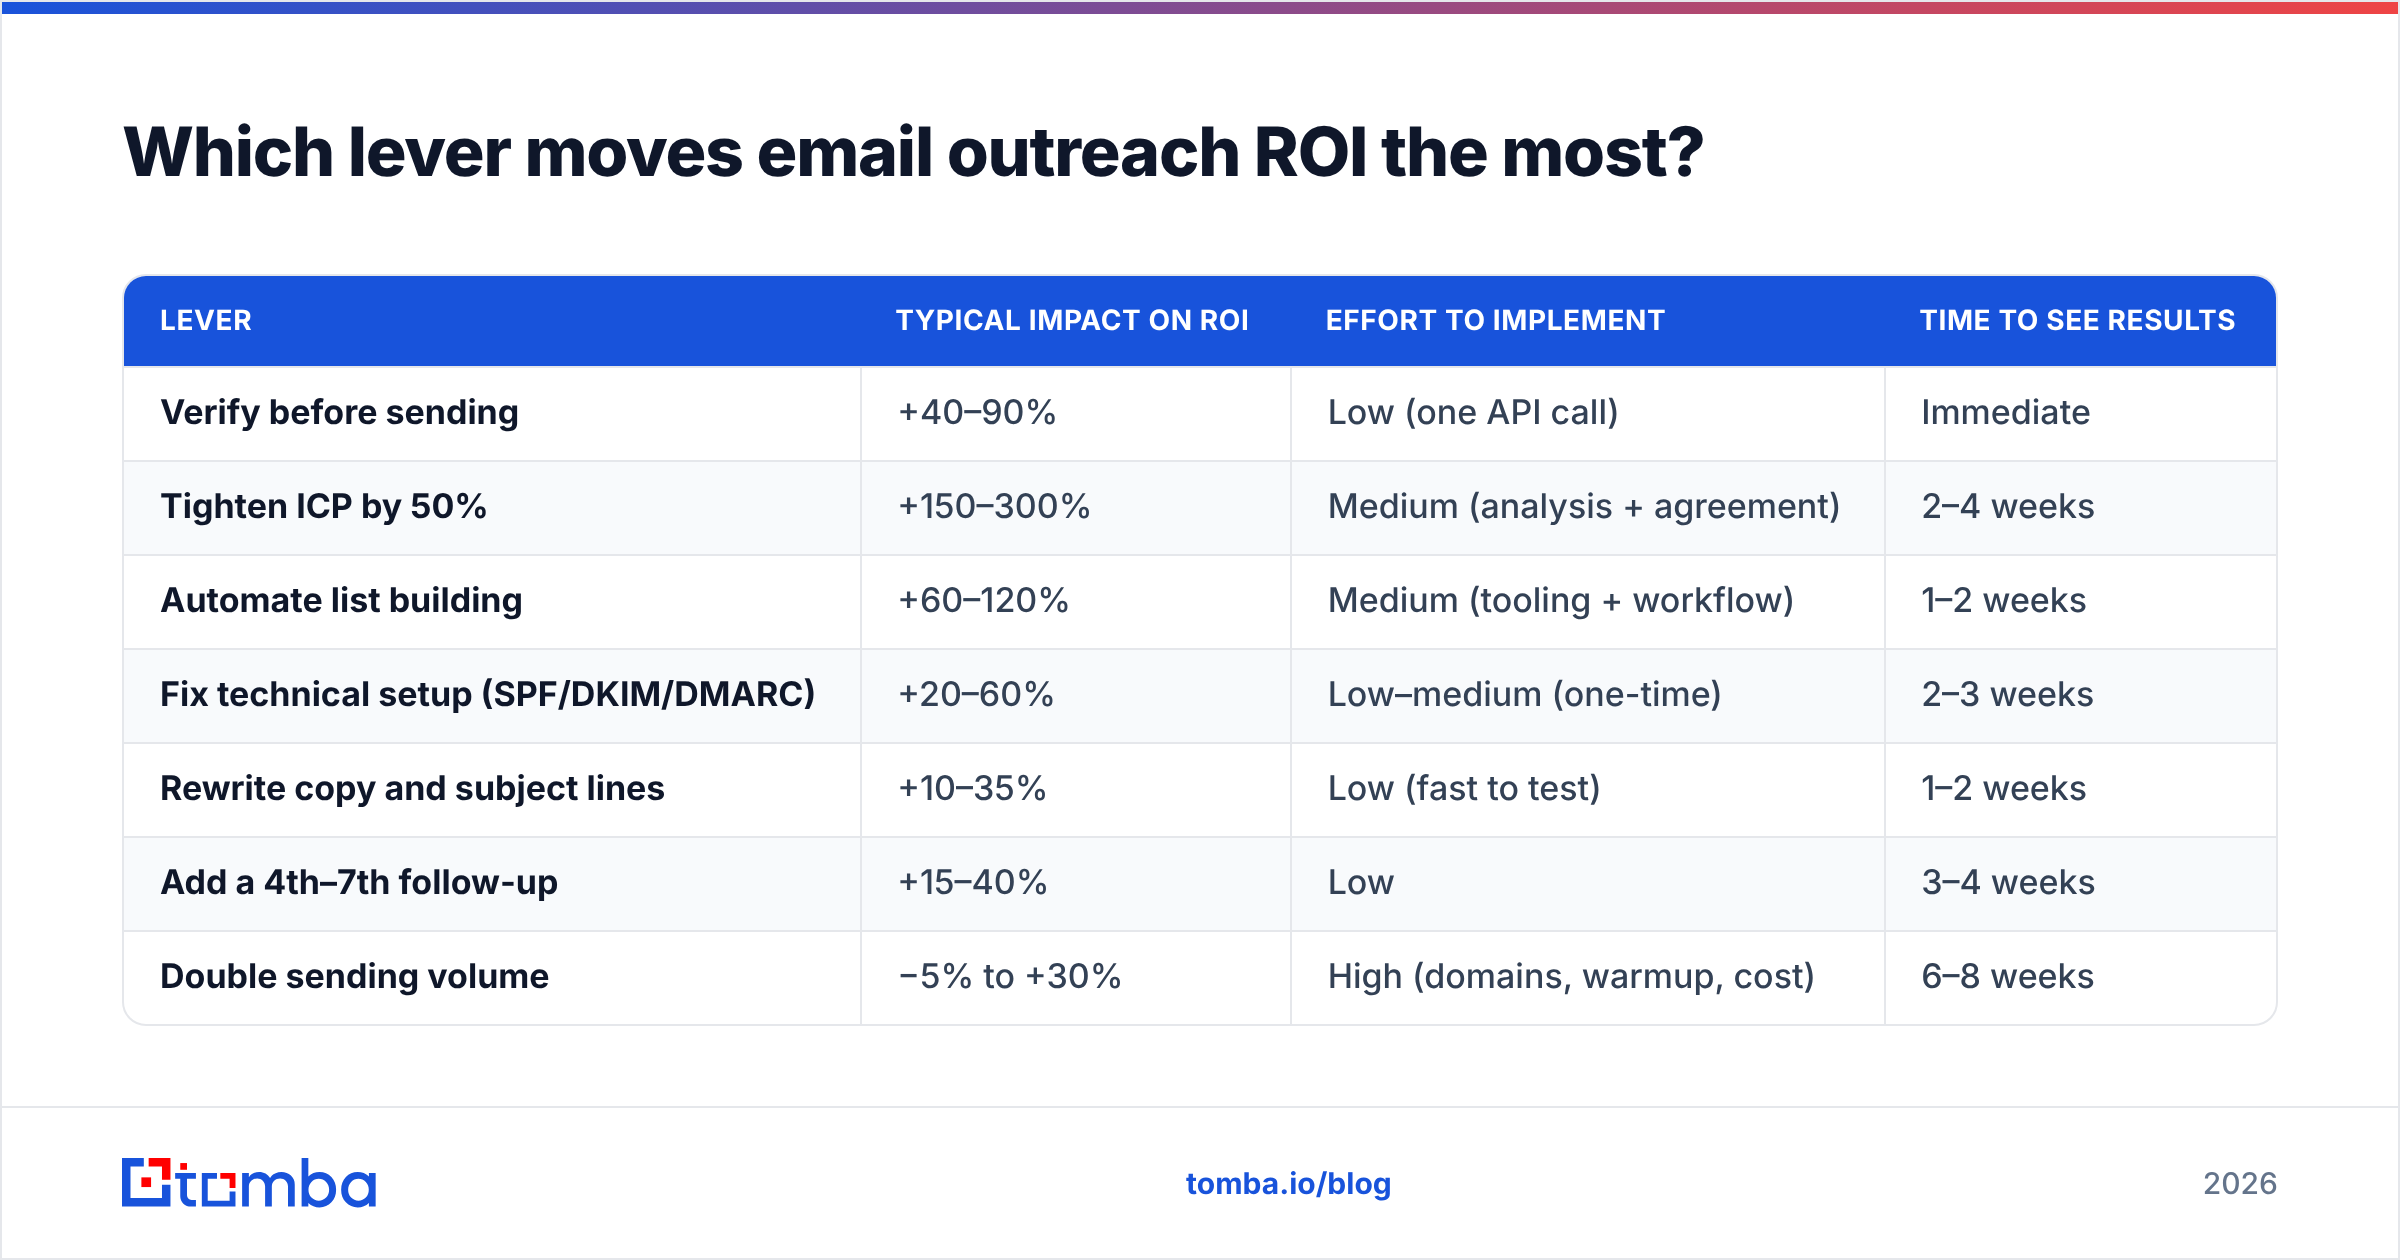
Rank them by return per hour of effort invested:
| Lever | Typical impact on ROI | Effort to implement | Time to see results |
|---|---|---|---|
| Verify before sending | +40–90% | Low (one API call) | Immediate |
| Tighten ICP by 50% | +150–300% | Medium (analysis + agreement) | 2–4 weeks |
| Automate list building | +60–120% | Medium (tooling + workflow) | 1–2 weeks |
| Fix technical setup (SPF/DKIM/DMARC) | +20–60% | Low–medium (one-time) | 2–3 weeks |
| Rewrite copy and subject lines | +10–35% | Low (fast to test) | 1–2 weeks |
| Add a 4th–7th follow-up | +15–40% | Low | 3–4 weeks |
| Double sending volume | −5% to +30% | High (domains, warmup, cost) | 6–8 weeks |
Copy gets the most attention and sits sixth on the list. Volume gets the second-most attention and sits last, sometimes negative — because scaling a program with a 1.1% reply rate just means paying more to be ignored more.
Two structural notes on this table. First, verification and automation compound: automated sourcing produces more contacts per hour, and verification stops that extra volume from becoming extra bounces. Second, the follow-up lever is underrated relative to its cost — most positive replies to cold sequences arrive on touches three through six, so a two-email sequence is leaving roughly half its response rate unclaimed.
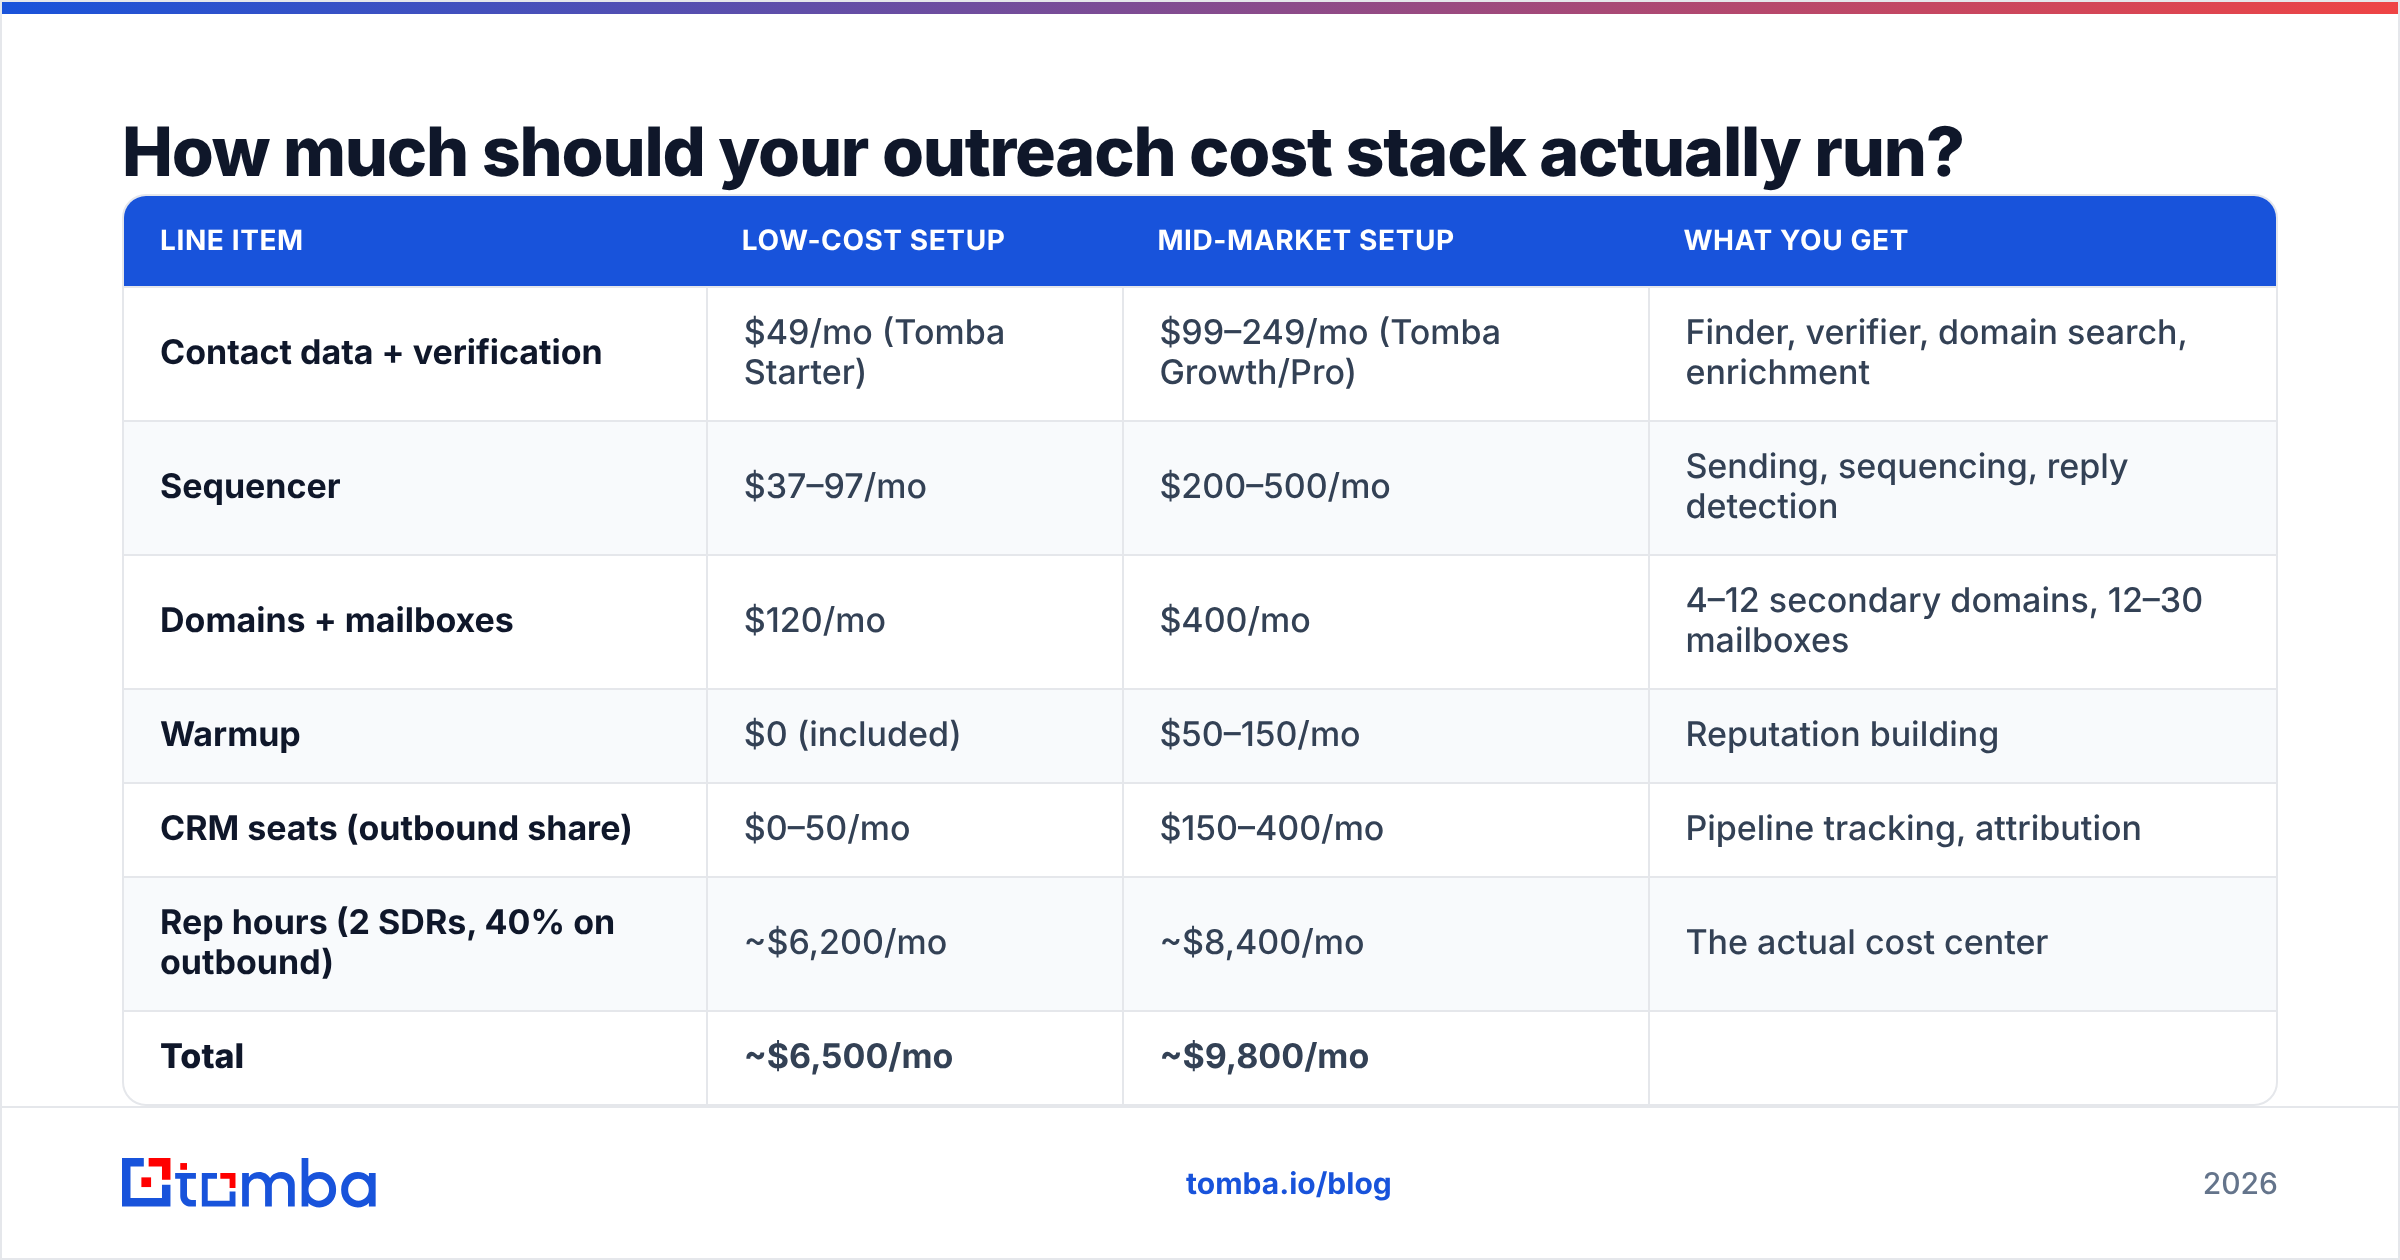
How much should your outreach cost stack actually run?#
For a two-SDR team sending roughly 6,000 emails per month, here is a realistic monthly budget and where the money goes.
| Line item | Low-cost setup | Mid-market setup | What you get |
|---|---|---|---|
| Contact data + verification | $49/mo (Tomba Starter) | $99–249/mo (Tomba Growth/Pro) | Finder, verifier, domain search, enrichment |
| Sequencer | $37–97/mo | $200–500/mo | Sending, sequencing, reply detection |
| Domains + mailboxes | $120/mo | $400/mo | 4–12 secondary domains, 12–30 mailboxes |
| Warmup | $0 (included) | $50–150/mo | Reputation building |
| CRM seats (outbound share) | $0–50/mo | $150–400/mo | Pipeline tracking, attribution |
| Rep hours (2 SDRs, 40% on outbound) | ~$6,200/mo | ~$8,400/mo | The actual cost center |
| Total | ~$6,500/mo | ~$9,800/mo |
Tooling is 4–15% of the stack. Labor is 63–95%. That ratio explains why cutting a $49/month data subscription to save money is almost always the wrong optimization — and why anything that saves a rep two hours a week pays for itself several times over. Tomba's pricing starts free at 25 searches per month, which is enough to validate a workflow before committing budget; the bulk email finder is where the labor savings actually show up, since it turns a day of manual lookups into a CSV upload.
If you buy pre-built lists rather than sourcing your own, vendors like BookYourData occupy a legitimate slot in this stack — the calculus is simply whether their per-record cost beats your loaded cost of finding the same record yourself. Run that comparison on your own numbers; for a lot of teams buying wins on obscure verticals and building wins on core ICP accounts.
For a broader read on where sales-engagement tooling costs are trending, G2's sales engagement category publishes live pricing ranges across a few hundred vendors.
How do you track email outreach ROI without a full RevOps stack?#
You need four numbers and a spreadsheet. Not a dashboard project.
- Deliverable rate = (contacts − hard bounces) ÷ contacts. Target above 97%. Below 95% means your data or your verification step is broken.
- Positive reply rate = positive replies ÷ delivered. Target above 2.5% for cold, above 6% for warm or well-researched lists. This is your single best campaign quality signal.
- Cost per meeting held = total campaign cost ÷ meetings held. Compare against your paid-channel cost per meeting. If outbound is more expensive than paid search, something is wrong with the list, not the channel.
- Pipeline-to-cost ratio = discounted pipeline ÷ total cost. Anything above 3:1 is healthy for a program still finding its footing; mature programs run 6:1 to 10:1.
Log these per campaign, per list source, per week. Kill any cohort that stays under 1:1 for two consecutive cycles instead of "giving it more volume." Volume does not fix a targeting problem — it scales it.
One practical setup note: tag every contact record with its source at import time. If you can't split ROI by where the data came from, you can't tell whether your finder, your enrichment, or your ICP definition is the weak link. A domain search export, a purchased list, and a conference scrape should never sit in the same undifferentiated bucket.
What is a good email outreach ROI benchmark for 2026?#
Use these as rough goalposts, adjusted for your ACV:
| ACV band | Acceptable ROI | Good ROI | Cost per meeting held |
|---|---|---|---|
| Under $5K | 100–150% | 300%+ | $80–150 |
| $5K–$25K | 150–250% | 450%+ | $200–400 |
| $25K–$100K | 200–400% | 700%+ | $500–1,200 |
| Over $100K | 300%+ | 1,000%+ | $1,500–4,000 |
Higher ACV tolerates a higher cost per meeting because a single close pays for the quarter. Lower ACV demands ruthless efficiency — which usually means automation and verification are not optional, they are the entire business model.
If your program is sitting below the "acceptable" column, do not start by rewriting subject lines. Pull the funnel table from earlier, find the stage with the biggest drop relative to benchmark, and fix that. Nine times out of ten it's the contact list.
Where should you start?#
Start with the cheapest fix that compounds: get accurate, verified contacts into the funnel so every downstream metric measures your message instead of your data quality. Tomba's email finder returns verified professional addresses by name and domain, with a free tier at 25 searches per month and Starter at $49/month — enough to run one honest cohort test against your current list source and see the deliverable-rate and reply-rate gap for yourself. Run the comparison on 500 contacts, log the four metrics above, and let the numbers decide where your next outbound dollar goes.
Related guides#
Ready to find emails that actually work?
Join 150,000+ professionals who stopped guessing and started sending. Free credits on signup — no credit card required.
Get the Tomba newsletter
Practical outbound tactics and product updates — once every two weeks.
About the author