Email Performance Metrics: The 12 That Actually Matter
Open rate has been unreliable since Apple MPP. Here are the email performance metrics that still predict pipeline in 2026, with formulas, realistic benchmarks by program type, and the numbers to stop reporting.
TL;DR
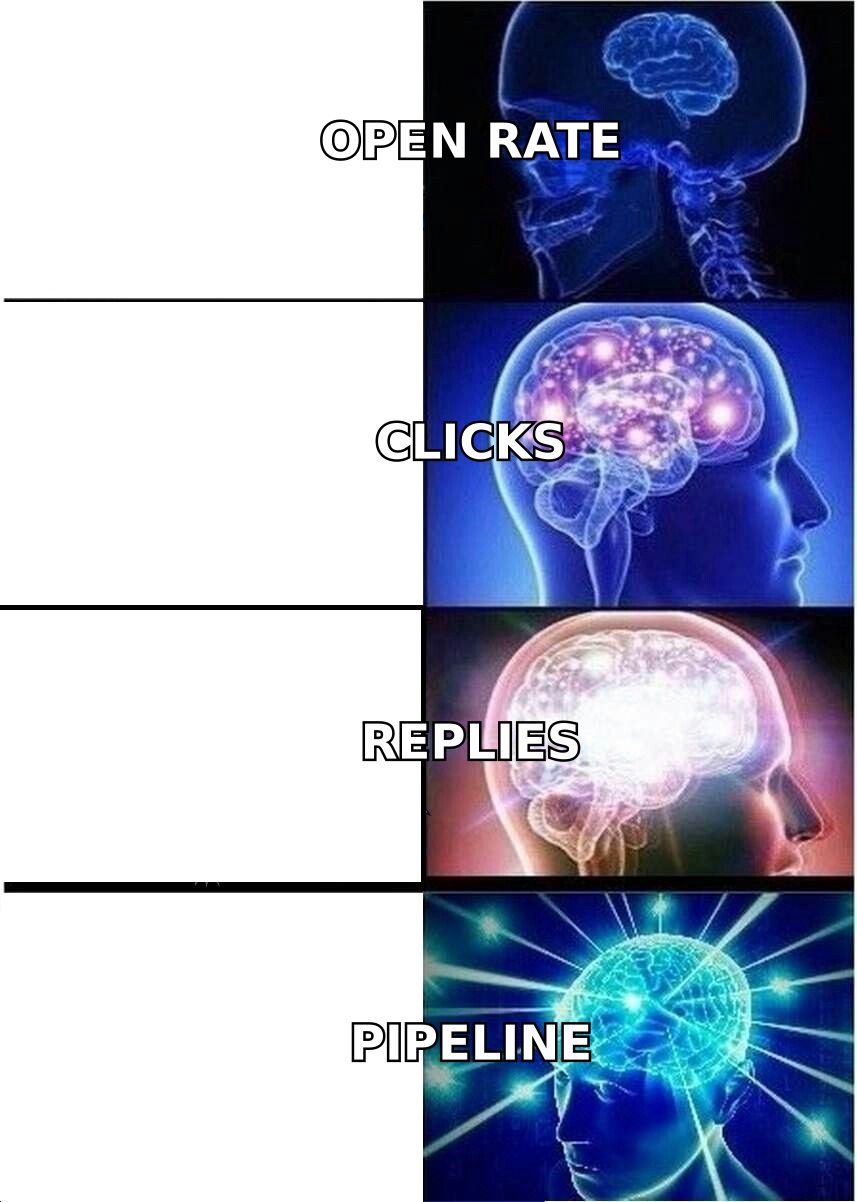
- Open rate stopped being a measurement in 2021 and became a rumor. Apple Mail Privacy Protection pre-fetches images for a large share of your list, so "opens" now include bots, scanners, and people who never looked.
- The metrics that survive scrutiny are the ones tied to a human decision: reply rate, positive reply rate, meetings booked, pipeline created, and revenue per 1,000 sends.
- Bounce rate, spam complaint rate, and unsubscribe rate are not performance metrics — they're safety metrics. Watch them weekly, react at thresholds (bounce under 2%, complaints under 0.1%).
- Benchmarks are meaningless without segmenting by program type. A 3% reply rate is strong for cold outbound and terrible for a warm lifecycle email.
- Half of "bad campaign performance" is actually bad list data. Verify before you send, and re-measure before you rewrite copy.
What are email performance metrics?#
Email performance metrics are the numbers that tell you whether an email program moves people toward a business outcome — not whether the send technically happened.
Think of it like a restaurant. Delivery rate is "did the food leave the kitchen." Open rate is "did someone glance at the plate." Reply rate is "did they eat it." Revenue is "did they come back and pay." Most teams report on the kitchen and wonder why the P&L never moves.
Every email metric falls into one of five layers, and the layers stack. If a lower layer is broken, every number above it is noise:
- Infrastructure metrics — delivery rate, bounce rate, DNS/authentication pass rate. Answers: did the mail server accept it?
- Placement metrics — inbox vs spam placement, Gmail/Outlook tab distribution, spam complaint rate. Answers: did a human ever have the chance to see it?
- Engagement metrics — open rate, click rate, click-to-open rate, unsubscribe rate. Answers: did anything happen after delivery? (Increasingly polluted — see below.)
- Response metrics — reply rate, positive reply rate, meeting booked rate, demo requests. Answers: did a human make a decision?
- Revenue metrics — pipeline created, closed-won attributed to email, revenue per 1,000 sends, cost per meeting. Answers: was any of this worth doing?
The mistake almost every team makes is optimizing layer 3 while reporting it as if it were layer 5. Subject-line A/B tests that lift open rate by four points and change nothing downstream are the classic symptom.
Why is open rate broken in 2026?#
Open rate is measured by a 1x1 tracking pixel. When the recipient's client loads that image, your ESP counts an open. That mechanism has been degrading for five years:
- Apple Mail Privacy Protection pre-loads images on Apple Mail regardless of whether the message was read. Every MPP recipient registers as an open, usually within minutes of delivery.
- Security gateways (Proofpoint, Mimecast, Microsoft Defender) click and load everything in a message to sandbox it. That inflates both opens and clicks.
- Image blocking in corporate Outlook does the reverse: real humans read your email and register nothing.
Net effect: your reported open rate is some unknowable blend of machines that inflate and humans that under-report. Two campaigns showing 48% and 52% are not meaningfully different, and neither number is "the truth."
That doesn't mean you delete the metric. It means you demote it. Open rate is now a directional deliverability signal, not an engagement metric. A sudden drop from 45% to 12% across all campaigns tells you something broke at the placement layer. A four-point difference between subject lines tells you nothing.
The same logic applies to click rate, with a smaller distortion. Filter out clicks that fire within a few seconds of delivery, clicks from the same IP hitting every link in the message, and clicks with no session on your site — those are scanners. Most modern sending platforms have a "filter bot clicks" toggle. Turn it on before you report anything.
Which email performance metrics actually predict revenue?#
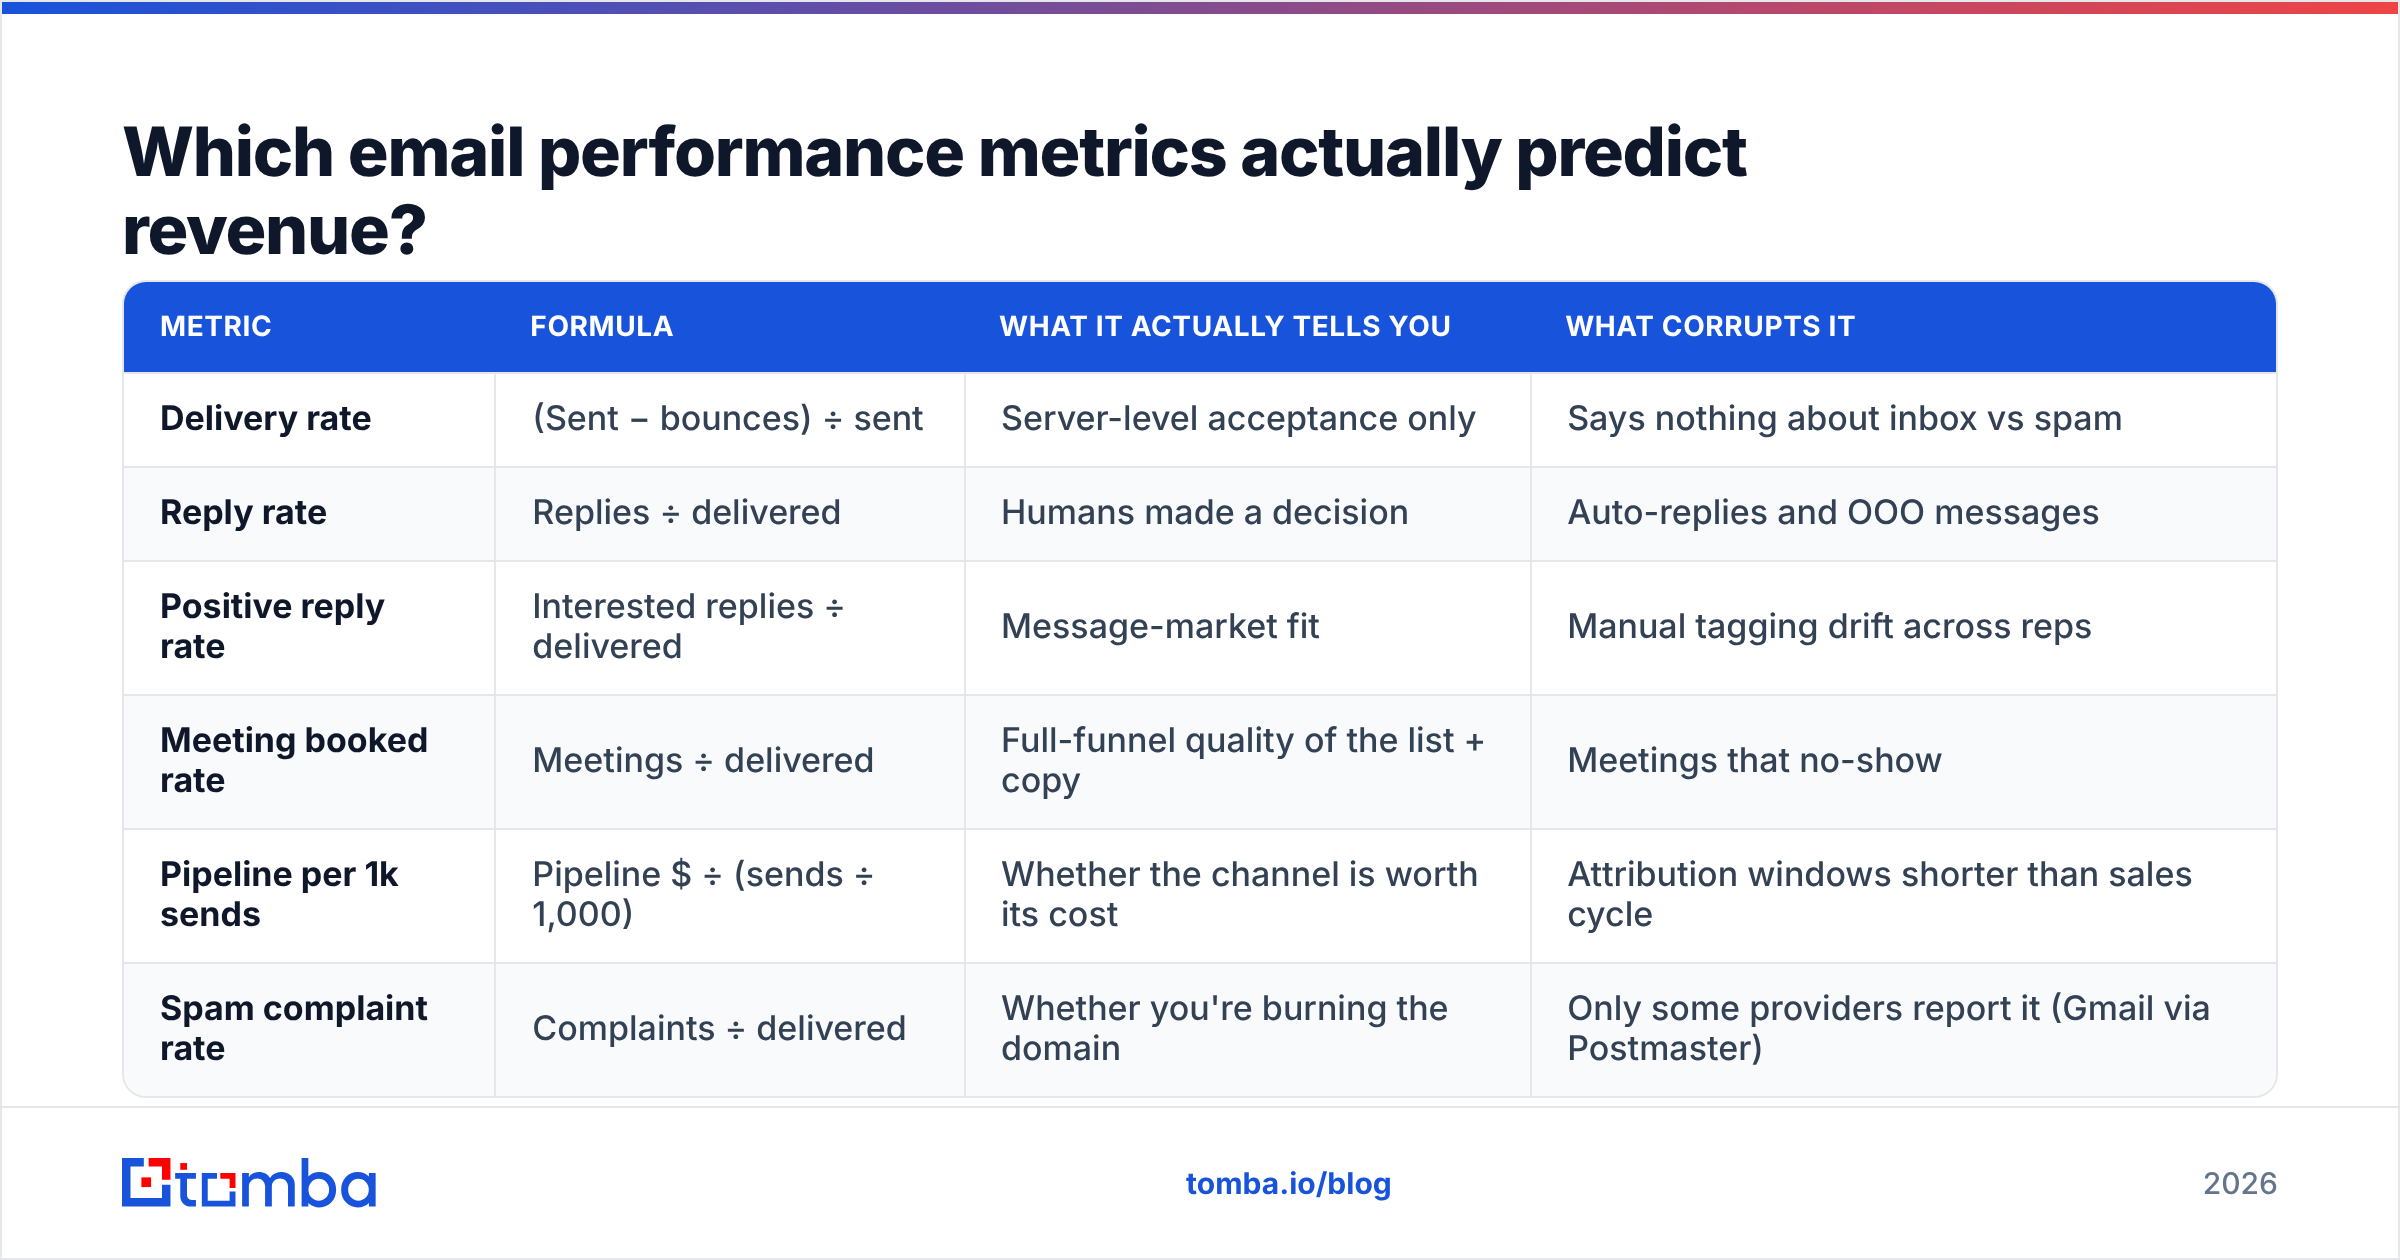
Here's the honest hierarchy, with formulas and the thing that quietly breaks each one.
| Metric | Formula | What it actually tells you | What corrupts it |
|---|---|---|---|
| Delivery rate | (Sent − bounces) ÷ sent | Server-level acceptance only | Says nothing about inbox vs spam |
| Reply rate | Replies ÷ delivered | Humans made a decision | Auto-replies and OOO messages |
| Positive reply rate | Interested replies ÷ delivered | Message-market fit | Manual tagging drift across reps |
| Meeting booked rate | Meetings ÷ delivered | Full-funnel quality of the list + copy | Meetings that no-show |
| Pipeline per 1k sends | Pipeline $ ÷ (sends ÷ 1,000) | Whether the channel is worth its cost | Attribution windows shorter than sales cycle |
| Spam complaint rate | Complaints ÷ delivered | Whether you're burning the domain | Only some providers report it (Gmail via Postmaster) |
Positive reply rate is the single most useful number in outbound. It's the only metric that punishes volume-without-relevance. Total reply rate can be gamed by provocative subject lines that generate annoyed responses; positive reply rate can't. If you track one thing weekly, track this — segmented by ICP, not blended.
For a sanity check on how the rest of the industry reports these numbers, HubSpot's marketing statistics library aggregates survey data across thousands of programs, and G2 category reviews are useful for seeing which metrics vendors actually expose in their reporting UI versus which they market.
What are realistic email benchmarks by program type?#
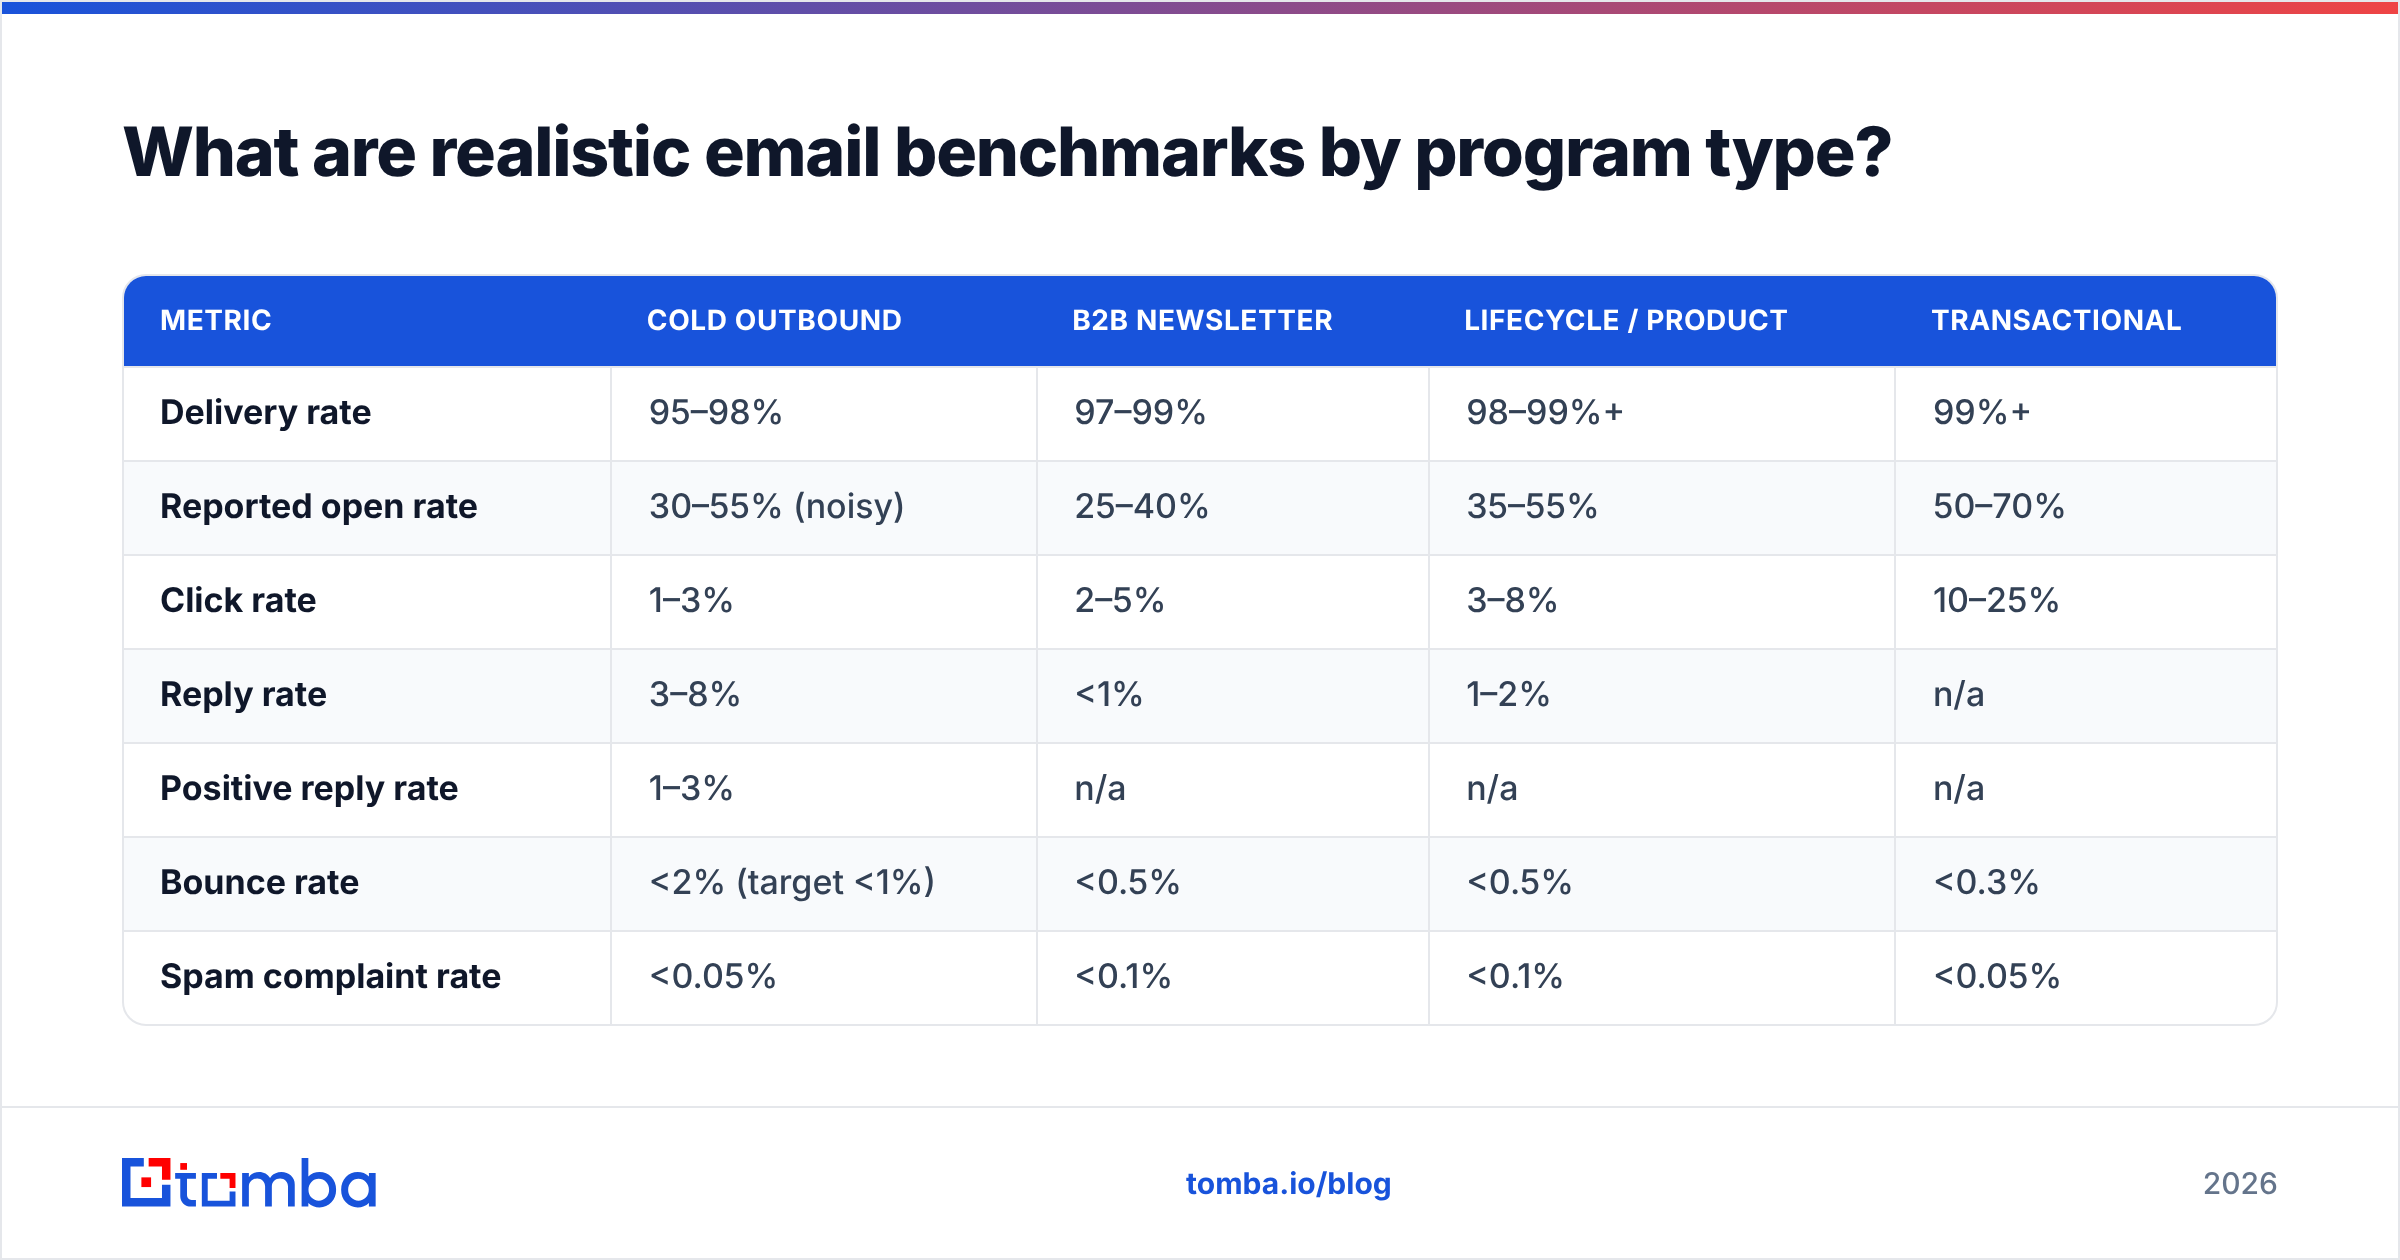
Blended benchmarks are the most misleading artifact in email marketing. A "average reply rate is 8%" claim usually means someone averaged warm nurture emails with cold prospecting. Here's a more useful split for 2026:
| Metric | Cold outbound | B2B newsletter | Lifecycle / product | Transactional |
|---|---|---|---|---|
| Delivery rate | 95–98% | 97–99% | 98–99%+ | 99%+ |
| Reported open rate | 30–55% (noisy) | 25–40% | 35–55% | 50–70% |
| Click rate | 1–3% | 2–5% | 3–8% | 10–25% |
| Reply rate | 3–8% | <1% | 1–2% | n/a |
| Positive reply rate | 1–3% | n/a | n/a | n/a |
| Bounce rate | <2% (target <1%) | <0.5% | <0.5% | <0.3% |
| Spam complaint rate | <0.05% | <0.1% | <0.1% | <0.05% |
| Unsubscribe rate | <0.5% | 0.2–0.5% | <0.3% | n/a |
Two notes on how to read this table. First, cold outbound reply rates above 10% almost always mean a tiny, hand-built list — real, but not scalable, and you should say so when you report it. Second, bounce rate targets are stricter than most teams assume. Mailbox providers treat repeated hard bounces as evidence you're mailing purchased data, and the penalty lands on your domain, not on the campaign.
Gmail and Yahoo both enforce a 0.3% spam complaint ceiling for bulk senders. That number is the point at which you get filtered, not the point at which you should worry. Treat 0.1% as your internal alarm.
How do you tell a copy problem from a data problem?#
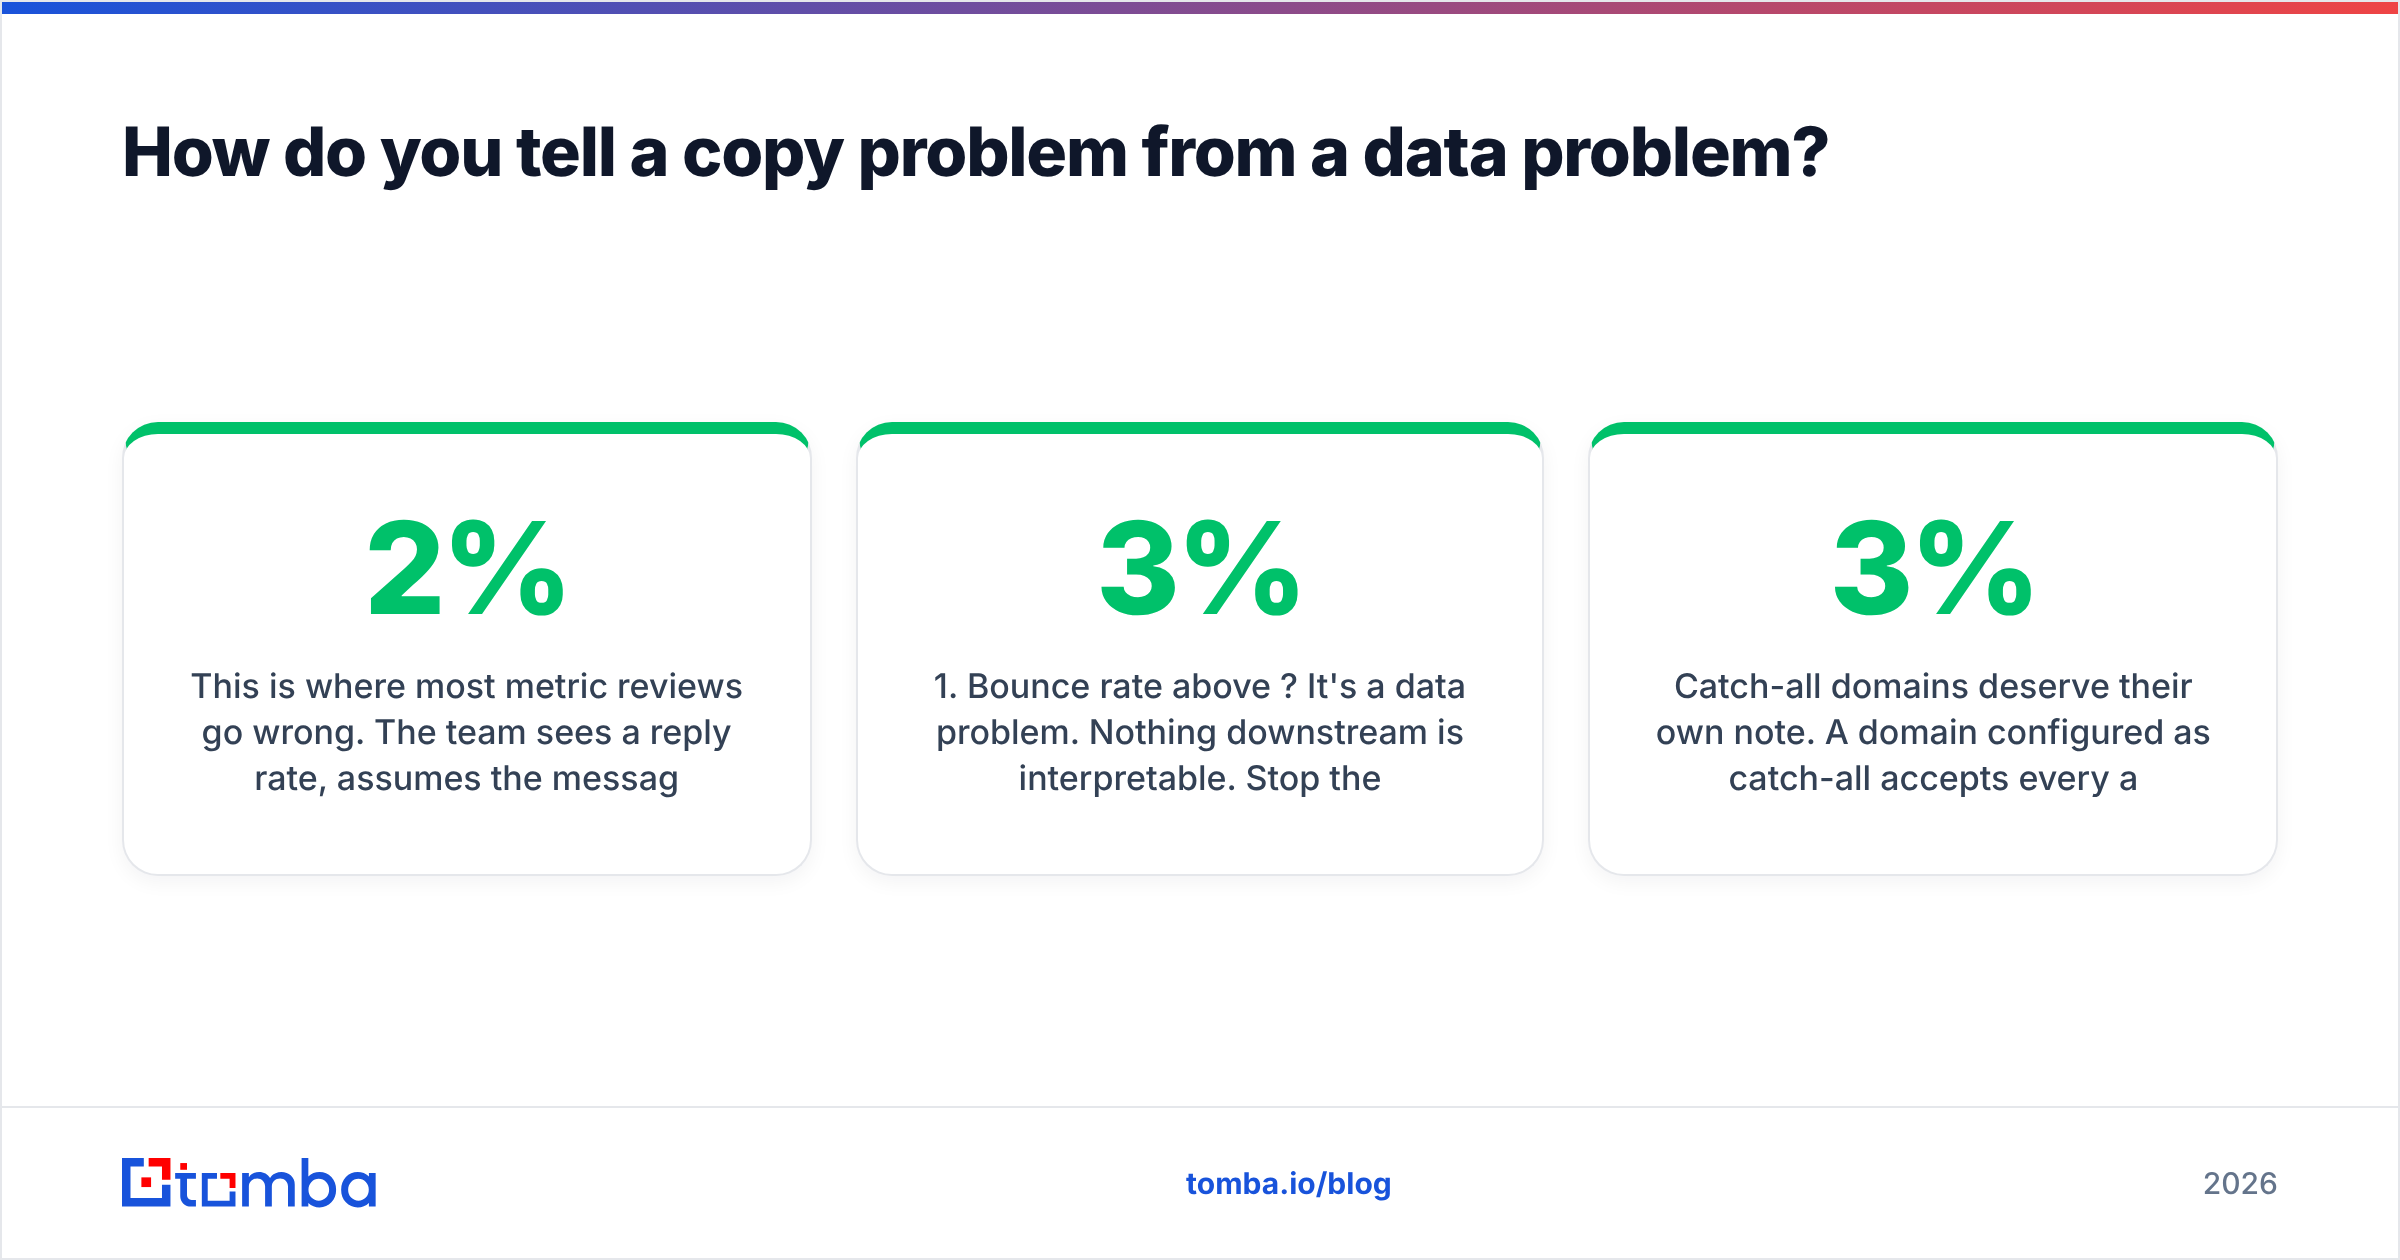
This is where most metric reviews go wrong. The team sees a 2% reply rate, assumes the messaging is weak, and spends three weeks rewriting sequences. Meanwhile 22% of the list was never a valid mailbox.
Use this diagnostic order — top to bottom, stop when you find the break:
- Bounce rate above 3%? It's a data problem. Nothing downstream is interpretable. Stop the campaign; your email deliverability is actively degrading with every send.
- Bounce rate fine, but reported opens collapsed vs your baseline? It's a placement problem. Check authentication (SPF, DKIM, DMARC alignment), domain age, and whether a new sending domain was added without warmup.
- Opens and clicks normal, replies near zero? Now it's a copy or targeting problem. This is the only scenario where rewriting the email is the right first move.
- Replies healthy, positive replies near zero? It's a targeting problem, not copy. You're reaching people who answer politely and have no budget or authority.
- Positive replies healthy, meetings low? It's a handoff problem — slow reply times, bad scheduling links, or reps not following up on soft yes.
- Meetings healthy, pipeline low? Qualification. The email is doing its job; the ICP definition isn't.
Catch-all domains deserve their own note. A domain configured as catch-all accepts every address at SMTP time, so it never hard-bounces — which means it silently inflates your delivery rate while producing zero engagement. If a large chunk of your list sits on catch-all domains, run them through a catch-all verifier before you draw conclusions from any campaign, and re-run your email verification on anything older than 90 days. B2B contact data decays roughly 2–3% per month as people change jobs.

Which deliverability metrics should you watch weekly?#
Performance metrics tell you if the program is working. Deliverability metrics tell you if it's about to stop working. They need separate reporting cadences and separate owners.
Pull these every Monday, per sending domain:
- Hard bounce rate — anything trending above 2% means list hygiene has slipped. Investigate the source, not just the list.
- Spam complaint rate — from Google Postmaster Tools for Gmail volume, plus your ESP's aggregate. Alarm at 0.1%.
- Domain reputation — Postmaster's High/Medium/Low/Bad rating. A drop from High to Medium precedes a placement crash by about a week.
- Authentication pass rate — SPF, DKIM, and DMARC should all be at or near 100%. Anything less means some mail is arriving unauthenticated.
- Unsubscribe rate by segment — a spike in one segment is a targeting signal; a spike everywhere is a frequency signal.
- Sending volume per domain per day — sudden volume changes are the most common cause of "our deliverability broke and we don't know why."
The value of these six is that they're leading indicators. Reply rate tells you what happened last week. Domain reputation tells you what will happen next week.
What should an email metrics dashboard actually contain?#
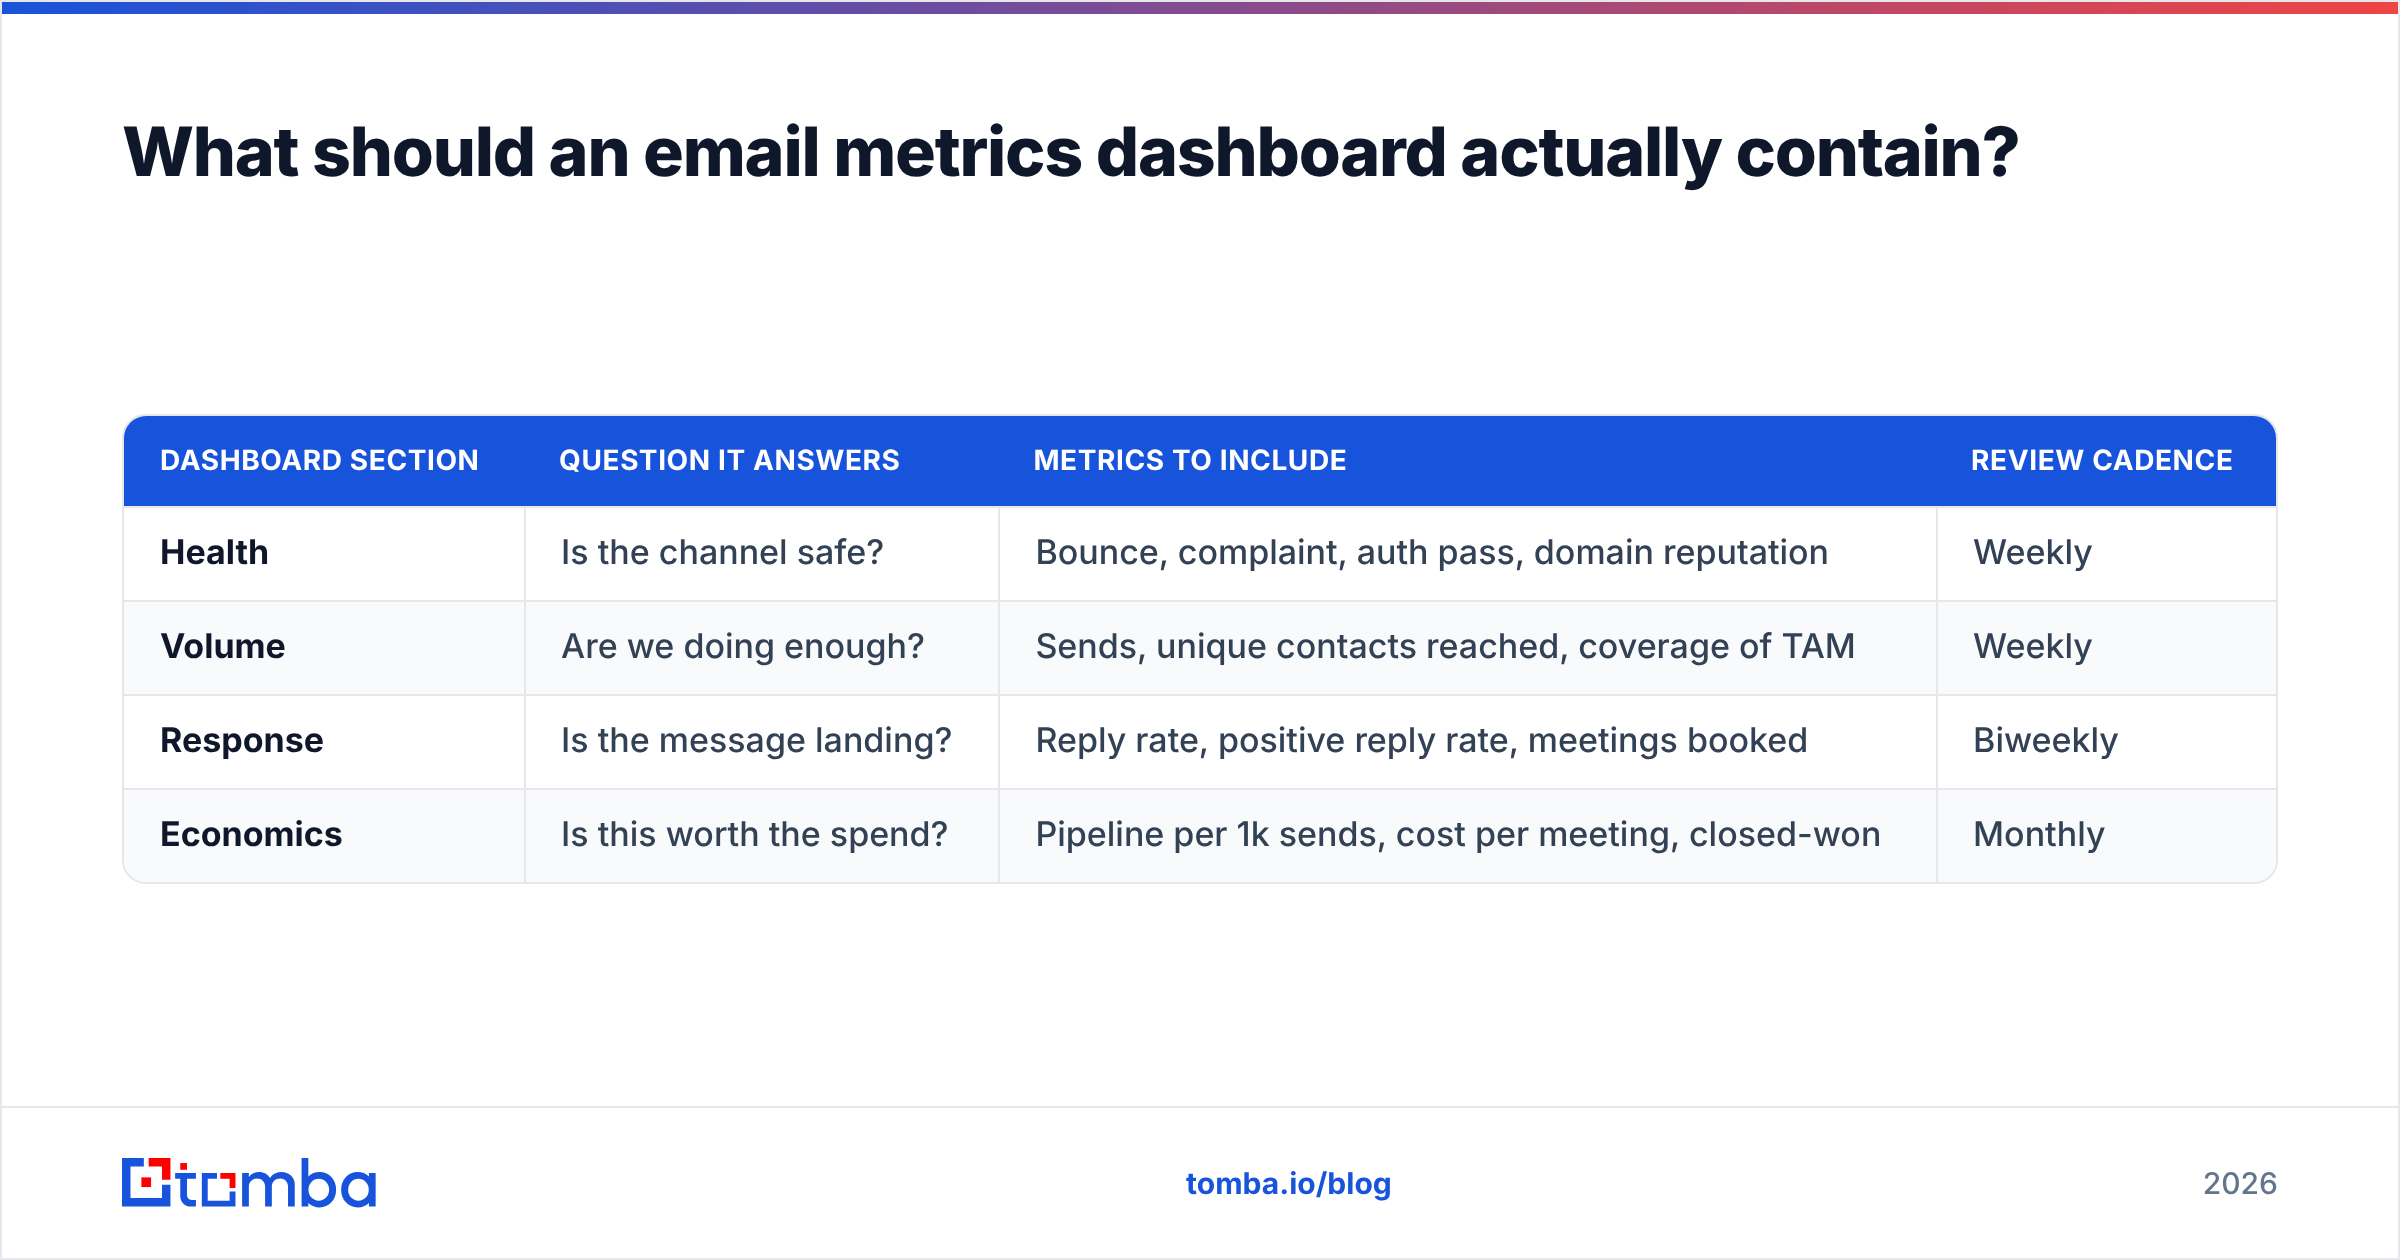
Most dashboards fail because they show everything a platform can export. A useful one answers four questions and hides the rest.
| Dashboard section | Question it answers | Metrics to include | Review cadence |
|---|---|---|---|
| Health | Is the channel safe? | Bounce, complaint, auth pass, domain reputation | Weekly |
| Volume | Are we doing enough? | Sends, unique contacts reached, coverage of TAM | Weekly |
| Response | Is the message landing? | Reply rate, positive reply rate, meetings booked | Biweekly |
| Economics | Is this worth the spend? | Pipeline per 1k sends, cost per meeting, closed-won | Monthly |
Two rules keep this honest. First, every metric needs a segment dimension — by ICP, by persona, by sequence, by sending domain. Blended numbers hide both your best-performing segment and your worst. Second, never report a rate without its denominator. A 12% reply rate on 40 sends is a story about one enthusiastic prospect, not a repeatable result.
For attribution across the full funnel, tie email activity to CRM objects rather than to the ESP's own reporting. Salesforce and HubSpot both support campaign-influenced pipeline reporting; the Salesforce campaign attribution model is a reasonable default if your sales cycle exceeds 30 days and last-touch attribution would undercount email's early-funnel role.
How do you improve the metrics that matter?#
In rough order of return on effort:
- Fix the list before the copy. Verified, role-appropriate contacts move reply rate more than any subject line rewrite. Running new lists through a bulk email finder and verification pass before the first send routinely cuts bounce rate from 8–12% down to under 2%.
- Narrow the segment. A sequence written for one job title at one company size will outperform a generic sequence to five personas, even at a tenth of the volume.
- Reduce sends per domain. Spreading volume across more sending domains protects reputation, but only if each domain is warmed. The number of contacts you can reach per week is a function of infrastructure, not ambition.
- Track positive replies manually for one month. Automated sentiment tagging is improving but still misclassifies polite deferrals as interest. Hand-tag for four weeks to calibrate, then automate against that baseline.
- Kill the metrics you don't act on. If nobody has ever changed a decision because of click-to-open rate, remove it from the dashboard. Dashboard clutter is measurable cost — it slows every review meeting you'll hold this year.
What's the fastest way to clean up your numbers?#
Start at the bottom of the stack. Metrics can't be trusted until the underlying contact data is, and no amount of dashboard engineering fixes a list where a fifth of the addresses were never real.
Build the list with verified sources instead of scraped guesses: the Tomba Email Finder returns a confidence score and the sources behind each address, so you can filter out low-confidence guesses before they ever reach a sequence and start distorting your bounce rate. The free tier covers 25 searches a month if you want to test accuracy against a list you already know the answers for; paid plans start at $49/mo on Starter and $99/mo on Growth if you're running volume. Verify first, measure second, rewrite third — in that order, every time.
Related guides#
Ready to find emails that actually work?
Join 150,000+ professionals who stopped guessing and started sending. Free credits on signup — no credit card required.
Get the Tomba newsletter
Practical outbound tactics and product updates — once every two weeks.
About the author