Email Template Analytics: How to Measure What Actually Works
Open rates stopped being data in 2021. Here is how to build email template analytics that tracks replies, meetings, and revenue per send — with the sample sizes you need before you declare a winner.
Email template analytics is easy to define and hard to do well. You judge a message by replies, meetings, and revenue — not by opens. This guide shows how to set it up, how to size a fair test, and how to read the result without fooling yourself.
TL;DR
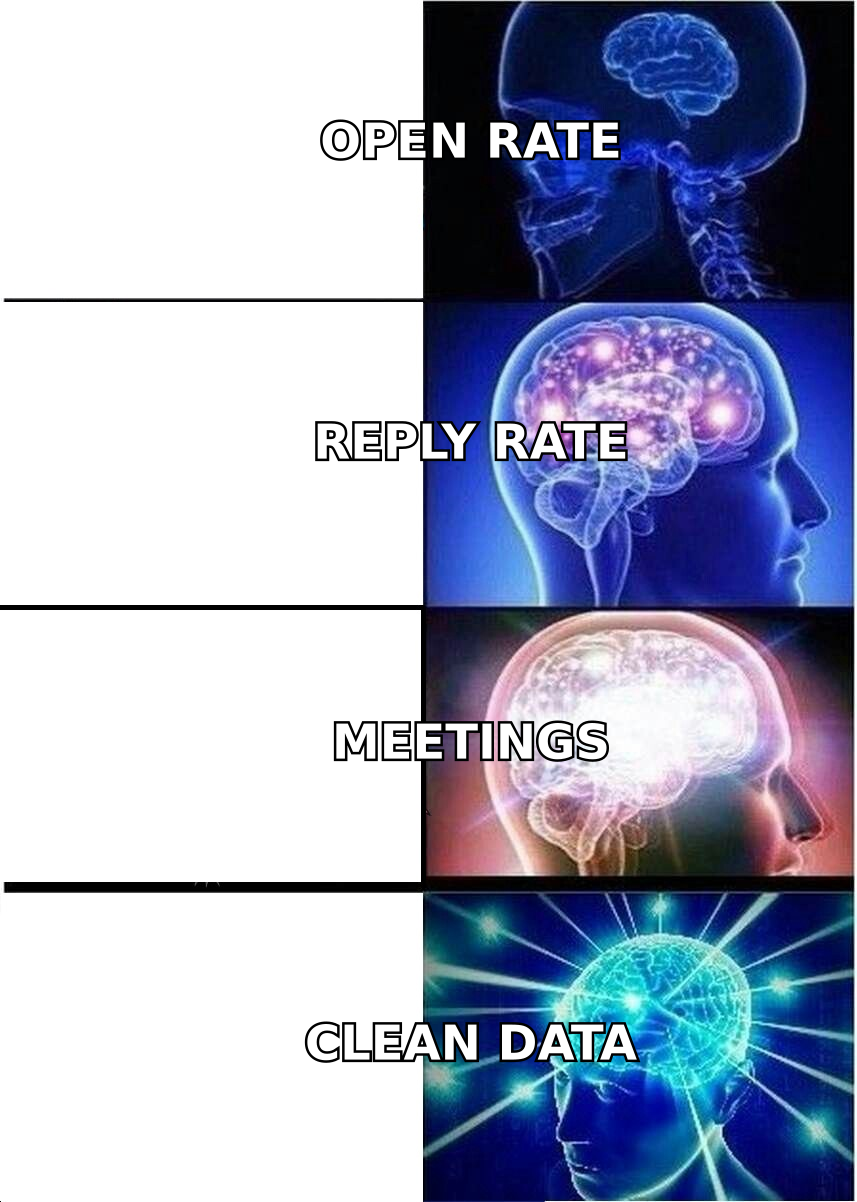
- Open rate is not a measurement any more. Apple Mail Privacy Protection and image proxies inflate it by 15-40%. Stop ranking templates by it.
- Good email template analytics tracks four numbers: reply rate, positive reply rate, meetings booked per 1,000 sends, and pipeline per 1,000 sends.
- Most template "winners" are noise. At a 5% reply rate you need about 1,500 sends per variant to trust a 2-point lift.
- List quality hides inside every result. Verify and segment first, or you are grading your data vendor instead of your copy.
- Give each template a scorecard with fixed fields: ICP, sequence step, send window, list source. Fixed fields keep results comparable across quarters.
What is email template analytics?#
Email template analytics measures performance at the copy level instead of the campaign level. You attach metrics to one message body. Then you can see which framing, structure, and CTA earn replies across lists, segments, and time periods.
Think of a restaurant that tracks dishes instead of nights. "Tuesday was a good night" tells you nothing you can act on. "The short rib sells at a 34% attach rate and gets sent back twice a month" tells you what to keep on the menu. Campaign reporting is the good-night number. Email template analytics is the dish.
The difference matters because campaigns blend everything together. One campaign result mixes the list, the sending domain, the timing, the sequence, and the copy. When that number drops, you have five suspects and no way to question them. Email template analytics holds one variable still and watches it across contexts.
Most teams already have the raw events: sends, deliveries, opens, clicks, replies, bounces. What they lack is a stable template identity. That ID has to survive a copy into a new sequence, a small edit, and a re-run for another segment. It is a naming problem before it is a tooling problem.
Which email template metrics actually predict revenue?#
Not all of them. Here is the honest ranking, sorted by how closely each metric tracks money in a normal B2B outbound motion.
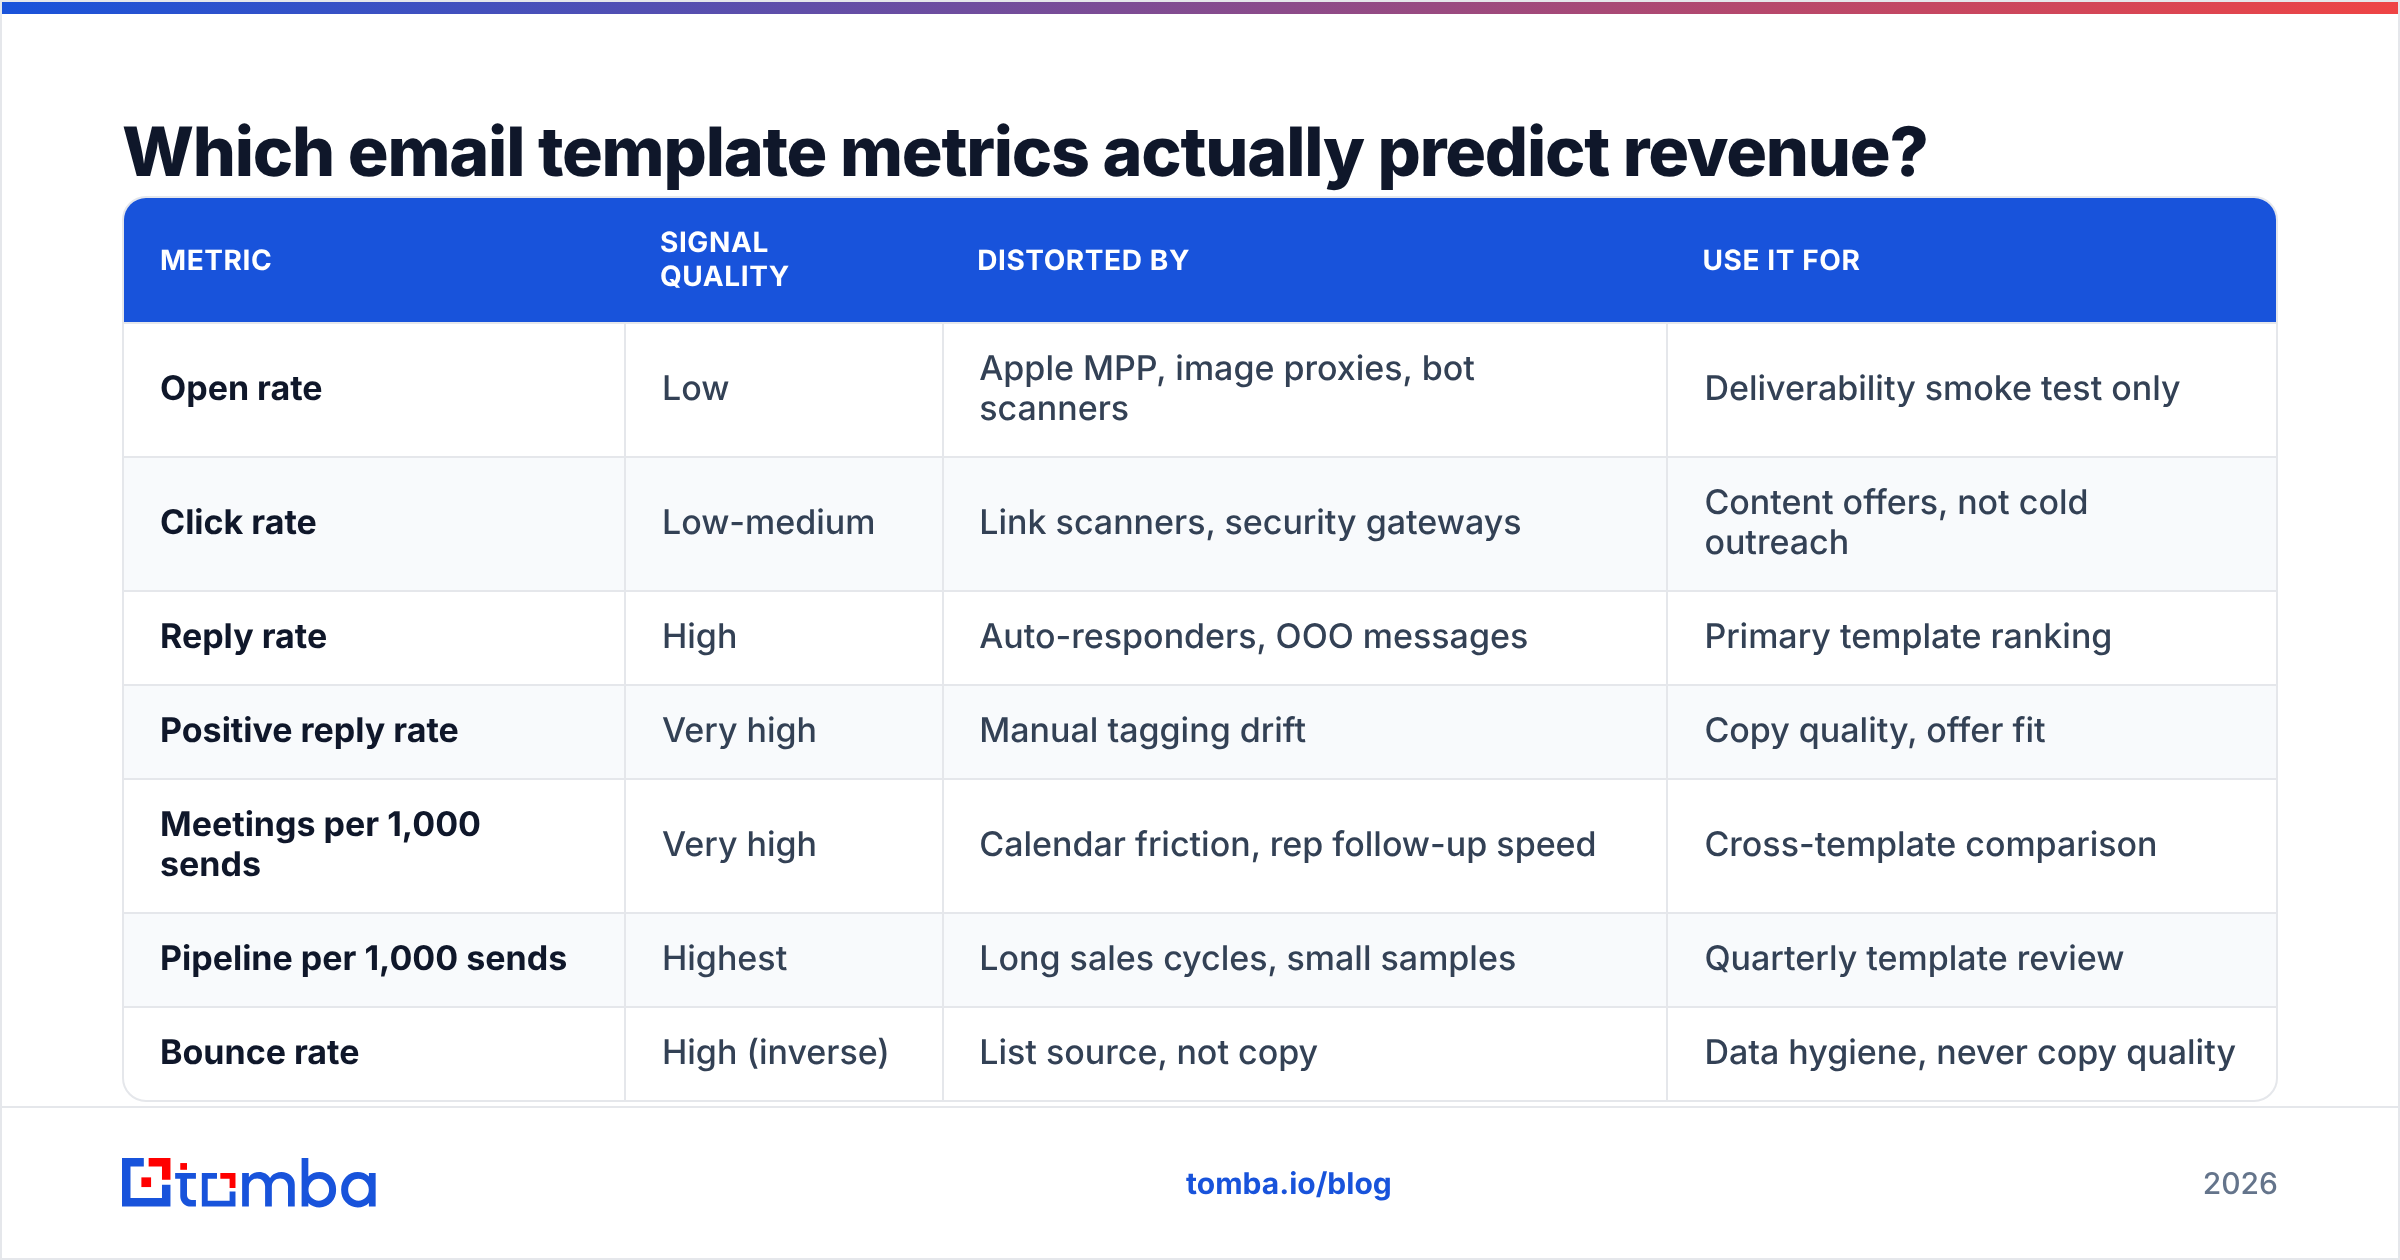
| Metric | Signal quality | Distorted by | Use it for |
|---|---|---|---|
| Open rate | Low | Apple MPP, image proxies, bot scanners | Deliverability smoke test only |
| Click rate | Low-medium | Link scanners, security gateways | Content offers, not cold outreach |
| Reply rate | High | Auto-responders, OOO messages | Primary template ranking |
| Positive reply rate | Very high | Manual tagging drift | Copy quality, offer fit |
| Meetings per 1,000 sends | Very high | Calendar friction, rep follow-up speed | Cross-template comparison |
| Pipeline per 1,000 sends | Highest | Long sales cycles, small samples | Quarterly template review |
| Bounce rate | High (inverse) | List source, not copy | Data hygiene, never copy quality |
| Unsubscribe / spam rate | High (inverse) | Volume spikes, domain age | Risk ceiling on aggressive copy |
The practical rule is short. Rank templates by positive reply rate when you want to move fast. Then check the leaders each quarter with pipeline per 1,000 sends.
Positive reply rate moves quickly enough to guide weekly work. Pipeline is slower, but it catches templates that draw curious replies and close nothing. A naive reply-rate leaderboard rewards that "what is this?" trap. Email template analytics done well does not.
A note on bounce rate: it belongs on the list, but never as a verdict on your copy. Bounces measure the list. Say Template A bounces at 9% and Template B at 2%. You just learned about two data sources, not about the writing. Run every list through an email verifier before the test. Then bounce noise stops leaking into your copy comparison.

Why did open rates stop being data?#
Because a machine creates the open event now, not your prospect.
Apple's Mail Privacy Protection launched in 2021 and is the default on most iOS devices. It pre-fetches tracking pixels through a proxy, whether or not a human reads the message. Gmail has proxied images since 2013. Security gateways such as Mimecast, Proofpoint, and Barracuda click every link and load every asset before delivery to check for malware.
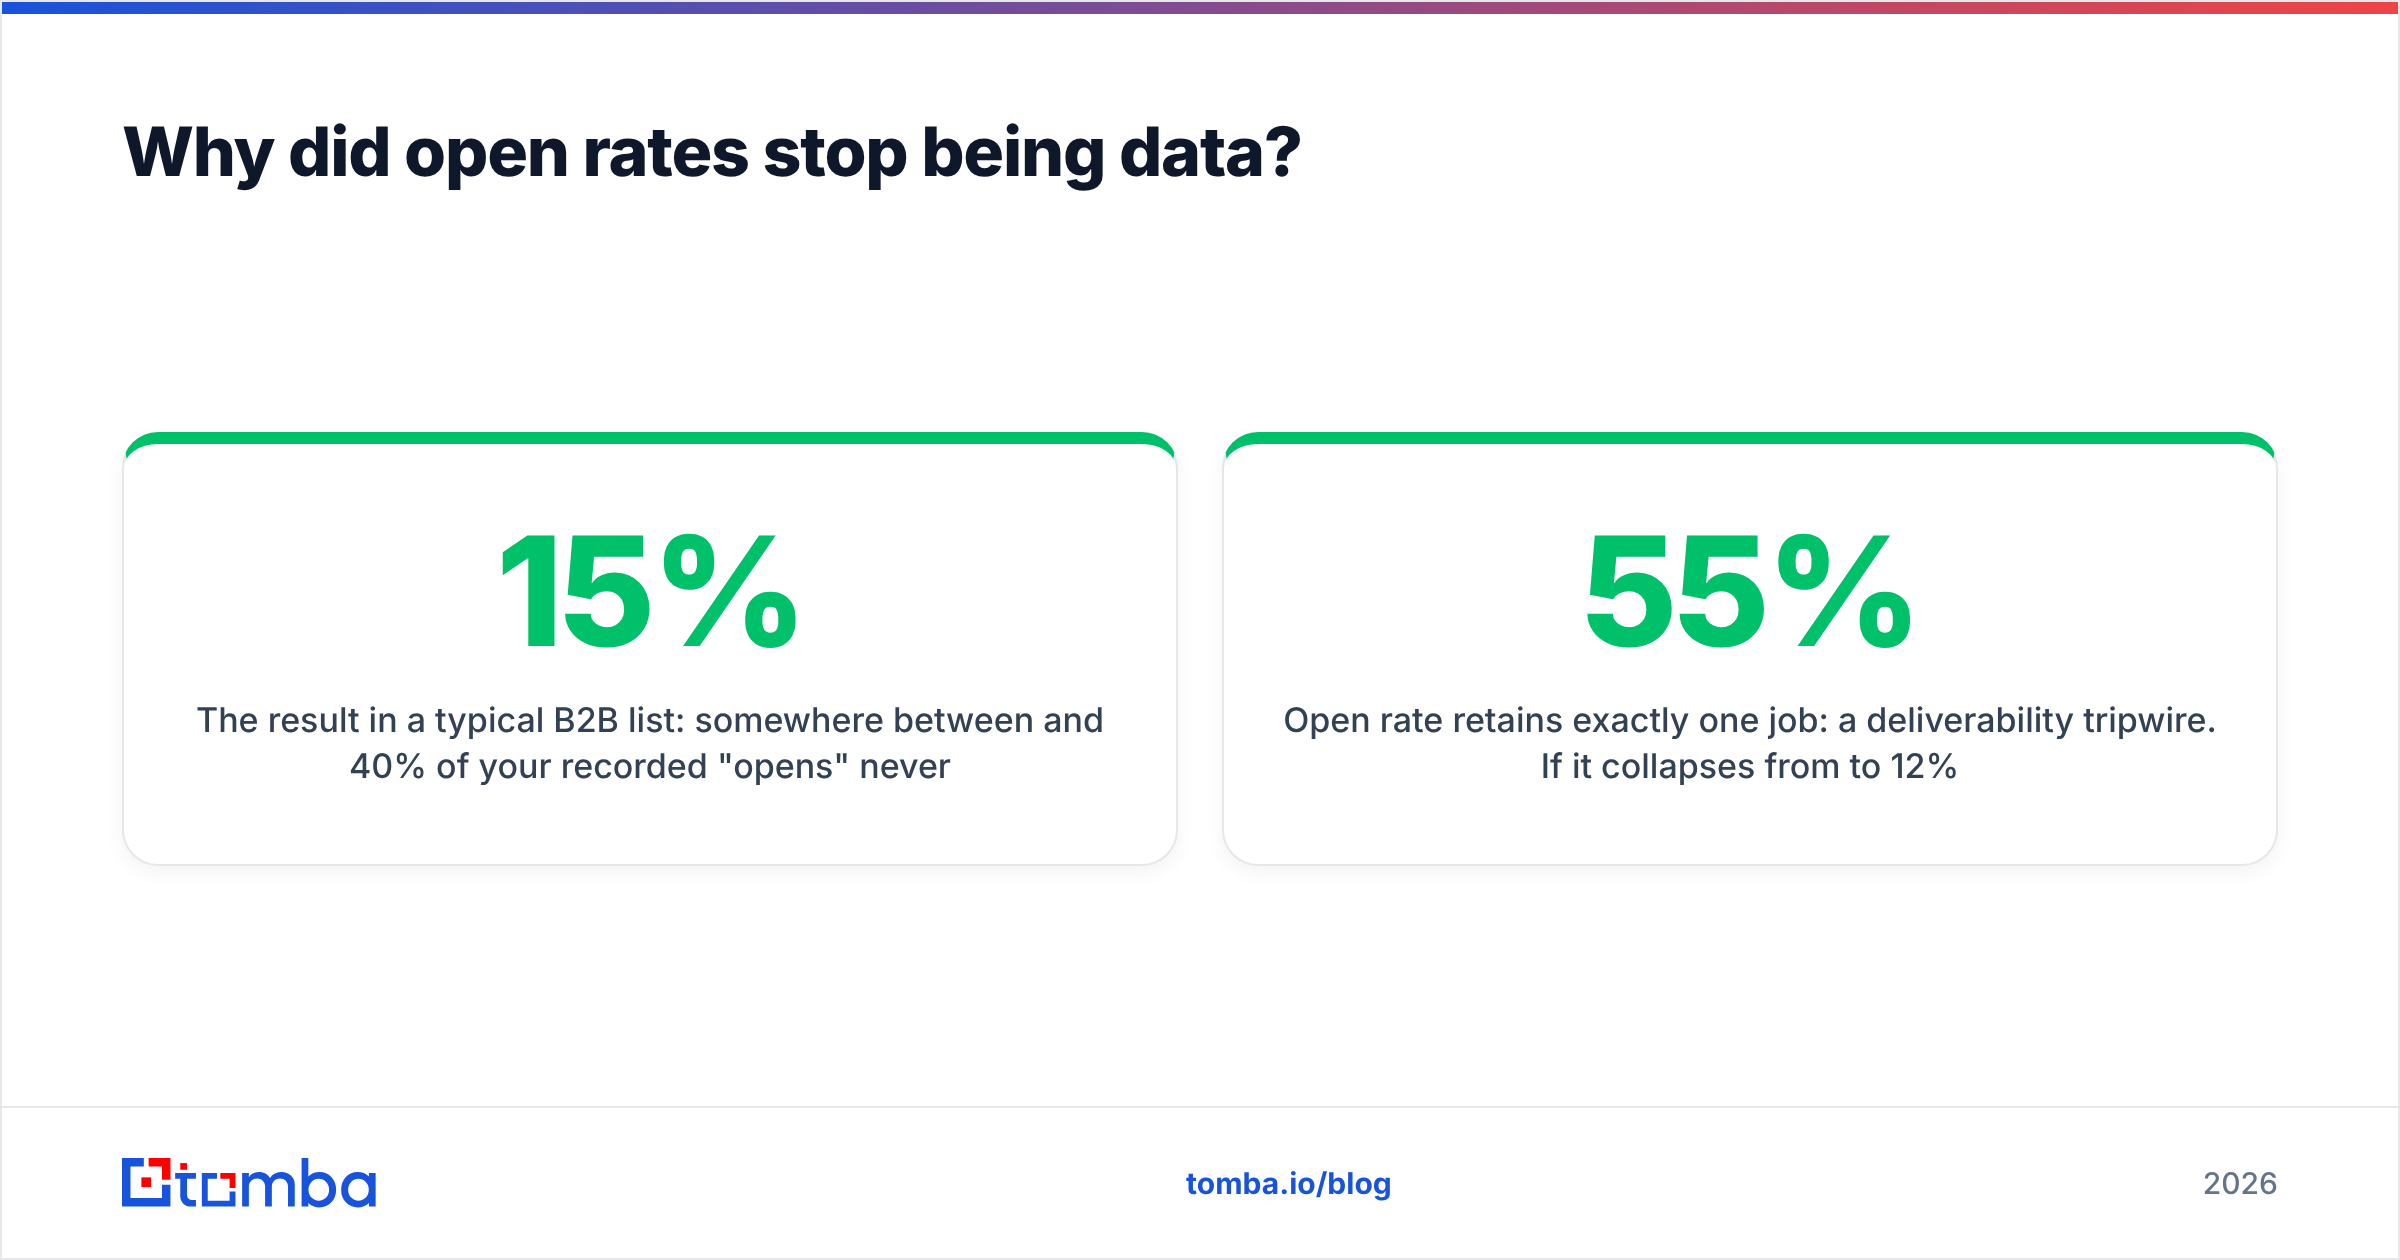
The result on a normal B2B list: 15% to 40% of your recorded "opens" never involved a person. That inflation is also uneven, which is the real problem. A list full of founders on iPhones inflates one way. A list of enterprise IT buyers behind a gateway inflates another. So when Template A shows a 61% open rate and Template B shows 47%, you may be seeing two device populations rather than two subject lines.
Subject-line testing feels this first, because it used to run on open rate alone. Subject lines still matter a great deal, since they gate everything after them. But you now have to judge them by reply rate, and replies are rarer events, so you need a bigger sample. Screen ideas with a subject line tester for structural problems first. Then spend real sends only on the survivors.
Open rate keeps exactly one job: a deliverability tripwire. If it falls from 55% to 12% overnight, you have an inbox placement problem, not a copy problem. Watch it as an alarm, never as a scoreboard. Email deliverability is its own discipline, separate from email template analytics, and it needs its own tools.
How large does a template test need to be?#
Larger than you think. This is where most email template analytics programs quietly fail.
Replies are low-frequency events. Say you want to tell a 4% reply rate apart from a 6% one. That is a 50% relative lift, a genuinely excellent result. You still need roughly 1,400-1,600 sends per variant at normal confidence levels. Telling 4% from 4.5% takes about 25,000 sends per variant. Most teams call a winner at 200 sends and a two-message gap.
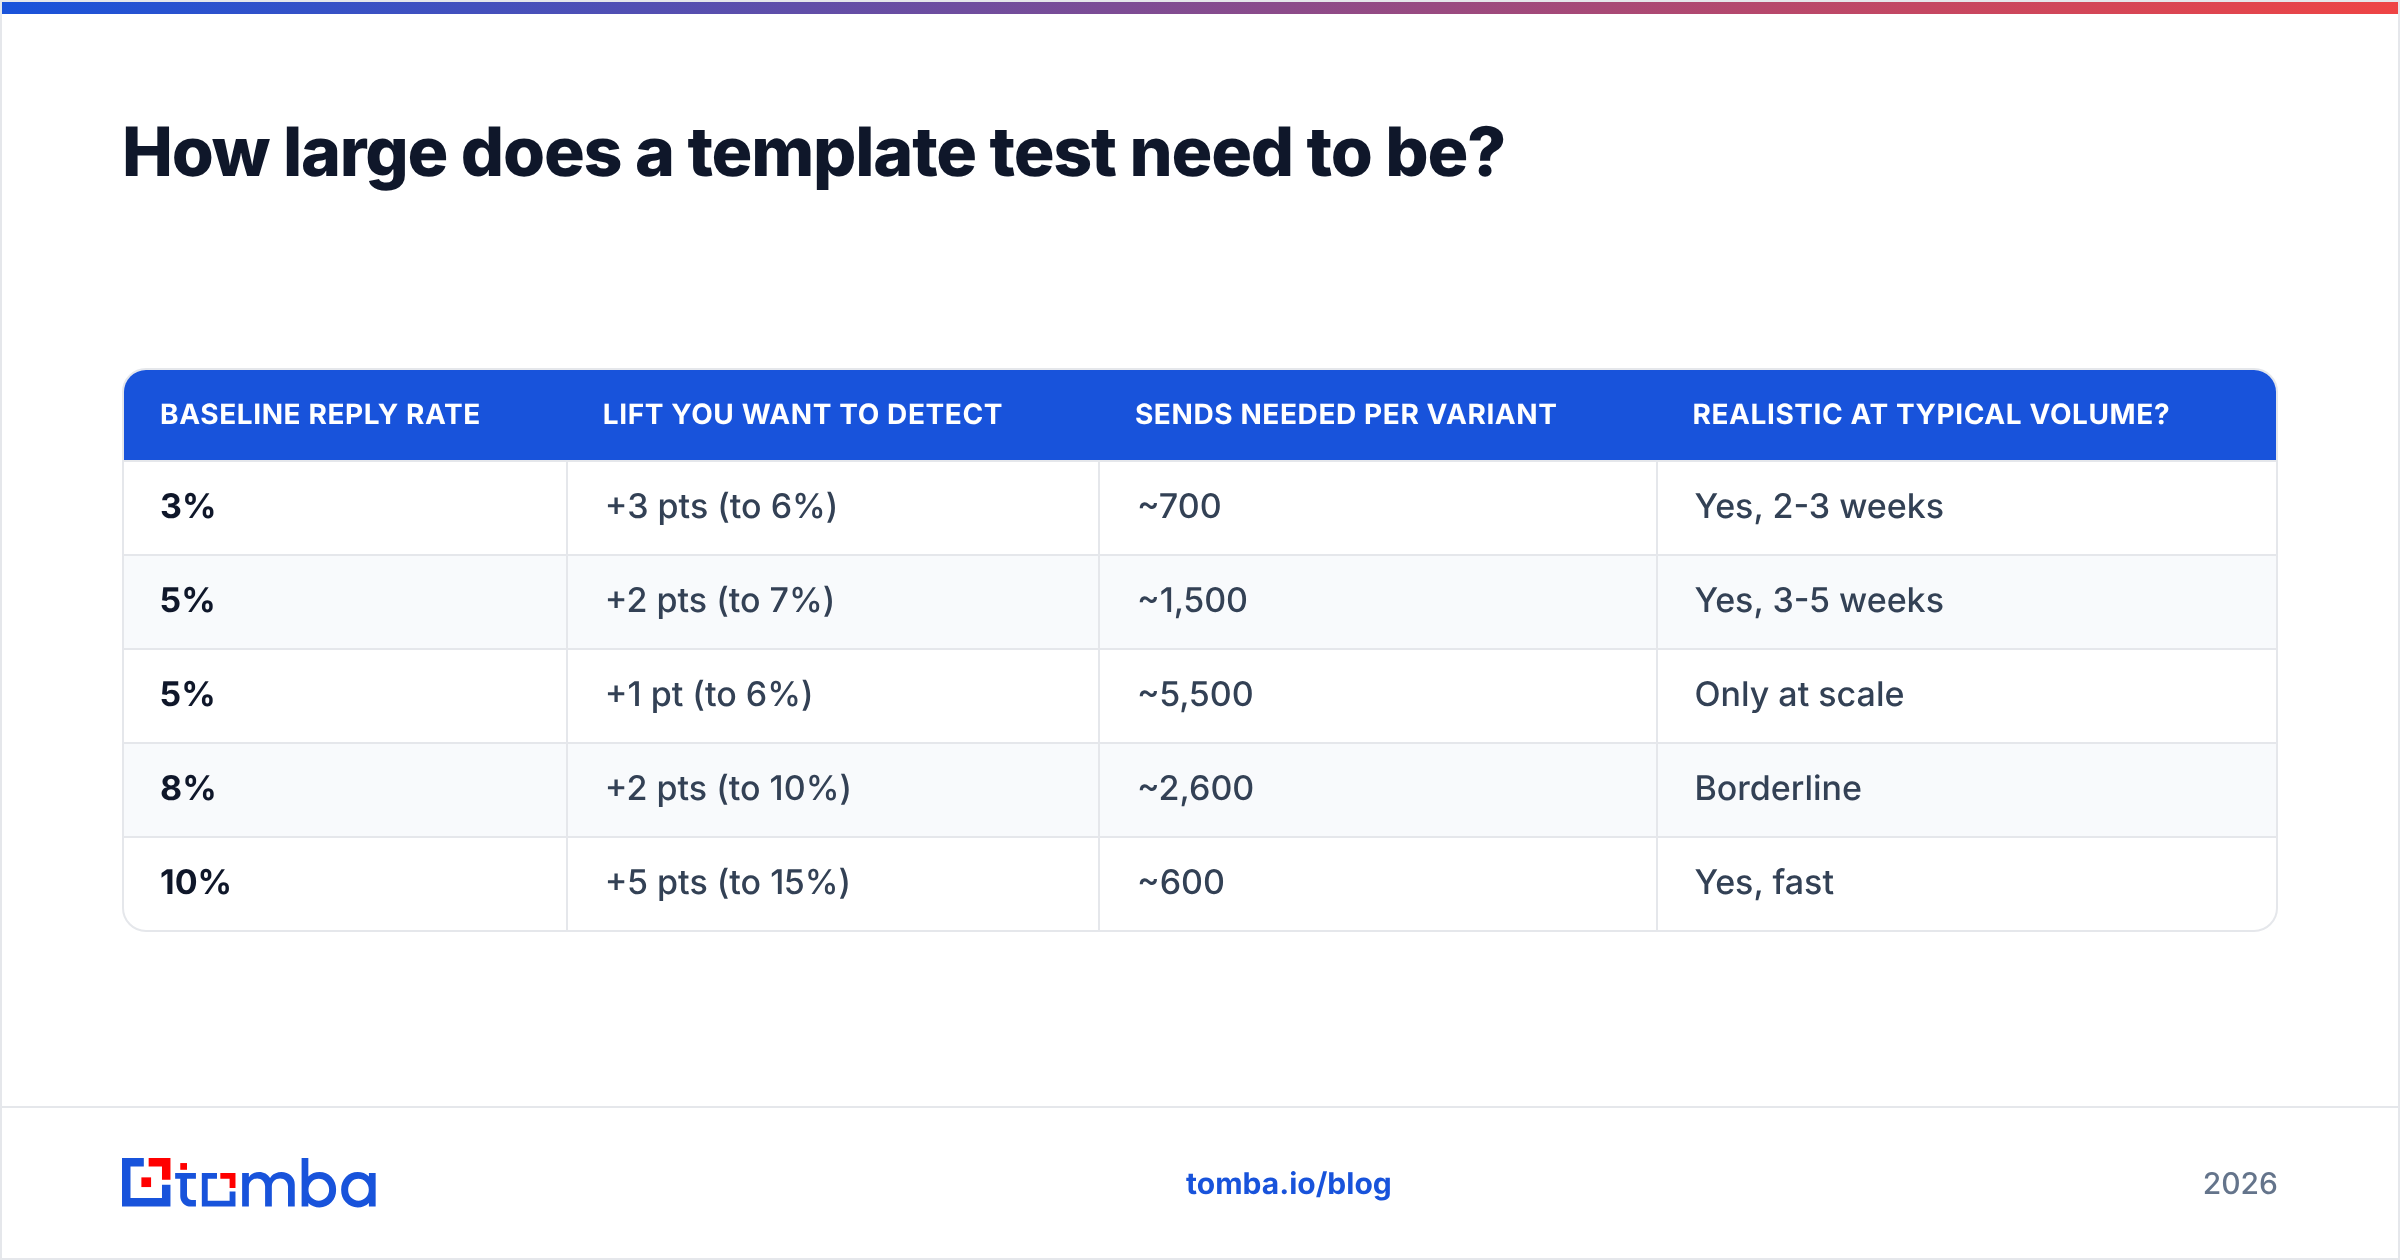
Here is a working reference table for two-variant tests at 80% power and 95% confidence:
| Baseline reply rate | Lift you want to detect | Sends needed per variant | Realistic at typical volume? |
|---|---|---|---|
| 3% | +3 pts (to 6%) | ~700 | Yes, 2-3 weeks |
| 5% | +2 pts (to 7%) | ~1,500 | Yes, 3-5 weeks |
| 5% | +1 pt (to 6%) | ~5,500 | Only at scale |
| 8% | +2 pts (to 10%) | ~2,600 | Borderline |
| 10% | +5 pts (to 15%) | ~600 | Yes, fast |
Three things follow.
Test big swings, not tweaks. "Quick question" against "Quick question?" is unmeasurable at any volume you actually have. A problem-first opener against a peer-proof opener is measurable.
Pool across campaigns. A template's stats should add up across every sequence it appears in. That is why stable template IDs matter so much.
Report directional reads honestly. With only 300 sends, say "directionally better, not confirmed" instead of naming a winner. Statistical significance exists to stop teams from turning coin flips into policy.
The cheapest way to reach sample size faster is to stop sending to dead addresses. Every bounce is a send that produced zero information. Teams that verify before sending usually recover 8-15% of their working volume, and test cycles shrink by about the same share.
What should a template scorecard actually track?#
A scorecard is a fixed record attached to every template, so results stay comparable. Email template analytics falls apart without one. Six fields, minimum:
- Template ID and version — Immutable ID, incrementing version. Any copy edit creates a new version, and stats do not carry over. Teams skip this step more than any other, and it is why most template data is unusable after two quarters.
- ICP segment — Persona, company size band, and industry. A template that wins with 20-person agencies and loses with 2,000-person manufacturers is not a bad template. It is a mis-segmented one.
- Sequence position — Step 1 cold open, step 3 bump, step 5 breakup. A breakup template's 11% reply rate is not comparable to an opener's 5%. Averaging them destroys both numbers.
- List source and verification status — Which data provider, verified when, catch-all handling. Without this, you cannot separate copy performance from data performance.
- Send window and volume — Date range and total sends. This lets you spot seasonality and check whether a "winner" cleared sample size.
- Outcome ladder — Sends, delivered, replies, positive replies, meetings, opportunities, closed revenue. Every rung, not just the top one.
That last field is where tooling gaps show up. Reply data sits in the sending tool. Meeting data sits in the calendar. Revenue sits in the CRM. Joining them takes either a native integration or a weekly export. Do the join. A program that stops at reply rate will eventually crown a template that collects polite brush-offs at scale.
Which tools handle template-level reporting well?#
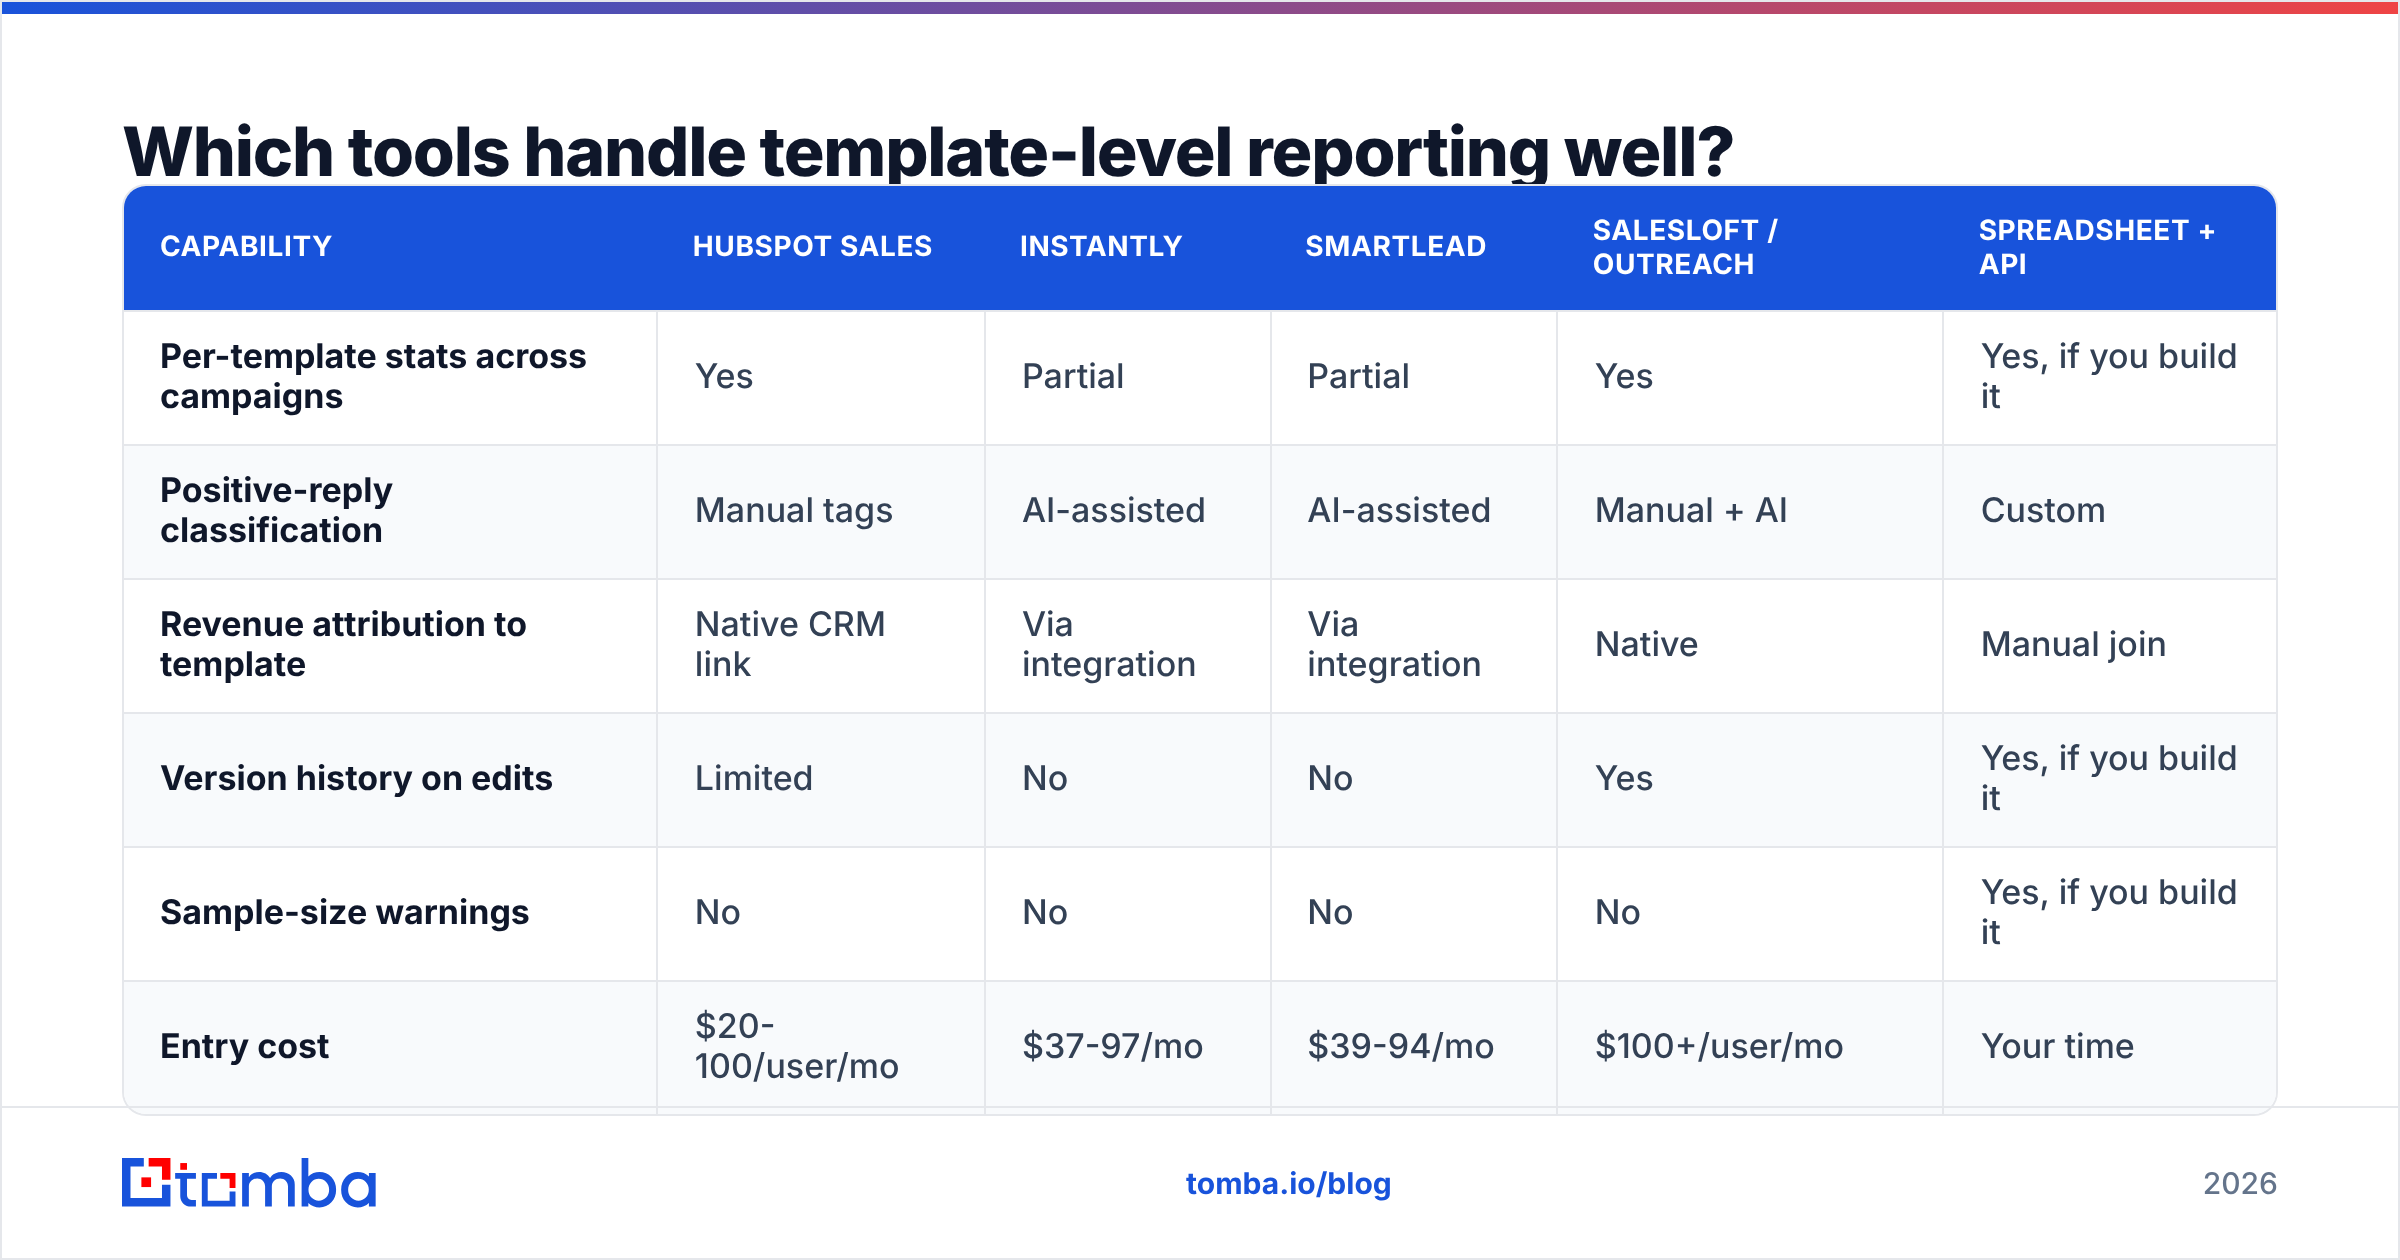
Email template analytics is a feature, not a category, and support varies a lot. Here is how the common stacks compare on per-template measurement.
| Capability | HubSpot Sales | Instantly | Smartlead | Salesloft / Outreach | Spreadsheet + API |
|---|---|---|---|---|---|
| Per-template stats across campaigns | Yes | Partial | Partial | Yes | Yes, if you build it |
| Positive-reply classification | Manual tags | AI-assisted | AI-assisted | Manual + AI | Custom |
| Revenue attribution to template | Native CRM link | Via integration | Via integration | Native | Manual join |
| Version history on edits | Limited | No | No | Yes | Yes, if you build it |
| Sample-size warnings | No | No | No | No | Yes, if you build it |
| Entry cost | $20-100/user/mo | $37-97/mo | $39-94/mo | $100+/user/mo | Your time |
The honest read: sequencer-native tools (Instantly, Smartlead) are strong on reply data and weak on template identity. Copy a template into a new campaign and its history resets. CRM-native tools (HubSpot, Salesloft) hold template identity and revenue links well, but they cost more per seat and move slower. Many teams run a hybrid: send from the sequencer, export weekly, join on template ID in a warehouse or a well-kept sheet.
Check the category on G2 before you commit, because feature gaps shift fast and template versioning is new in several tools. No tool fixes the layer underneath, though. If your list is 12% invalid, your leaderboard is 12% noise before the first send goes out.
How do you separate copy performance from list performance?#
Hold the list steady and randomize at the contact level. This is the core discipline of email template analytics.
The wrong way is also the common way: run Template A on this week's list and Template B on next week's. Now the copy, the list, and the send window all changed at once. The result cannot be read.
The right way is simple. Take one verified list. Shuffle it. Split it into equal halves at random. Send both variants in the same window from the same domain pool. This is basic experimental hygiene, and most sequencers support random splits out of the box.
Three extra controls are worth enforcing:
- Same sending infrastructure. Domains carry different reputations. A template sent from a warmed two-year-old domain will beat identical copy from a three-week-old one.
- Same verification standard. If half your list went through catch-all verification and half did not, the unverified half shows inflated bounces and a depressed reply rate.
- Same follow-up discipline. One rep answers inbound in 4 minutes, another takes 2 days. Meetings booked then diverge for reasons the opener never touched.
When the list is truly held steady and the sample clears the threshold, a reply-rate gap is real signal about your copy. When it is not, you are benchmarking vendors.
What are the most common email template analytics mistakes?#
- Ranking by open rate. Covered above. It measures Apple's proxy servers as much as your prospects.
- Averaging across sequence steps. Openers, bumps, and breakups have very different reply rates. Compare within a step only.
- Never retiring winners. Templates decay. A framing that worked in Q1 gets copied by twelve competitors by Q3, and the reply rate halves. Re-test your champion against a fresh challenger every quarter.
- Ignoring negative signal. A template with a 9% reply rate and a 0.4% spam-complaint rate is a liability, not a winner. Track complaints and unsubscribes next to replies, and set a hard ceiling.
- Counting auto-replies as replies. Out-of-office messages land as reply events in most tools. Filter them, or your top template will be whichever one hit the most vacationing prospects.
- Testing on dirty data. The most expensive mistake, because it invalidates everything downstream. Verify first, test second.
Where should you start this quarter?#
Pick your five most-used templates. Give each one a permanent ID. Backfill the scorecard fields you can rebuild, and mark the rest unknown. Then run one properly randomized head-to-head: your current champion against a genuinely different challenger, on a verified list, sized to clear the threshold table above. Report the result with a caveat, not a victory lap.
That single cycle teaches you more than a year of campaign dashboards. It is the first time you will have measured your copy instead of your circumstances.
Every part of email template analytics rests on data you can trust. Run it on a list with a double-digit invalid rate and it returns confident, precise, wrong answers — which cost more than no measurement at all. Clean the input first. Use the Tomba Email Finder to build verified, source-attributed contact lists so bounce noise stays out of your copy tests. Check Tomba pricing too: the free tier covers 25 searches a month for a quick sanity check, and Starter runs $49/mo when you are ready to test at real volume.
Related guides#
Ready to find emails that actually work?
Join 150,000+ professionals who stopped guessing and started sending. Free credits on signup — no credit card required.
Get the Tomba newsletter
Practical outbound tactics and product updates — once every two weeks.
About the author