Email Tracking Metrics in 2026: The 7 That Actually Matter
Open rate has been quietly broken since 2021, yet most teams still report it first. Here are the email tracking metrics that survive privacy proxies, the benchmarks to hold them against, and the ones to stop reporting.
TL;DR
- Open rate is no longer a measurement — it is a guess. Apple Mail Privacy Protection and Gmail's image proxy pre-fetch pixels for a large share of your list, inflating opens without a human ever reading the message.
- Seven metrics still hold up in 2026: bounce rate, spam complaint rate, click rate, reply rate, positive reply rate, meeting-booked rate, and unsubscribe rate.
- Bounce rate is the only metric that is fully in your control before you press send. Everything downstream degrades if you skip verification.
- Benchmarks are useless without segmentation. A 3% reply rate on a 40-person ICP list means something completely different from 3% on a 40,000-person blast.
- Build the dashboard backwards: start with meetings booked, then work up the funnel to find the leak. Most teams do the opposite and optimize the metric that matters least.
What are email tracking metrics?#
Email tracking metrics are the numbers that describe what happened to a message after you hit send: whether it arrived, whether it was seen, whether it caused an action, and whether that action turned into revenue.
Think of it like a restaurant. Delivery rate is whether the plate reached the table. Open rate is whether the diner picked up a fork. Reply rate is whether they called the waiter back over. Meetings booked is whether they came back next week. Most teams obsess over the fork.
Technically, these metrics come from three different instrumentation layers, and understanding which layer produced a number tells you how much to trust it:
- SMTP-level signals — bounces, deferrals, and rejections reported by the receiving server. These are hard facts. A 550 response is a 550 response.
- Pixel-based signals — opens, tracked by embedding a 1x1 transparent image that fires a request when rendered. This layer is where privacy proxies broke everything.
- Redirect-based signals — clicks, tracked by rewriting links to route through your sending platform first. More reliable than pixels, but still distorted by link scanners.
- Human-response signals — replies, positive replies, meetings booked, opportunities created. Slowest to collect, impossible to fake, and the only layer that correlates with pipeline.
Everything in this guide is about pushing your reporting down toward layers one and four, and treating layer two as directional noise.
Why did open rate stop being reliable?#
Because two of the largest mailbox providers on earth decided your subscribers' reading habits were nobody's business.
Apple's Mail Privacy Protection, rolled out in iOS 15 and on by default in the setup flow, routes mail through a proxy that pre-loads all remote content — including your tracking pixel — regardless of whether the recipient ever opens the message. Gmail has proxied images through its own servers since 2013, which strips IP and device data and, in some configurations, caches the pixel fetch.
The practical effect on a typical B2B list:
- A meaningful slice of your "opens" fire within seconds of delivery, at machine speed, in clusters that no human reading pattern would produce.
- Corporate security gateways (Proofpoint, Mimecast, Microsoft Defender) detonate links and load images to scan for threats. They generate opens and clicks.
- Open-rate-based A/B tests on subject lines return statistically confident results that mean nothing, because the treatment group and control group are both mostly bots.
Open rate is not worthless — it is directionally useful for spotting a catastrophic drop (if opens fall from 42% to 4%, you have a deliverability emergency). But it should never appear at the top of a report, and it should never be the metric a rep is compensated on. For a deeper primer on the mechanics, Wikipedia's email tracking overview covers the pixel and redirect methods without vendor spin.

Which email tracking metrics actually matter in 2026?#
Seven. Ranked by how tightly they correlate with revenue and how resistant they are to instrumentation noise.
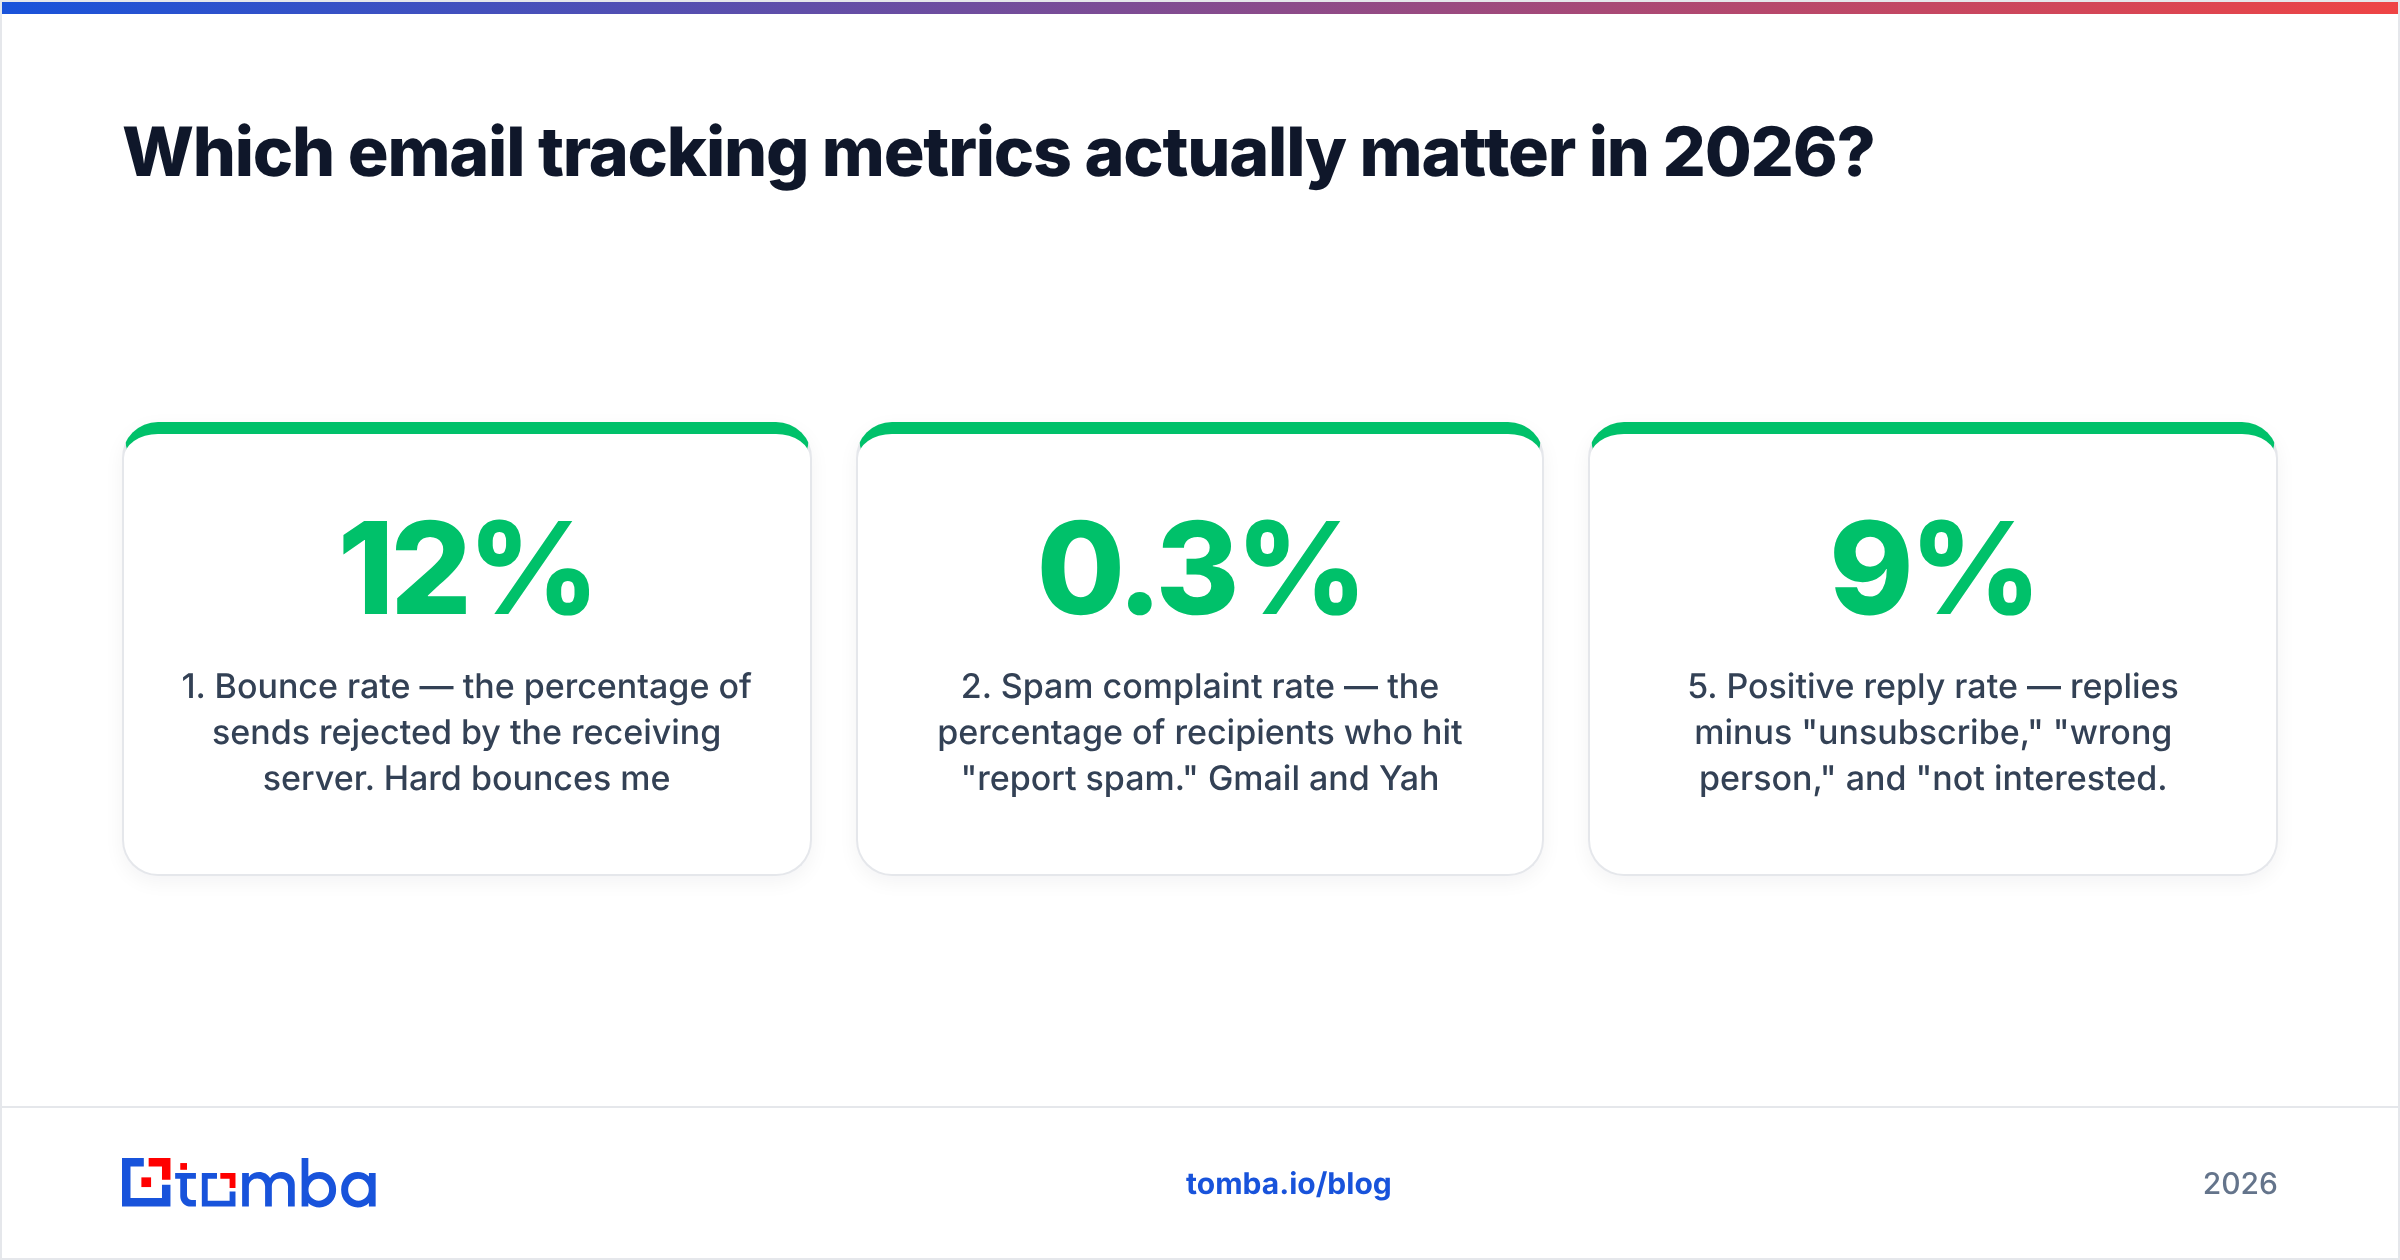
- Bounce rate — the percentage of sends rejected by the receiving server. Hard bounces mean the address does not exist. This is the leading indicator for everything else: a list with a 12% bounce rate will torch your sender reputation within two sends, and every metric below will collapse as a consequence.
- Spam complaint rate — the percentage of recipients who hit "report spam." Gmail and Yahoo's bulk-sender requirements put the ceiling at 0.3%, with 0.1% as the real operating target. Cross it and you stop reaching the inbox entirely.
- Click rate — still distorted by security scanners, but far less than opens. Filter out clicks that occur within the first 5 seconds of delivery and clicks from known scanner user agents, and what remains is reasonably trustworthy.
- Reply rate — the percentage of recipients who wrote back. No proxy fakes a reply. This is the single best top-line health metric for outbound, and it is what your response rate benchmarks should track.
- Positive reply rate — replies minus "unsubscribe," "wrong person," and "not interested." A 9% reply rate that is 80% negative is worse than a 3% reply rate that is 60% positive, because the first one is generating list damage.
- Meeting-booked rate — meetings held divided by contacts emailed. The only metric a CFO cares about. Slow to accumulate, but it is the denominator check on everything above it.
- Unsubscribe rate — the honest opt-out signal. A rising unsubscribe rate on a stable reply rate usually means your targeting drifted, not that your copy got worse.
Everything else — delivery rate, forward rate, read time, device breakdown — is a diagnostic you pull when one of these seven moves, not a number you report weekly.
What are realistic benchmarks for each metric?#
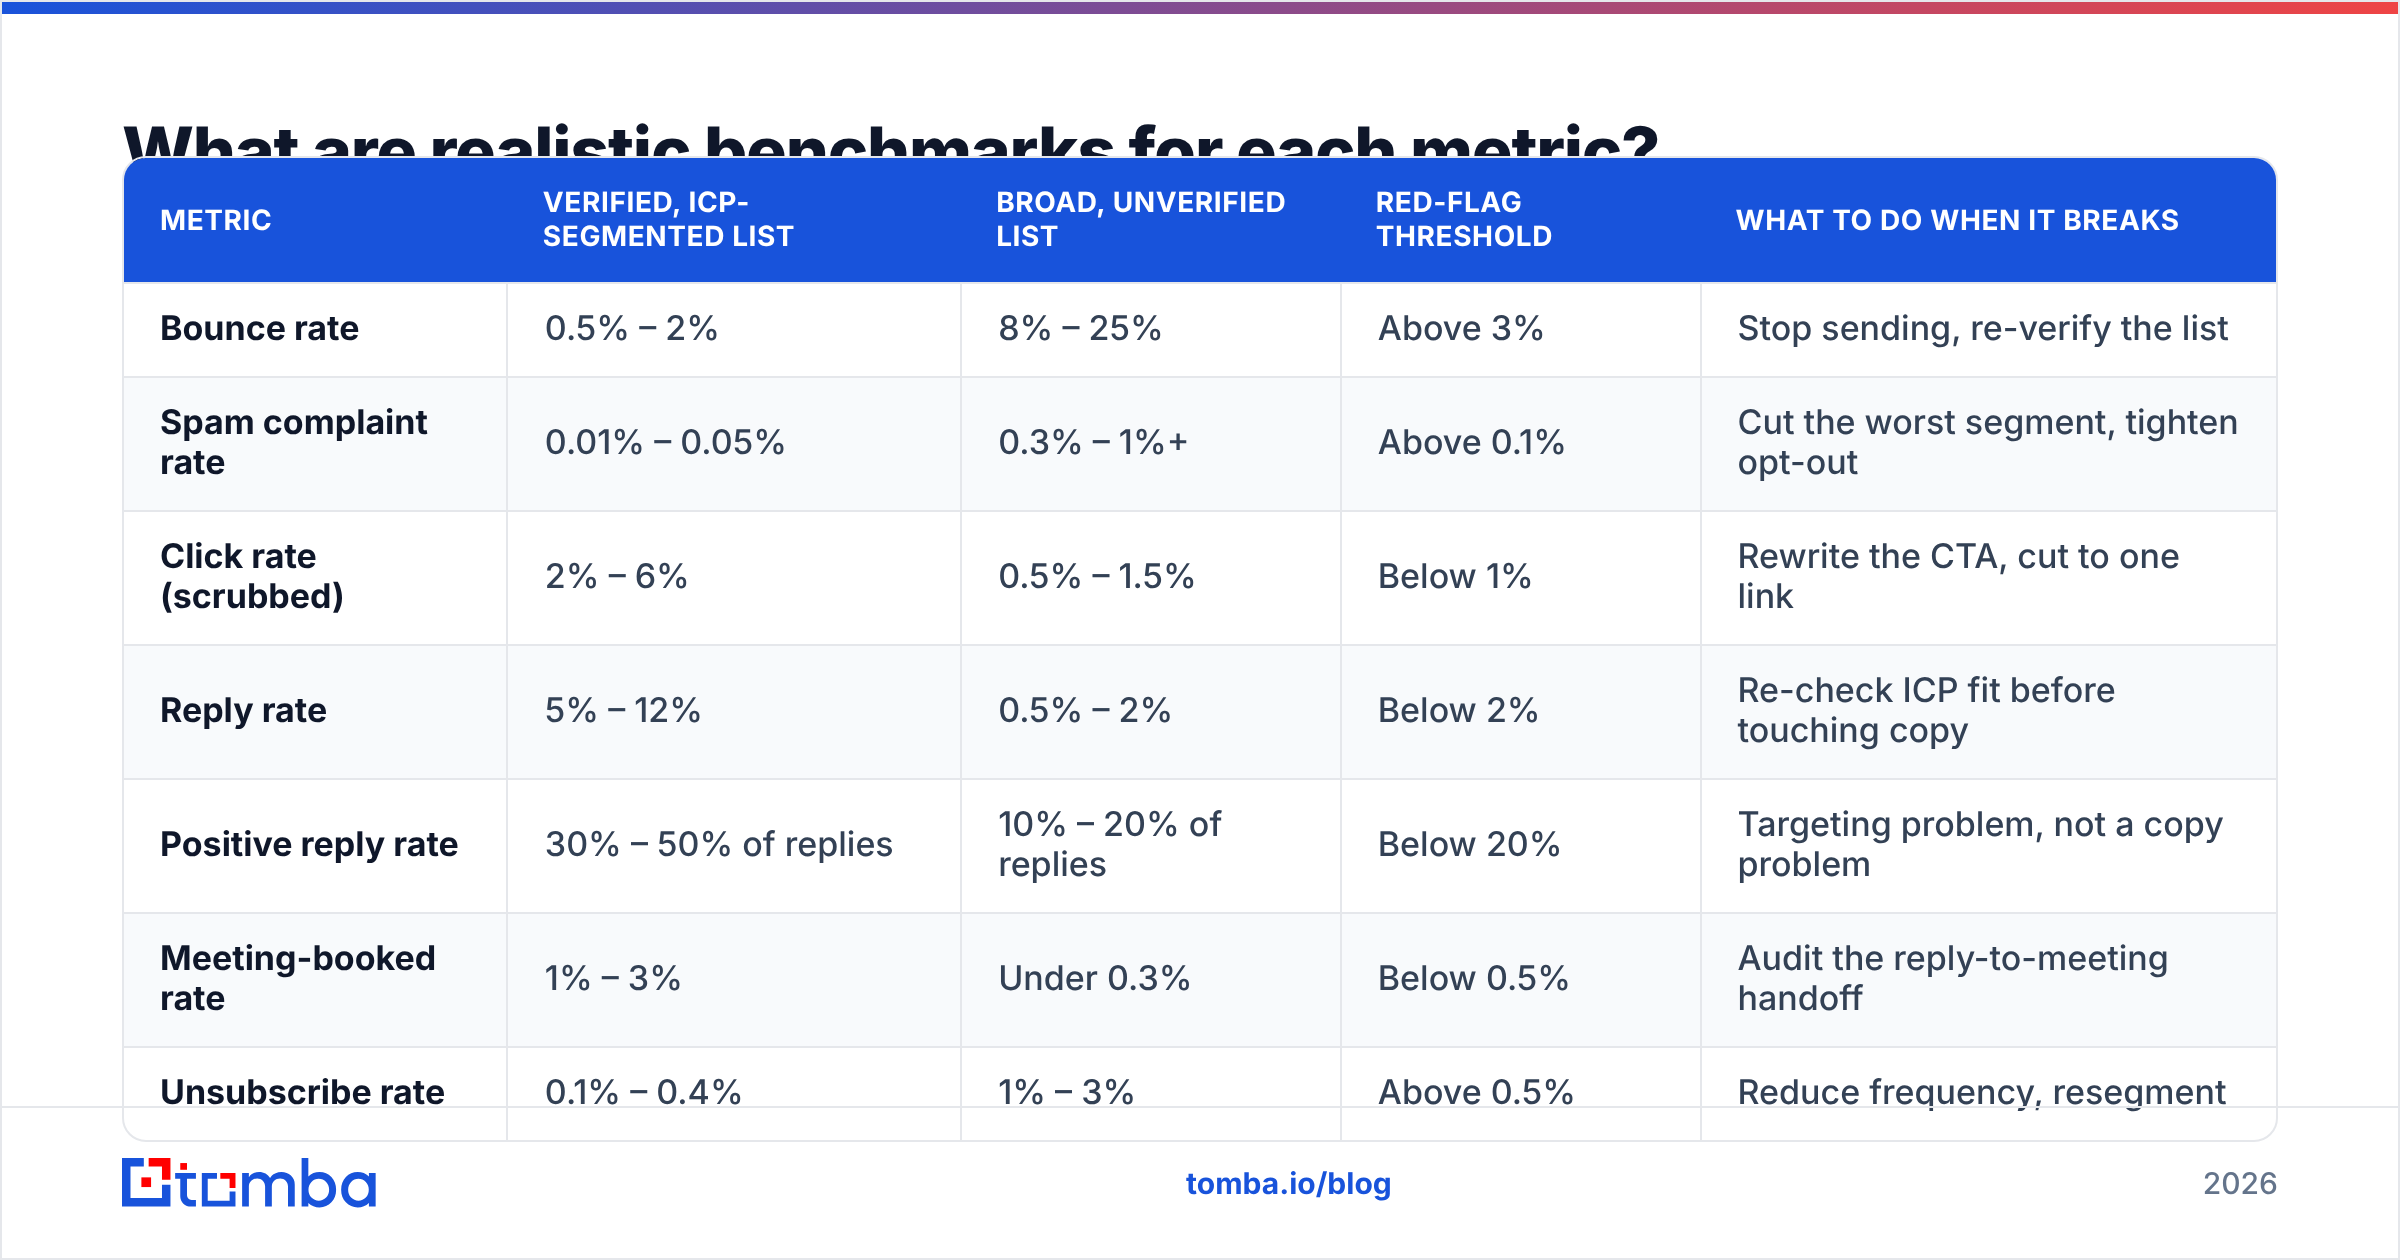
Benchmarks are contextual, but you need a starting line. The table below reflects what well-run B2B outbound teams see on verified, tightly segmented lists versus what a broad, unverified blast produces.
| Metric | Verified, ICP-segmented list | Broad, unverified list | Red-flag threshold | What to do when it breaks |
|---|---|---|---|---|
| Bounce rate | 0.5% – 2% | 8% – 25% | Above 3% | Stop sending, re-verify the list |
| Spam complaint rate | 0.01% – 0.05% | 0.3% – 1%+ | Above 0.1% | Cut the worst segment, tighten opt-out |
| Click rate (scrubbed) | 2% – 6% | 0.5% – 1.5% | Below 1% | Rewrite the CTA, cut to one link |
| Reply rate | 5% – 12% | 0.5% – 2% | Below 2% | Re-check ICP fit before touching copy |
| Positive reply rate | 30% – 50% of replies | 10% – 20% of replies | Below 20% | Targeting problem, not a copy problem |
| Meeting-booked rate | 1% – 3% | Under 0.3% | Below 0.5% | Audit the reply-to-meeting handoff |
| Unsubscribe rate | 0.1% – 0.4% | 1% – 3% | Above 0.5% | Reduce frequency, resegment |
Two caveats. First, industry matters: a 12% reply rate is achievable selling into a 300-account niche and fantasy selling into SMB retail. Second, list size and reply rate are inversely correlated almost without exception — if someone reports a 15% reply rate, ask about the denominator before you copy their playbook. HubSpot's email marketing benchmark research is a reasonable cross-check for marketing-side sends, though outbound sales numbers run on a different curve.
How do the tracking methods compare?#
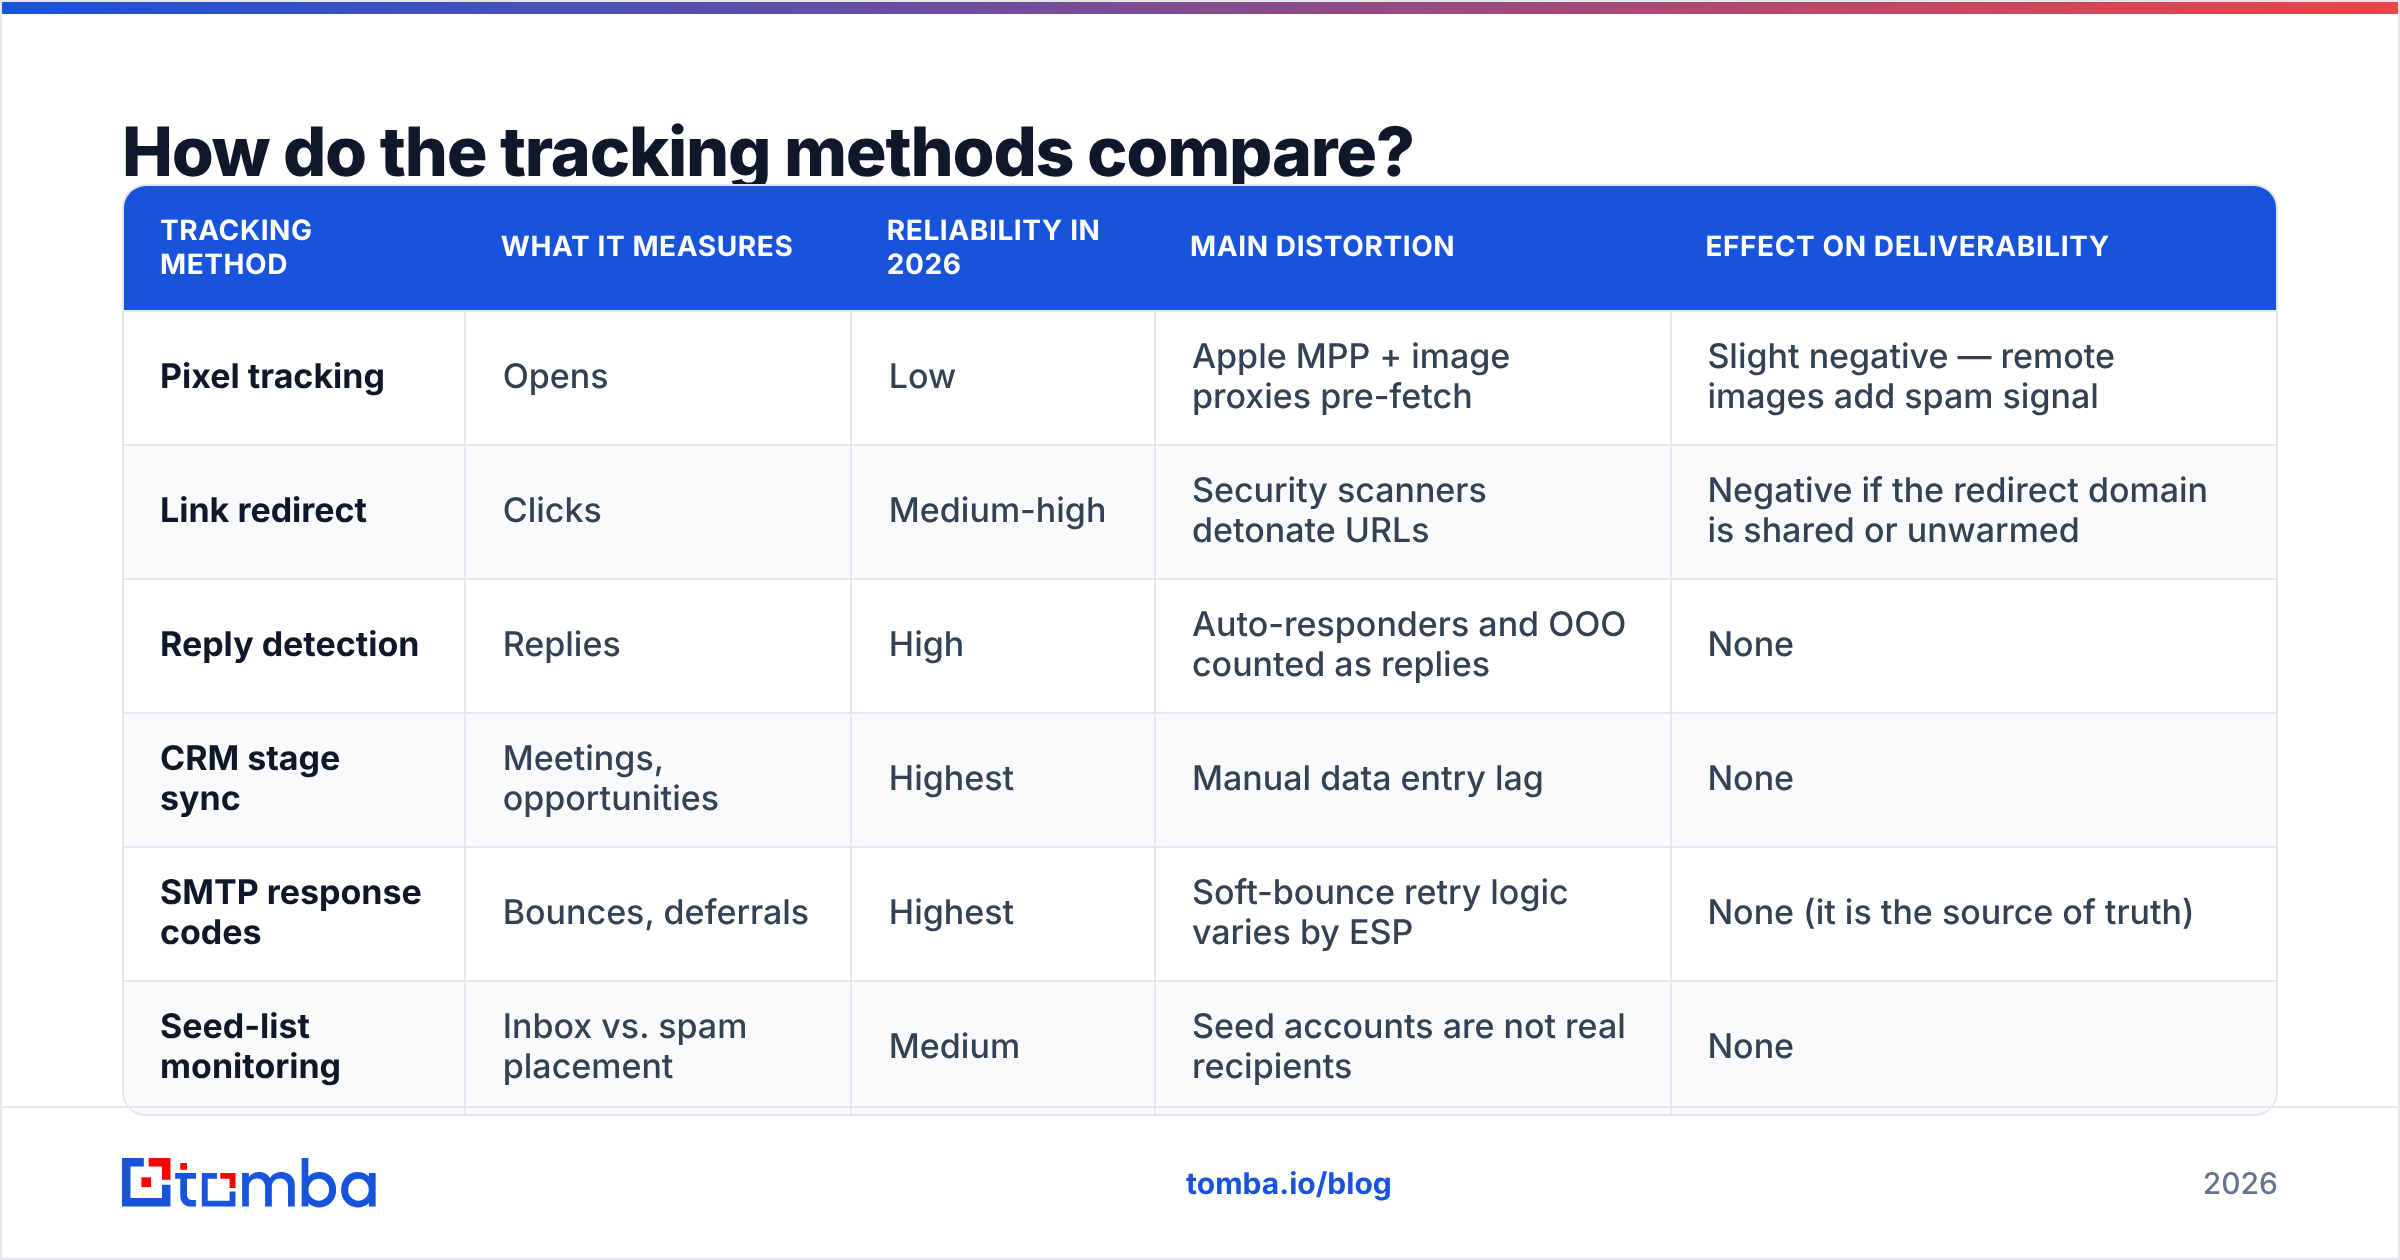
Choosing what to instrument is as important as choosing what to report. Each method has a different failure mode.
| Tracking method | What it measures | Reliability in 2026 | Main distortion | Effect on deliverability |
|---|---|---|---|---|
| Pixel tracking | Opens | Low | Apple MPP + image proxies pre-fetch | Slight negative — remote images add spam signal |
| Link redirect | Clicks | Medium-high | Security scanners detonate URLs | Negative if the redirect domain is shared or unwarmed |
| Reply detection | Replies | High | Auto-responders and OOO counted as replies | None |
| CRM stage sync | Meetings, opportunities | Highest | Manual data entry lag | None |
| SMTP response codes | Bounces, deferrals | Highest | Soft-bounce retry logic varies by ESP | None (it is the source of truth) |
| Seed-list monitoring | Inbox vs. spam placement | Medium | Seed accounts are not real recipients | None |
If you take one operational change from this table: use a dedicated, warmed tracking domain for link redirects, or turn click tracking off entirely on your highest-value sequences. A shared redirect domain that another sender got blacklisted on will drag your placement down with it, and no amount of copy testing recovers from that. Google's Postmaster Tools is the free way to watch domain reputation and complaint rate directly from the receiving side rather than inferring it from your own dashboard.

How do you calculate these metrics correctly?#
Most reporting disputes are denominator disputes. Standardize these definitions once and write them down.
- Bounce rate = hard bounces ÷ total sends. Not ÷ delivered. Using delivered as the denominator hides the problem you are trying to measure.
- Delivery rate = (sends − bounces) ÷ sends. Note that "delivered" means "accepted by the receiving server," not "landed in the inbox." A message accepted and routed to spam counts as delivered.
- Click rate = unique clickers ÷ delivered. Use unique clickers, not total clicks — one curious prospect clicking eight times is not eight signals.
- Click-to-open rate = unique clickers ÷ unique openers. Discard this metric. Its denominator is the broken one.
- Reply rate = unique repliers ÷ delivered. Deduplicate at the contact level, and exclude automatic out-of-office responses or your number inflates by 2 to 4 points.
- Positive reply rate = positive replies ÷ total replies. Classify manually for the first 200 replies before you trust any AI sentiment tagging on it.
- Meeting-booked rate = meetings held ÷ contacts emailed. Held, not scheduled. No-shows are a different problem with a different fix.
One more rule: report all of these per sequence and per segment. An aggregate reply rate across five sequences and three personas is an average of averages, and it will point you at the wrong fix every time.
What is the difference between deliverability metrics and engagement metrics?#
Deliverability metrics describe whether the mailbox provider trusts you. Engagement metrics describe whether the human trusts you. They fail in a specific order, and diagnosing them out of order wastes weeks.
The sequence is always: data quality → deliverability → engagement → revenue.
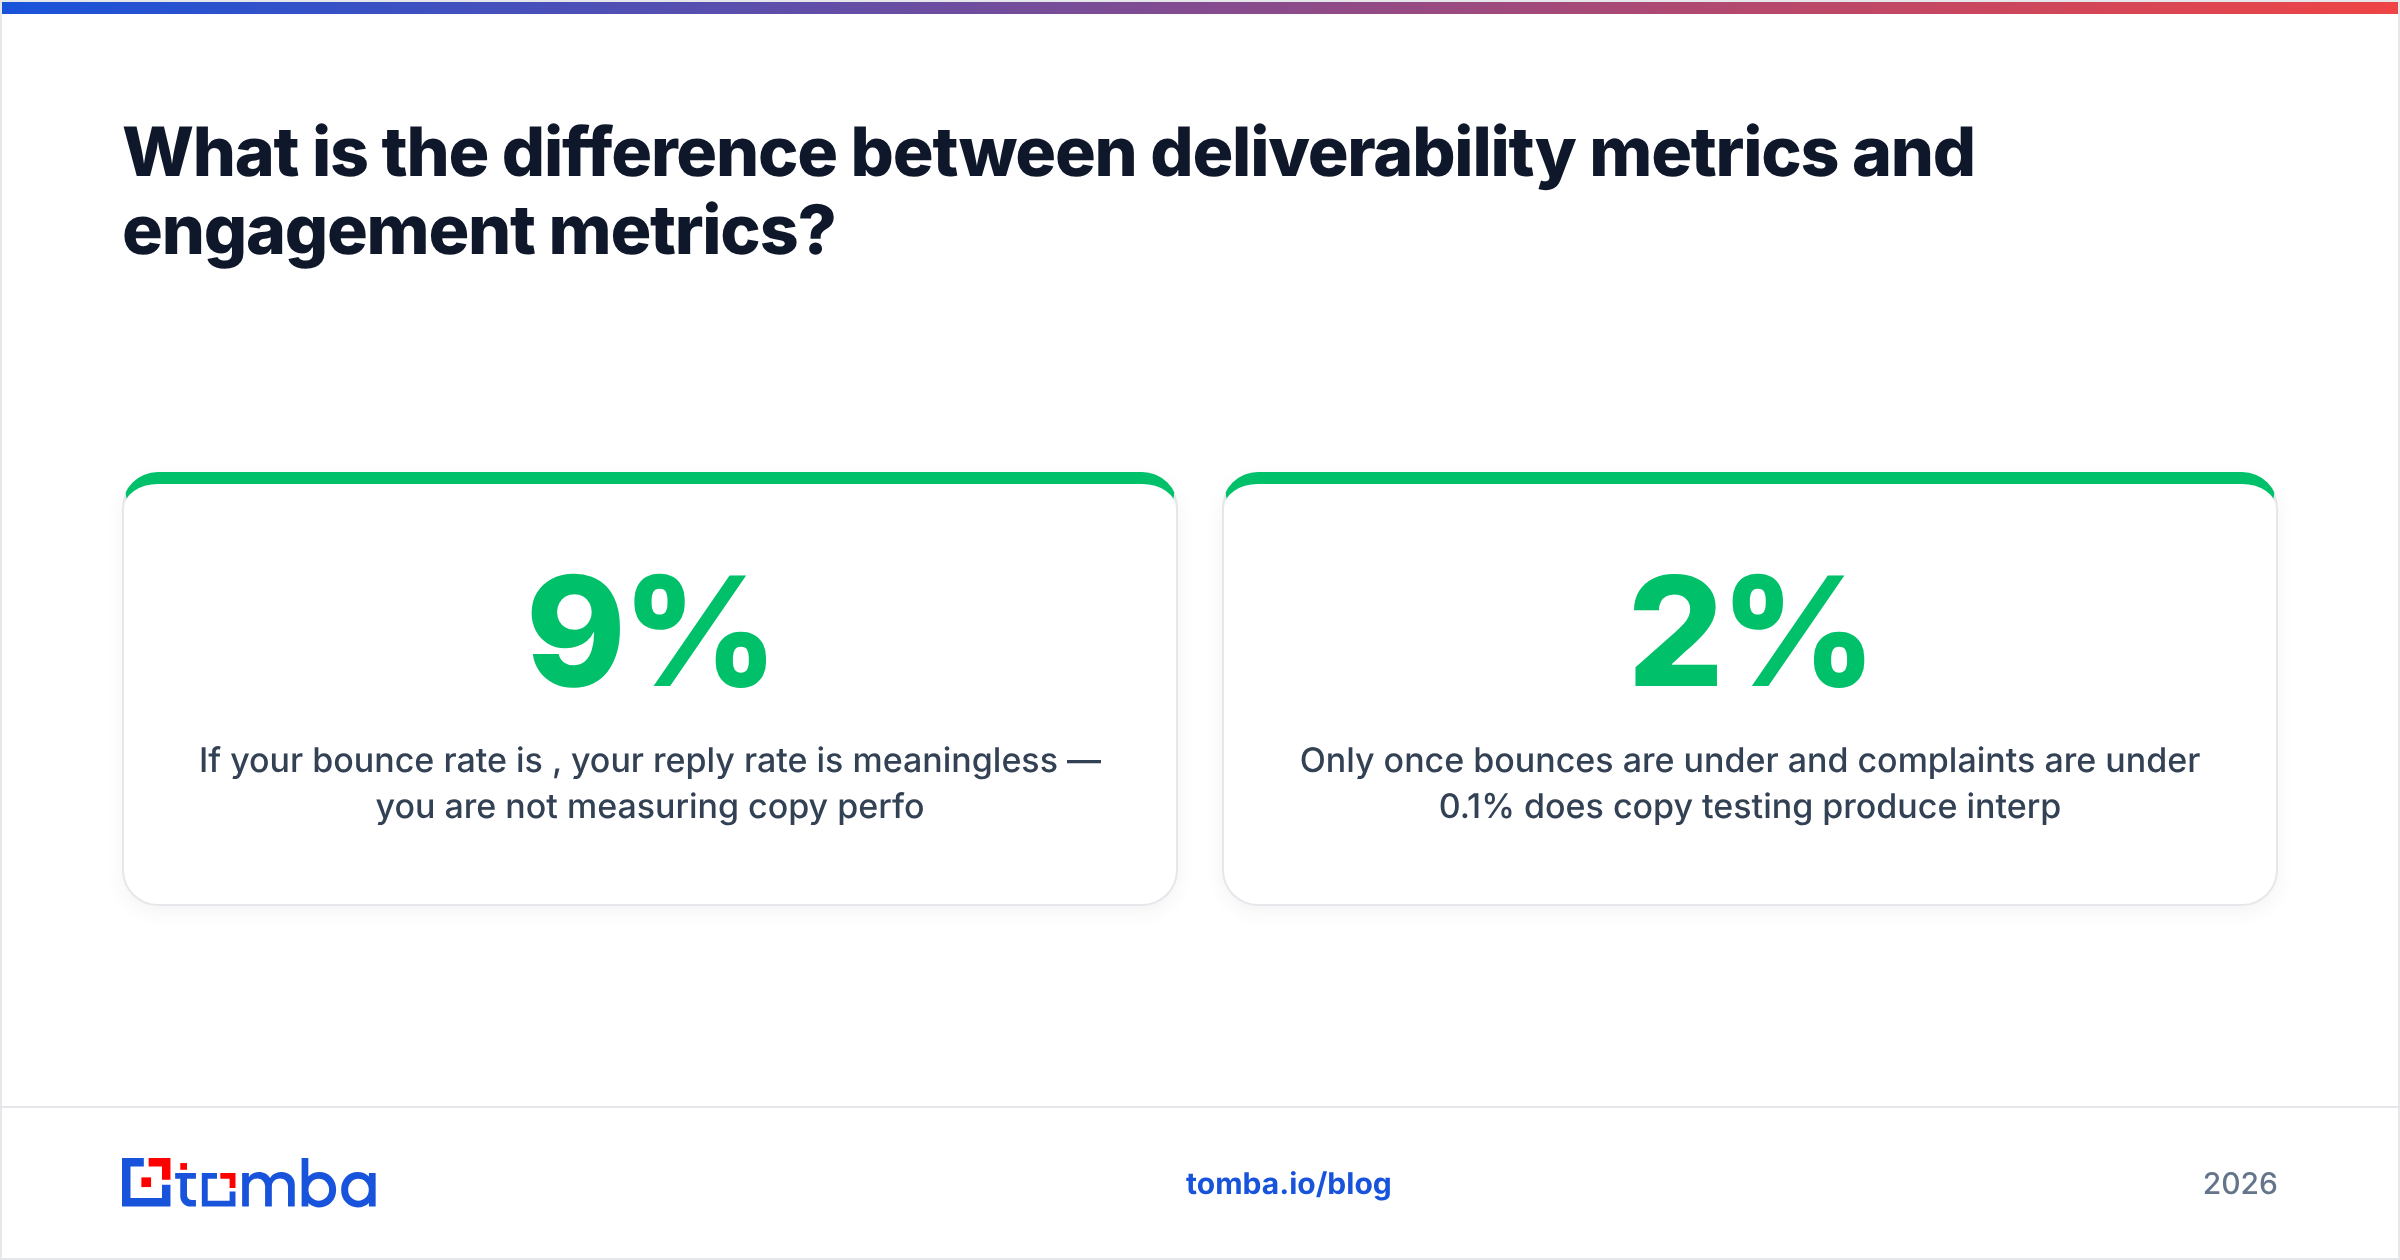
If your bounce rate is 9%, your reply rate is meaningless — you are not measuring copy performance, you are measuring how much of your list is fictional. Fix the data layer first. That means running the list through an email verifier before the first send, handling catch-all domains as a separate risk bucket, and re-verifying anything older than 90 days. B2B contact data decays at roughly 2 to 3% per month as people change jobs; a list you bought in January is materially different by June.
Only once bounces are under 2% and complaints are under 0.1% does copy testing produce interpretable results. At that point, subject line and CTA work actually moves the number — and you can use a subject line tester to screen for spam-trigger phrasing before you burn a segment on the experiment. For the full mechanics of what mailbox providers score, the email deliverability fundamentals are worth reading alongside your metrics work.
How do you build a dashboard reps will actually use?#
Build it backwards. Most dashboards start with sends and work down, which puts the least meaningful number in the largest tile.
Structure it in three tiers:
- Tier 1 — the only tier leadership sees. Meetings booked, positive replies, opportunities created. Three numbers, trended weekly, segmented by sequence.
- Tier 2 — the diagnostic tier. Reply rate, click rate (scrubbed), unsubscribe rate. Reps check this when Tier 1 drops.
- Tier 3 — the health tier. Bounce rate, spam complaint rate, domain reputation, inbox placement from seed tests. Reviewed by whoever owns infrastructure, checked daily, alerted on thresholds.
Set alerts, not reports, on Tier 3. Nobody reads a weekly bounce-rate email; everybody reads a Slack alert that says bounce rate crossed 3% on the sequence that launched an hour ago. That single alert has saved more sending domains than any amount of copy optimization.
And retire open rate from all three tiers. If you must keep it, label it "opens (unreliable)" so nobody builds a decision on it. The label costs nothing and prevents a quarter of bad conclusions.
What are the most common measurement mistakes?#
- Comparing this month's opens to last year's. MPP adoption keeps climbing, so the trendline is measuring privacy settings, not interest.
- Counting auto-replies as replies. Out-of-office messages will happily give you a 4% reply rate on a dead list.
- A/B testing on too small a sample. At a 5% reply rate you need roughly 1,500 contacts per variant to detect a 2-point lift with any confidence. Most sales tests run on 200 and declare a winner.
- Optimizing click rate on a sequence whose goal is a reply. If the CTA is "worth a conversation?", a click is a distraction. Different goal, different metric.
- Ignoring the reply-to-meeting gap. A team with a strong reply rate and a weak meeting rate has a follow-up problem, not a prospecting problem, and no amount of new list building fixes it.
- Blending inbound and outbound in one report. Inbound replies to a nurture email and cold outbound replies are different behaviors with different benchmarks. Averaging them produces a number that describes neither.
Where should you start this week?#
Pull your last 30 days of sends and calculate exactly two numbers: bounce rate against total sends, and positive replies against delivered. If bounce rate is above 3%, stop every active sequence today and fix the data before you touch anything else. If bounce rate is clean but positive reply rate is under 20% of replies, your targeting is the problem and your copy is innocent.
Clean data is the cheapest lever in the entire stack, and it is the one most teams skip. When you source contacts with the Tomba Email Finder, addresses are validated at discovery rather than after a campaign has already burned your domain reputation — which is the difference between a 1% bounce rate and a metrics dashboard you cannot trust. The free tier covers 25 searches a month if you want to test the accuracy against a list you already have, and paid plans start at $49/mo on Tomba pricing when you are ready to run it at volume.
Measure what a proxy server cannot fake. Everything else is decoration.
Related guides#
Ready to find emails that actually work?
Join 150,000+ professionals who stopped guessing and started sending. Free credits on signup — no credit card required.
Get the Tomba newsletter
Practical outbound tactics and product updates — once every two weeks.
About the author