Enterprise Demand Generation: The 2026 Playbook That Works
Most enterprise demand generation programs measure the wrong thing, spend against the wrong unit, and starve the accounts that actually close. Here is the model, budget split, and metric set that survive a real enterprise sales cycle.
TL;DR
- Enterprise demand generation is account-unit work, not lead-unit work. If your dashboard counts MQLs and your sales cycle runs 9–18 months, you are optimizing a number that cannot predict revenue.
- The average enterprise purchase now involves 6–11 stakeholders. Covering 2 of them and calling the account "engaged" is the single most common failure mode.
- Budget splits that work in 2026 look roughly like 40% always-on demand capture, 35% account-based programs, 25% brand and category creation — not 80% paid search.
- Contact data quality is the hidden constraint. A perfect ABM plan collapses when 30% of your committee contacts bounce or belong to someone who left 14 months ago.
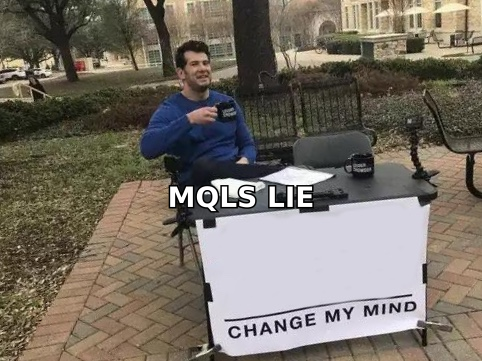
- Measure coverage, engagement depth, and pipeline velocity per account. Retire MQL as a primary KPI; keep it as a diagnostic at best.
What is enterprise demand generation?#
Enterprise demand generation is the practice of creating, capturing, and converting buying interest inside large organizations — companies with formal procurement, multi-person buying committees, and deal cycles measured in quarters rather than weeks.
The everyday analogy: SMB demand gen is running a food truck. One person decides, pays, and eats. Enterprise demand gen is catering a wedding. There is a bride, a mother-in-law, a venue coordinator, a budget holder, and a legal contract — and any one of them can kill the booking. You do not sell harder to the bride. You make sure every seat at the table has been fed the right information at the right moment.
Technically, the difference is the unit of measurement. SMB programs optimize cost per lead. Enterprise programs optimize account coverage and committee engagement, because a "lead" from a 40,000-person company tells you almost nothing on its own. A director of IT downloading a whitepaper could be a champion, a researcher, a competitor, or an intern.
Three things separate enterprise demand generation from everything else:
- Multi-threaded buying. Gartner's research on B2B buying has consistently found that enterprise purchases involve a large group of stakeholders, and that group spends most of its time not talking to vendors at all.
- Non-linear journeys. The committee loops. Legal enters at month four, exits, and re-enters at month seven. Attribution models built for a linear funnel misreport almost every touch.
- Long feedback loops. A campaign you launch in Q1 shows up as closed revenue in Q4 or later. Programs get cancelled at month three because nobody built a leading indicator that reports before the lagging one does.
How does enterprise demand generation differ from SMB demand gen?#
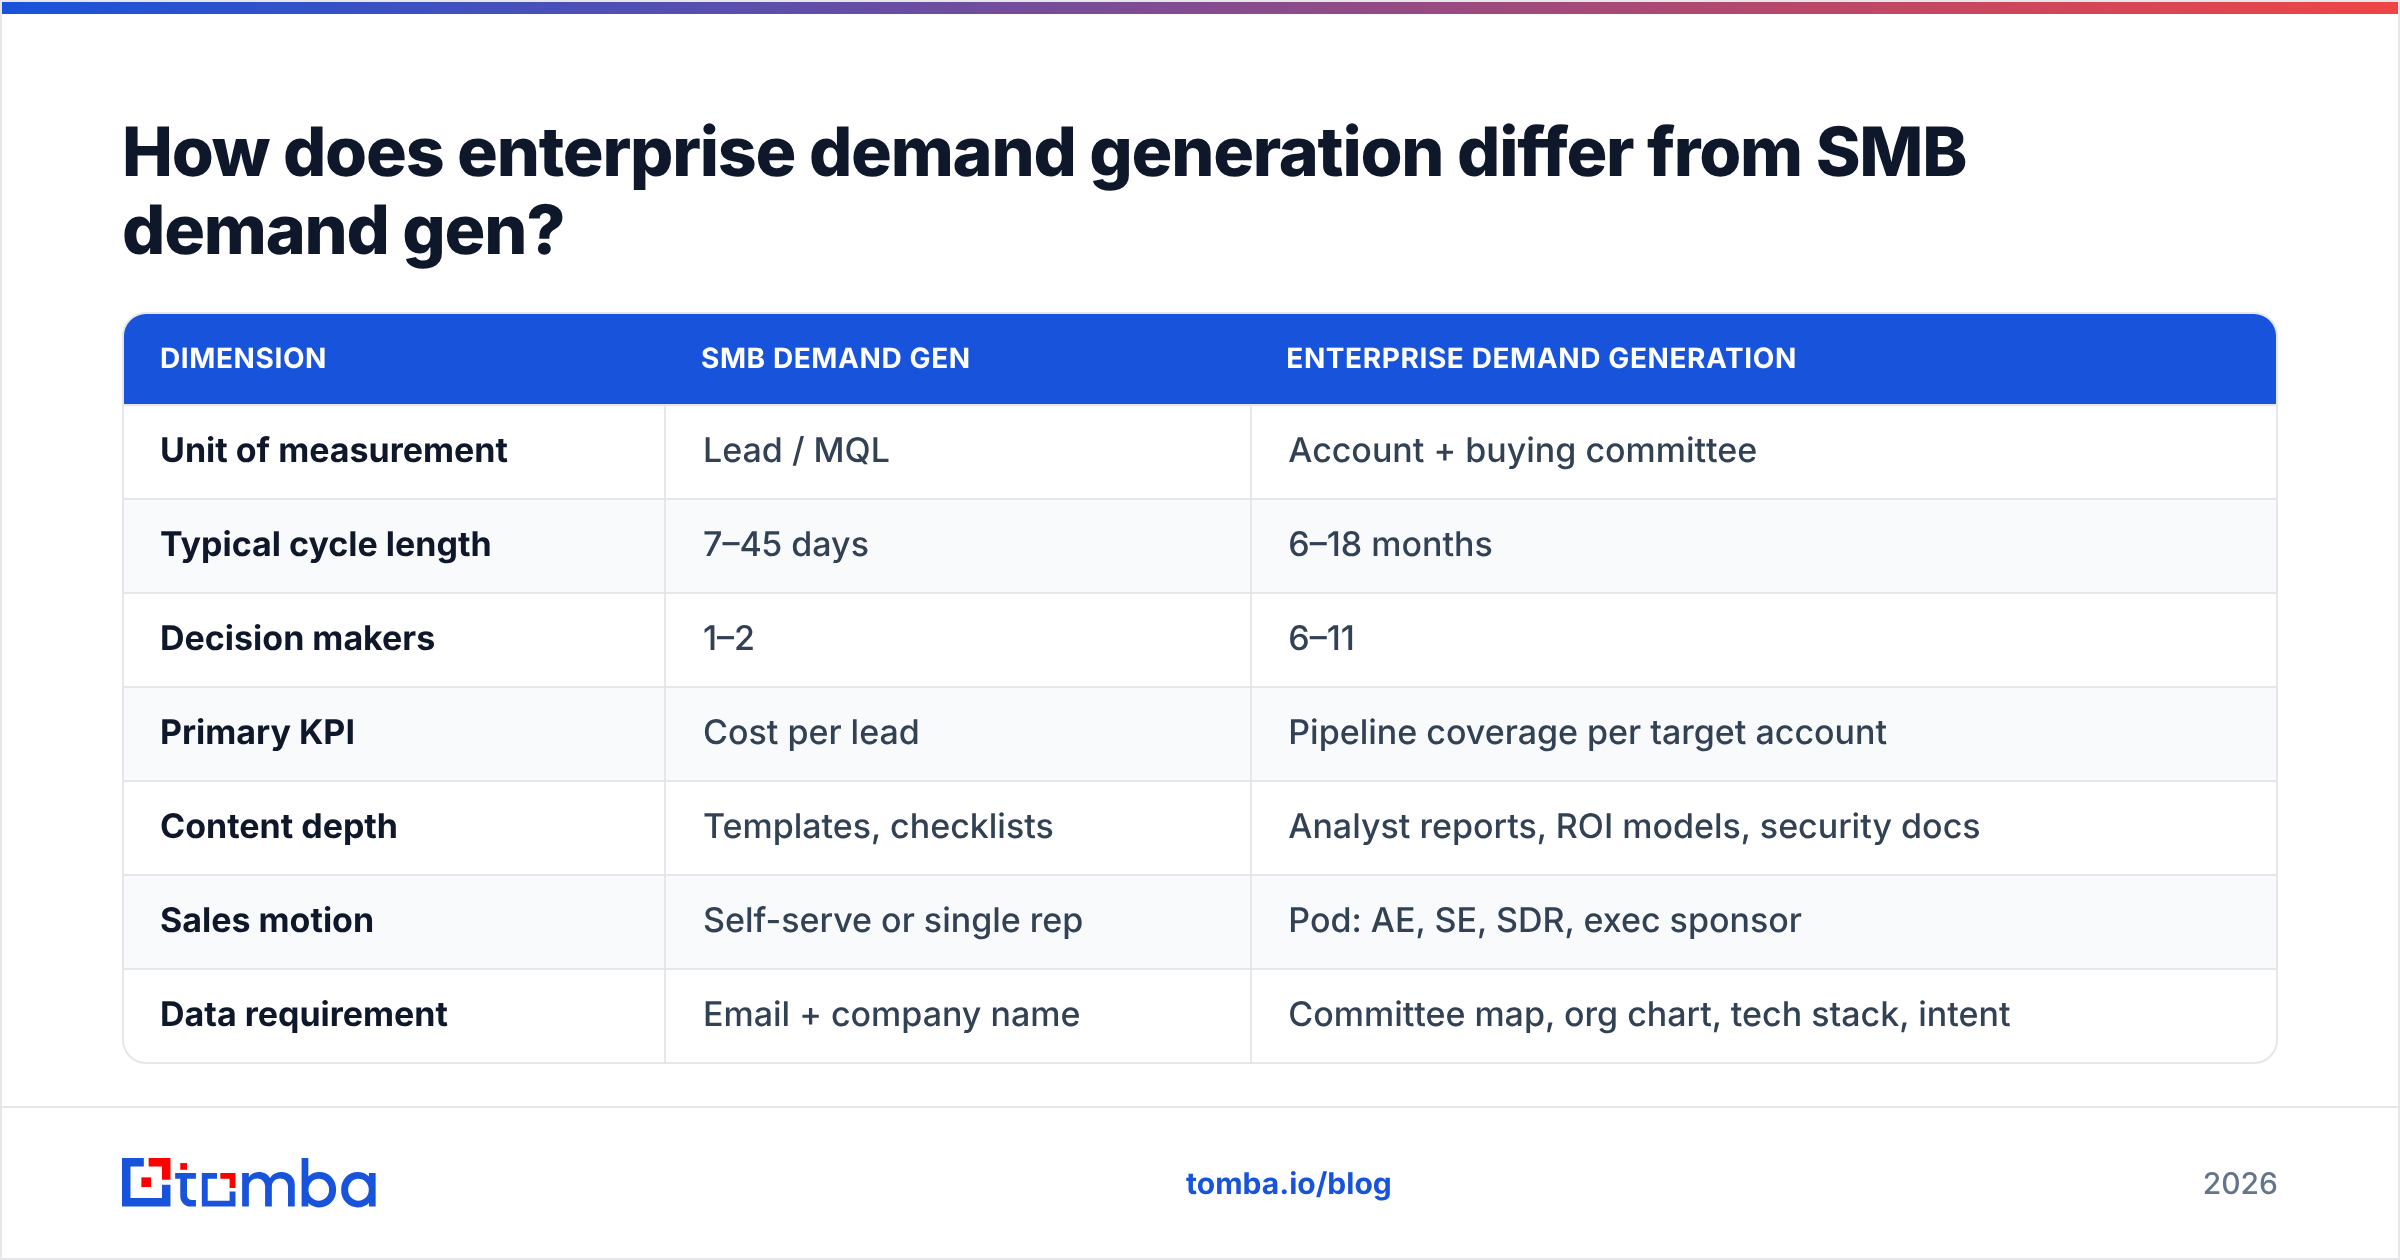
The tactics look superficially similar — content, paid, events, email. What changes is almost everything underneath.
| Dimension | SMB demand gen | Enterprise demand generation |
|---|---|---|
| Unit of measurement | Lead / MQL | Account + buying committee |
| Typical cycle length | 7–45 days | 6–18 months |
| Decision makers | 1–2 | 6–11 |
| Primary KPI | Cost per lead | Pipeline coverage per target account |
| Content depth | Templates, checklists | Analyst reports, ROI models, security docs |
| Sales motion | Self-serve or single rep | Pod: AE, SE, SDR, exec sponsor |
| Data requirement | Email + company name | Committee map, org chart, tech stack, intent |
| Attribution model | Last touch works fine | Multi-touch + qualitative deal review |
| Cost of bad data | Wasted send | Wasted quarter |
The last row is the one teams underestimate. In an SMB program, a bad email address costs you one send. In an enterprise program, a bad email for the VP of Security means your entire sequence reaches five of six committee members, the deal stalls at security review, and nobody can explain why for eleven weeks.
Why do enterprise demand generation programs fail?#
Four failure modes account for most of it.
1. Volume math applied to committee reality. Marketing hits its MQL target, sales says the leads are garbage, and both are correct. 800 MQLs spread thin across 4,000 accounts is worse than 200 contacts concentrated across 40 target accounts. Coverage beats count.
2. Single-threaded engagement. One champion engages, the team declares the account "hot," and the deal dies when that champion changes jobs. Enterprise tenure is short. Assume your champion has a meaningful chance of leaving mid-cycle and build for it.
3. Content that stops at the top of the funnel. Most enterprise programs produce awareness content abundantly and procurement content almost never. The security questionnaire response, the ROI calculator, the implementation timeline, the reference architecture — that is what unlocks month seven, and it usually does not exist.
4. Data decay nobody budgets for. B2B contact data degrades roughly 25–30% per year through job changes, restructures, and domain migrations. An account list built in January is materially wrong by September. Teams treat data as a one-time purchase instead of a maintained asset.
That fourth point is where revenue operations earns its keep. Somebody has to own the refresh cadence, and it is not the AE with a quota.
What does a working enterprise demand generation model look like in 2026?#
Here is the structure that holds up across most enterprise motions. Run these six layers concurrently, not sequentially.
- Account selection and tiering. Score your total addressable market on fit signals (firmographic, technographic, regulatory) and split into Tier 1 (1:1, ~25–50 accounts), Tier 2 (1:few, ~200–500), Tier 3 (1:many, everything else). Each tier gets a different cost-per-account ceiling.
- Committee mapping. For every Tier 1 and Tier 2 account, document the roles you must reach — economic buyer, technical evaluator, end-user champion, security, procurement, and the executive sponsor. Named humans with verified contact details, not job titles in a spreadsheet.
- Demand capture (always-on). Branded search, category search, review sites, comparison pages, and product-led entry points. This catches buyers already in market. It is the cheapest pipeline you will ever buy and it caps out fast.
- Demand creation (programmatic). Original research, executive events, podcasts, analyst relations, and point-of-view content aimed at the 95% of your market not currently buying. Slow, compounding, and the only thing that grows the capture layer over time.
- Account-based orchestration. Coordinated sequences across email, LinkedIn, paid social, direct mail, and SDR calling — synchronized so a committee sees a consistent message within the same two-week window rather than random touches across six months.
- Sales-marketing handoff and feedback. Weekly deal reviews where marketing hears why deals stalled, and monthly list hygiene where sales flags dead contacts. Without this loop the whole model degrades into guesswork within two quarters.
How should you split an enterprise demand generation budget?#
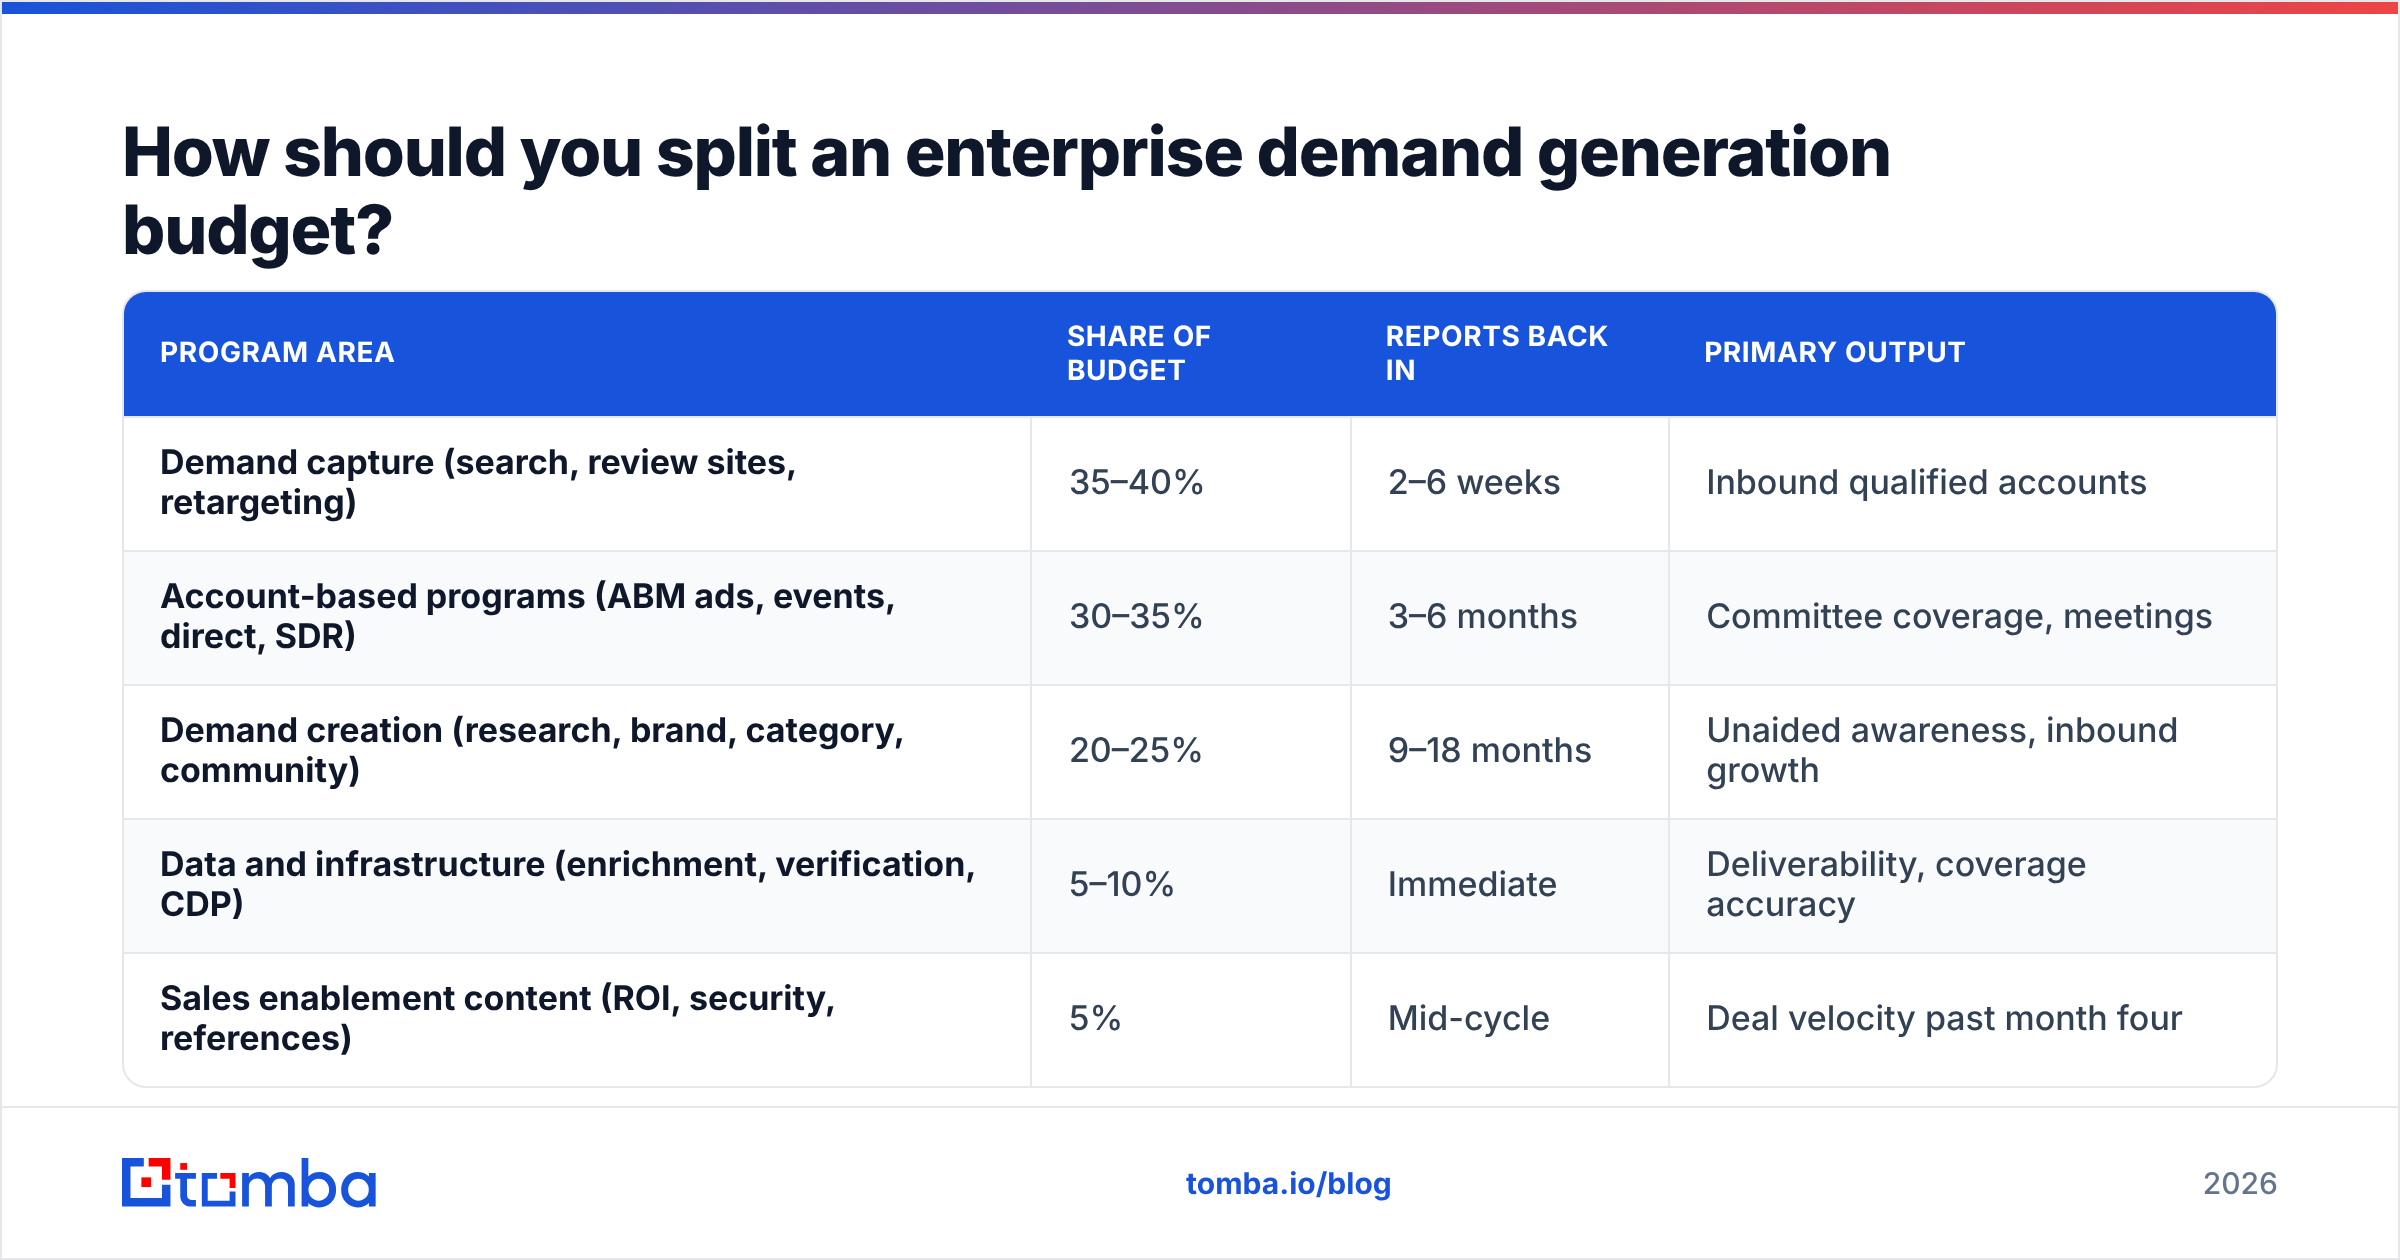
There is no universal split, but the shape below reflects what mature enterprise programs converge on. The failure pattern is over-indexing on capture because it reports fastest.
| Program area | Share of budget | Reports back in | Primary output |
|---|---|---|---|
| Demand capture (search, review sites, retargeting) | 35–40% | 2–6 weeks | Inbound qualified accounts |
| Account-based programs (ABM ads, events, direct, SDR) | 30–35% | 3–6 months | Committee coverage, meetings |
| Demand creation (research, brand, category, community) | 20–25% | 9–18 months | Unaided awareness, inbound growth |
| Data and infrastructure (enrichment, verification, CDP) | 5–10% | Immediate | Deliverability, coverage accuracy |
| Sales enablement content (ROI, security, references) | 5% | Mid-cycle | Deal velocity past month four |
The data line is the one that gets cut first and hurts most. If enrichment and verification sit at 2% of budget, expect roughly a fifth of your account-based spend to land on contacts who no longer exist. Vendor directories like G2 are useful for shortlisting tooling here, but treat category grids as a starting filter, not a verdict.
Which channels actually produce enterprise pipeline?#
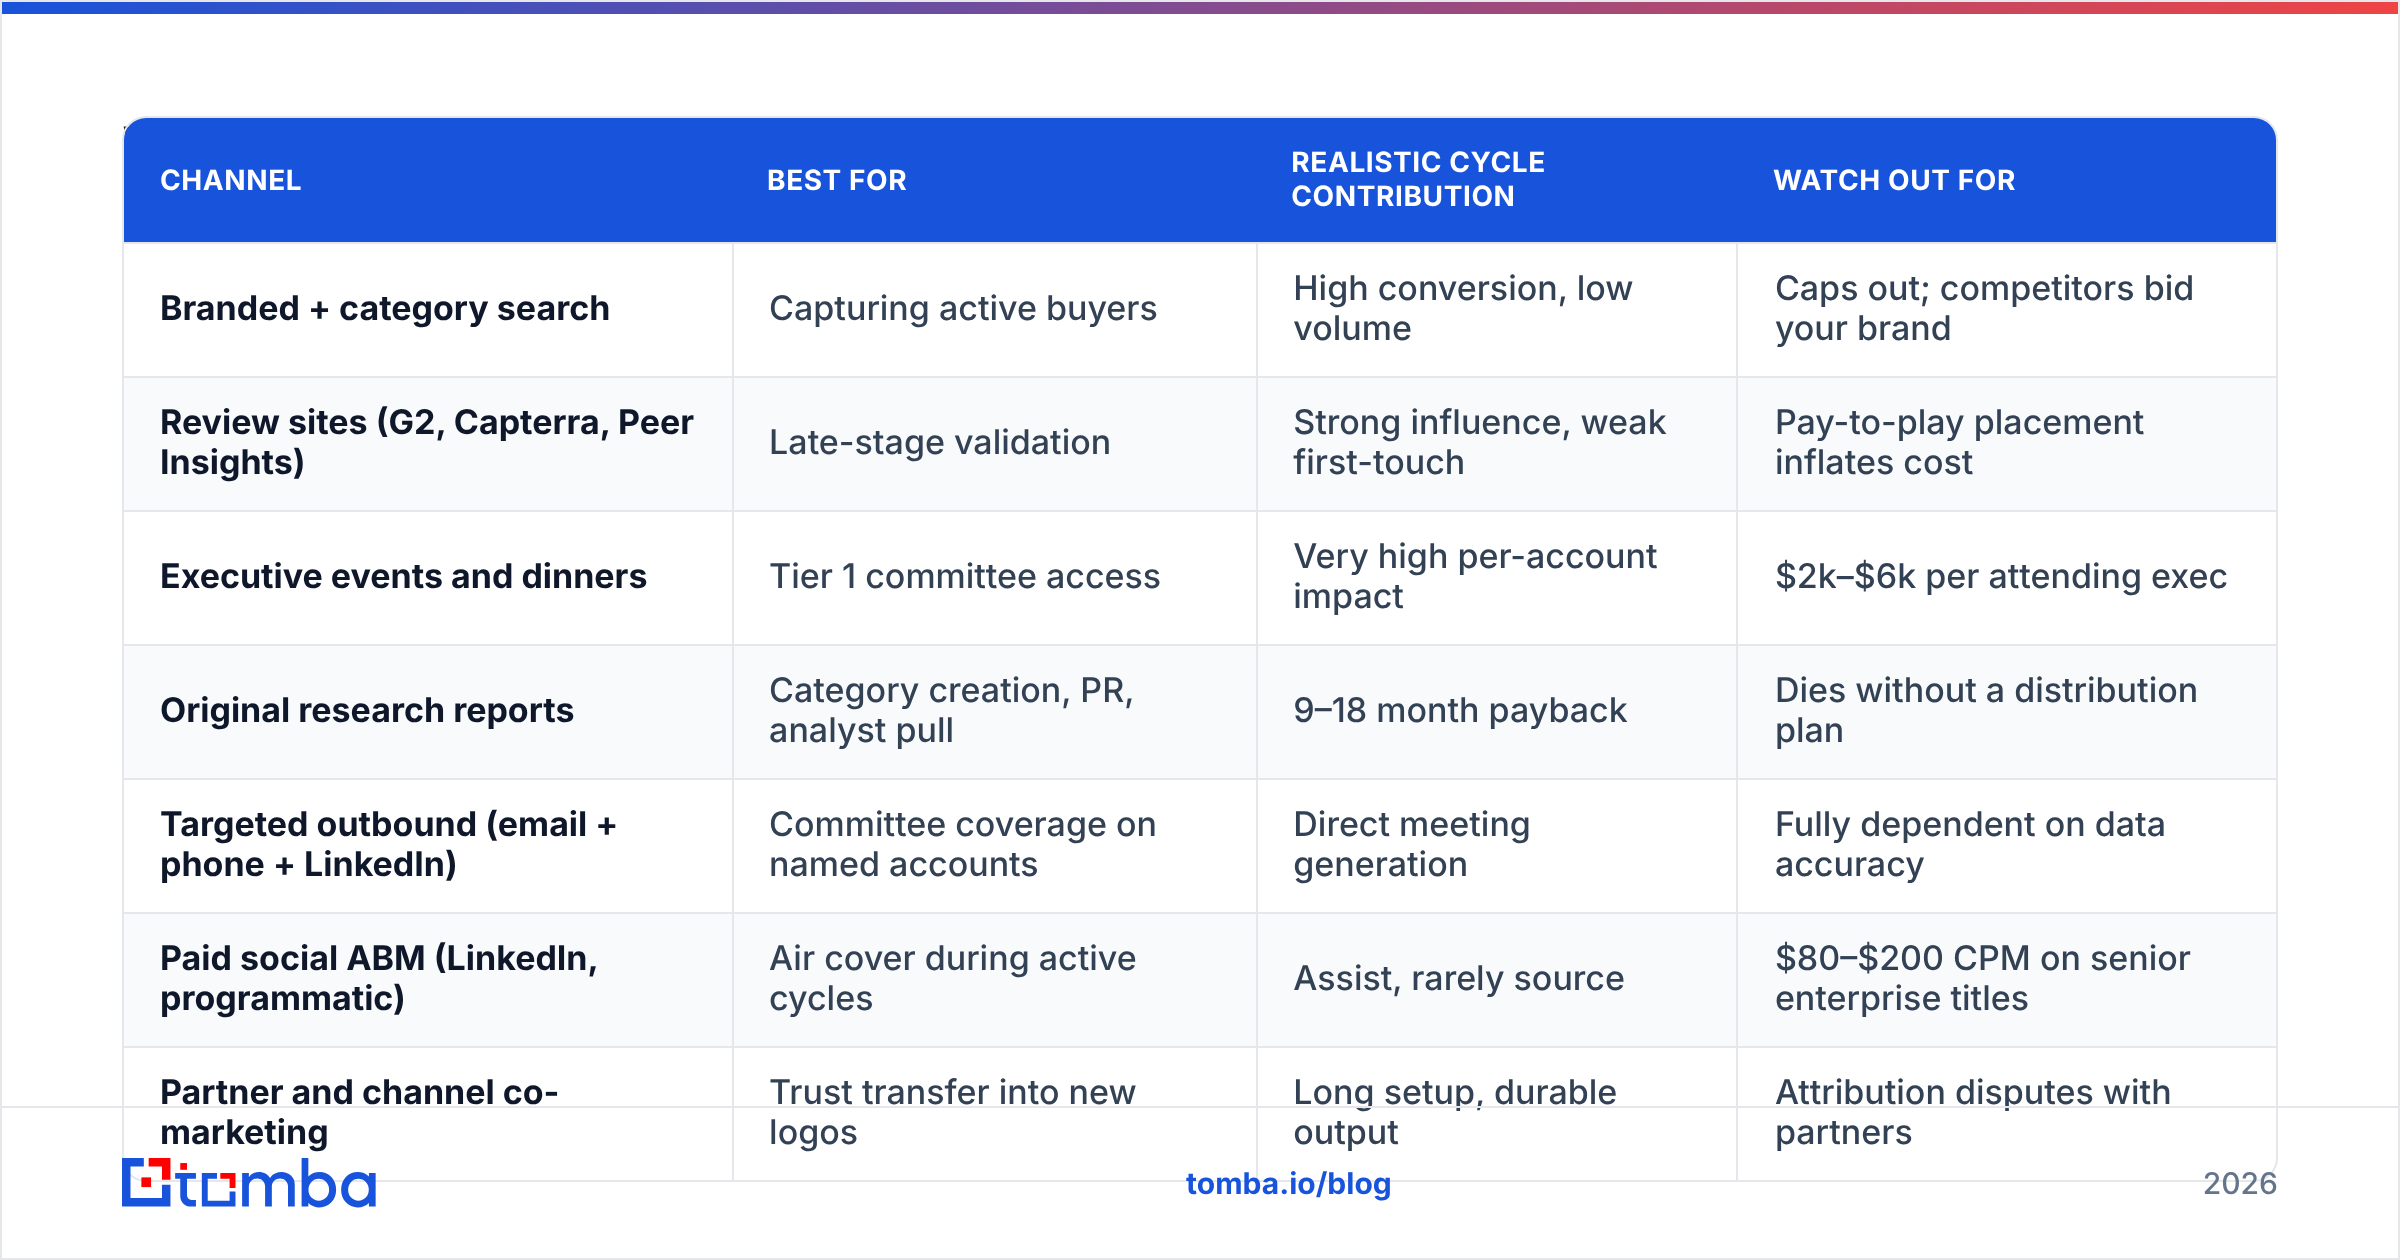
Channel performance in enterprise looks nothing like SMB benchmarks. Here is a realistic comparison of what each channel does and does not do.
| Channel | Best for | Realistic cycle contribution | Watch out for |
|---|---|---|---|
| Branded + category search | Capturing active buyers | High conversion, low volume | Caps out; competitors bid your brand |
| Review sites (G2, Capterra, Peer Insights) | Late-stage validation | Strong influence, weak first-touch | Pay-to-play placement inflates cost |
| Executive events and dinners | Tier 1 committee access | Very high per-account impact | $2k–$6k per attending exec |
| Original research reports | Category creation, PR, analyst pull | 9–18 month payback | Dies without a distribution plan |
| Targeted outbound (email + phone + LinkedIn) | Committee coverage on named accounts | Direct meeting generation | Fully dependent on data accuracy |
| Paid social ABM (LinkedIn, programmatic) | Air cover during active cycles | Assist, rarely source | $80–$200 CPM on senior enterprise titles |
| Partner and channel co-marketing | Trust transfer into new logos | Long setup, durable output | Attribution disputes with partners |
| Webinars | Mid-funnel education | Moderate, decaying | Registration ≠ attendance ≠ intent |
Note what is missing: nothing here is a silver bullet. Enterprise pipeline is produced by the overlap of three or four of these hitting the same account within the same window. Forrester's B2B research has been making this argument for years — buying groups respond to consistency across channels, not intensity within one.
What data infrastructure does enterprise demand generation require?#
Strip away the platform marketing and there are four data jobs.
Account resolution. Mapping website visitors, form fills, and free-tier signups back to a parent company — including subsidiaries that use different domains. A visitor from a regional subsidiary domain should light up the Tier 1 parent account, and most stacks silently fail at this.
Committee discovery. Finding the humans behind the roles you need. This is where a domain search approach beats buying a static list: you query the current state of an organization instead of trusting a snapshot from a database refresh cycle you do not control.
Verification before send. Every contact should be verified at the point of use, not at the point of purchase. The gap between "the list said this was valid in March" and "it is August" is where sender reputation goes to die. Route everything through email verification before it enters a sequence.
Continuous enrichment. Job changes are a buying signal, not just a data problem. When your former champion turns up at a new logo, that is the warmest outbound you will ever send. This requires contact enrichment running on a schedule, not as a quarterly cleanup project.
For teams working through hundreds of accounts at once, batch operations matter more than a slick UI. A bulk email finder workflow that processes an entire tier list in one pass beats manual lookups by an order of magnitude in operator time.
How do you measure enterprise demand generation?#
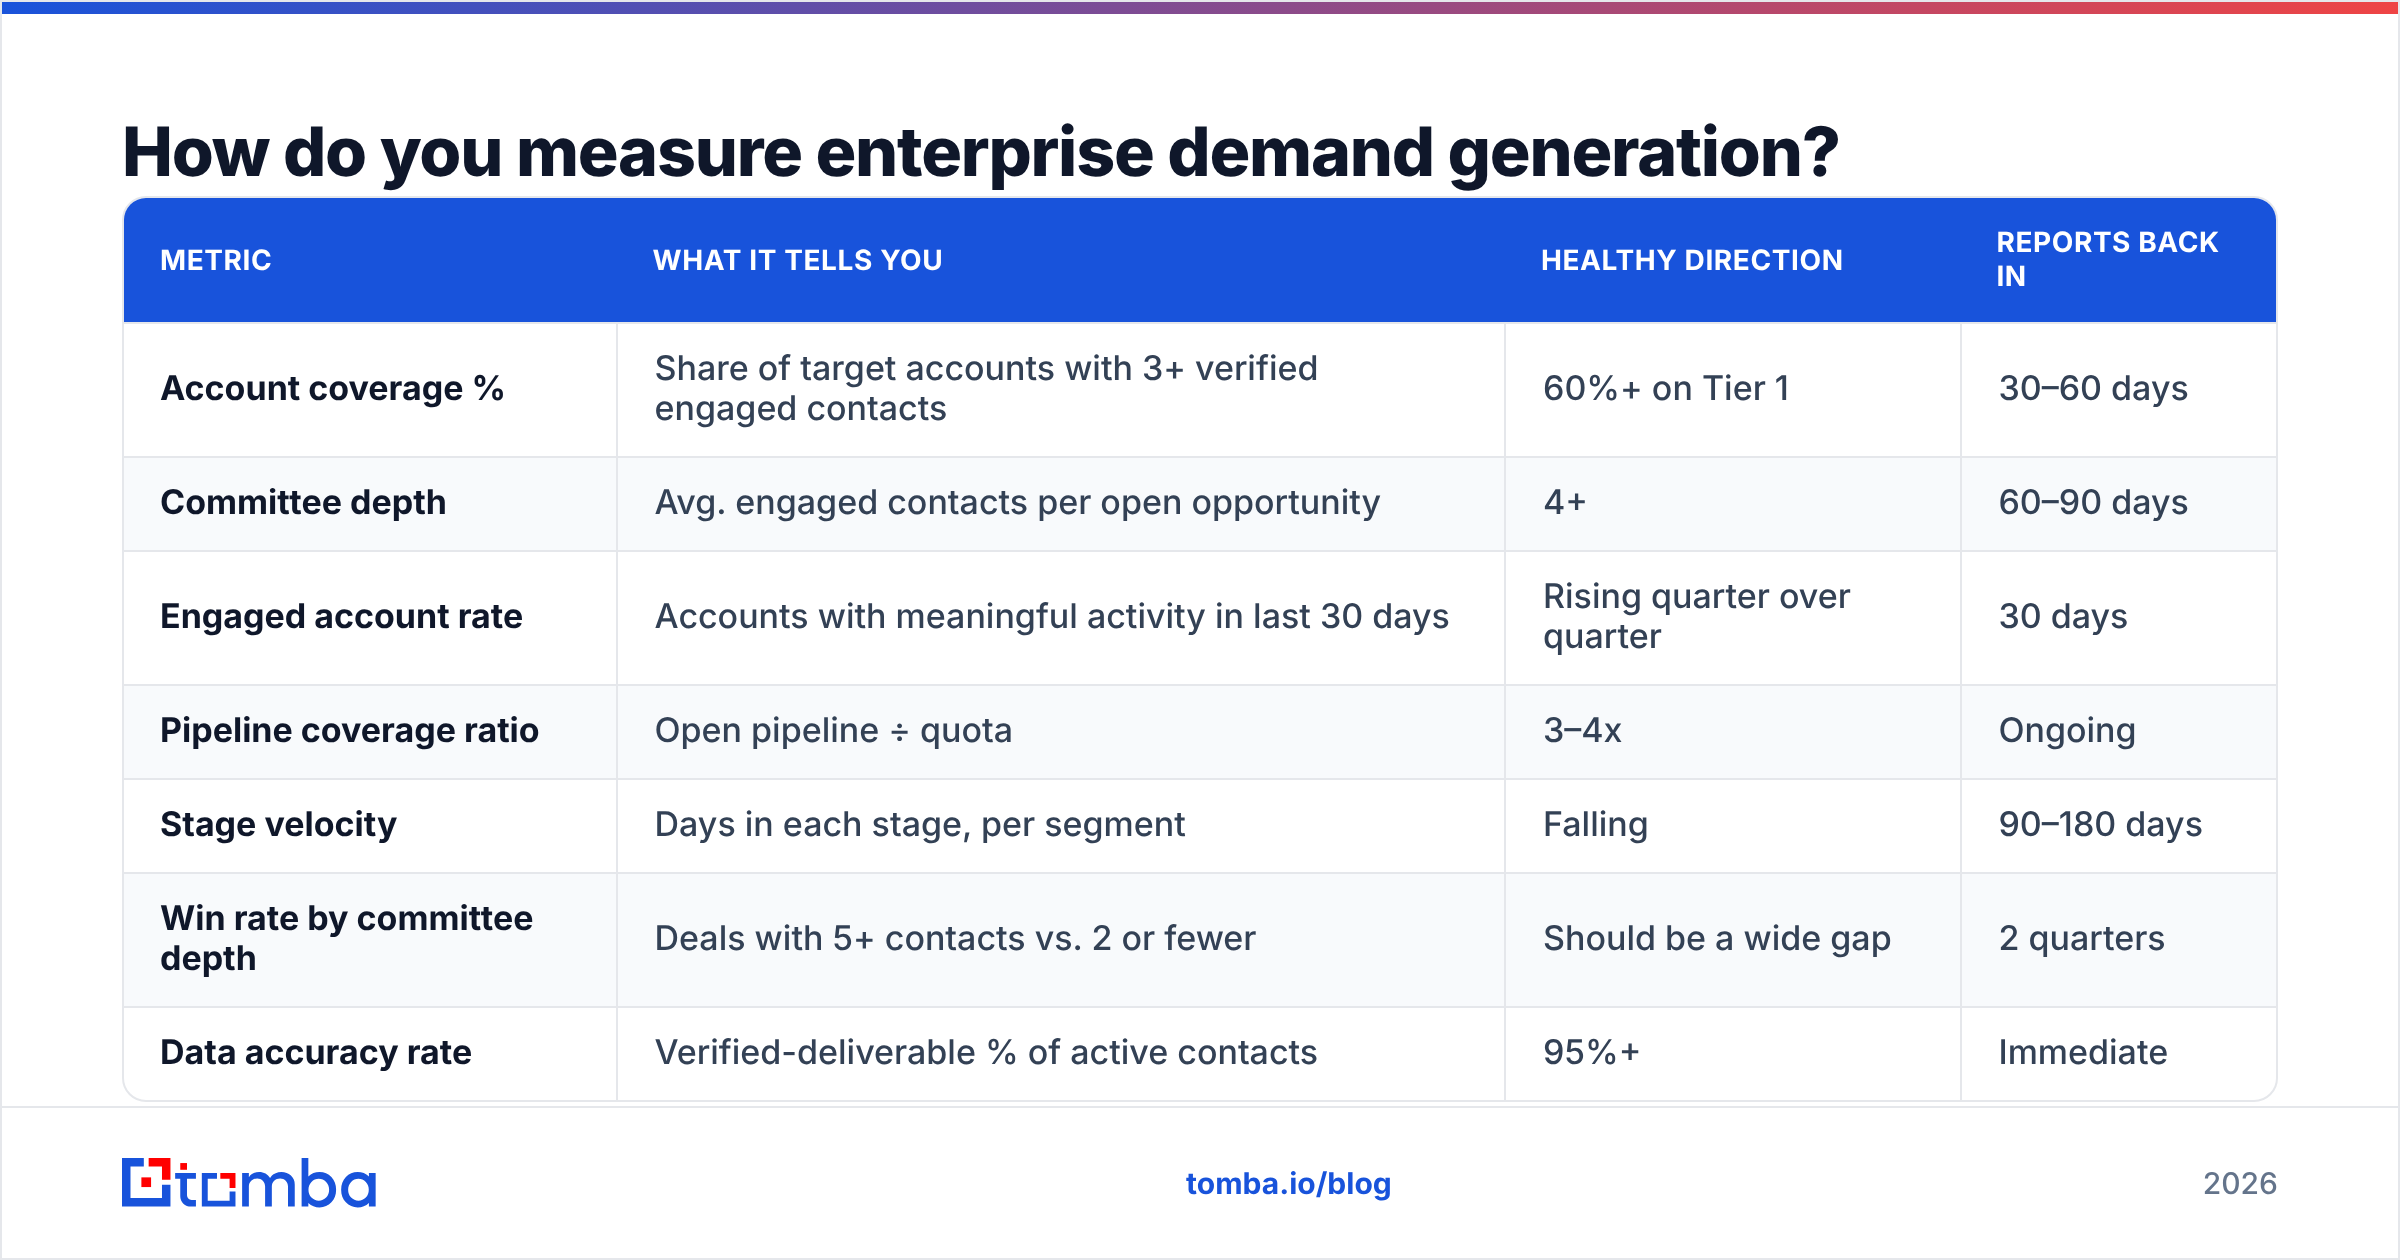
Replace lead-count reporting with a metric set that maps to how enterprise deals actually progress.
| Metric | What it tells you | Healthy direction | Reports back in |
|---|---|---|---|
| Account coverage % | Share of target accounts with 3+ verified engaged contacts | 60%+ on Tier 1 | 30–60 days |
| Committee depth | Avg. engaged contacts per open opportunity | 4+ | 60–90 days |
| Engaged account rate | Accounts with meaningful activity in last 30 days | Rising quarter over quarter | 30 days |
| Pipeline coverage ratio | Open pipeline ÷ quota | 3–4x | Ongoing |
| Stage velocity | Days in each stage, per segment | Falling | 90–180 days |
| Win rate by committee depth | Deals with 5+ contacts vs. 2 or fewer | Should be a wide gap | 2 quarters |
| Data accuracy rate | Verified-deliverable % of active contacts | 95%+ | Immediate |
| Cost per engaged account | Total spend ÷ engaged accounts | Falling or flat | Quarterly |
The single most useful chart you can build: win rate segmented by number of engaged committee contacts. In almost every enterprise dataset, deals with five or more engaged stakeholders close at materially higher rates than single-threaded ones. That chart ends the MQL argument in one meeting, because it converts a philosophical debate into a revenue number.
What does a 90-day enterprise demand generation rollout look like?#
If you are rebuilding from scratch, sequence it like this.
Days 1–30 — Define and instrument. Agree on the ICP with sales and finance in the room. Build the tiered account list. Define what "engaged account" means in your CRM and instrument it. Audit existing contact data against your Tier 1 list and publish the accuracy number, however embarrassing it is. That number is your baseline.
Days 31–60 — Cover and coordinate. Complete committee maps for Tier 1. Fill contact gaps, verify everything, and load it into sequences. Launch one coordinated program per tier — a Tier 1 executive dinner, a Tier 2 industry webinar plus outbound follow-up, a Tier 3 always-on capture campaign. Ship the two enablement assets that unlock mid-cycle: the ROI model and the security overview.
Days 61–90 — Read signal and cut. Review coverage and engagement weekly, not pipeline. Pipeline is too lagging to steer by at this stage. Kill any program that has not produced committee engagement in an account after two full cycles. Run the first joint deal review where marketing hears unfiltered loss reasons. Then rebuild the next quarter's plan from what you learned rather than from last quarter's plan plus 10%.
Practical guidance on campaign structure and content sequencing is well covered in HubSpot's marketing resources if you want a broader tactical library to draw from — just translate every "lead" reference into "account" before you apply it.
Where do most teams go from here?#
Start with the constraint, not the tactic. For the majority of enterprise demand generation programs, the constraint is not creative, budget, or channel mix. It is that nobody can name and reach all six to eleven people who decide, and the contact records they do have are quietly rotting at 2.5% per month.
Fix coverage first. Everything downstream — messaging, orchestration, attribution — gets easier once you are confident that the people in your sequences exist, hold the roles you think they hold, and can actually receive your email.
That is the job the Tomba Email Finder is built for: find verified professional email addresses by domain, name, or company so your committee maps are complete before you spend a dollar on orchestration. The free tier covers 25 searches a month for a proof of concept; Tomba pricing starts at $49/mo on Starter, $99/mo on Growth, and $249/mo on Pro when you scale to full-tier coverage. Build the account list, verify it, then run the program — in that order.
Related guides#
Ready to find emails that actually work?
Join 150,000+ professionals who stopped guessing and started sending. Free credits on signup — no credit card required.
Get the Tomba newsletter
Practical outbound tactics and product updates — once every two weeks.
About the author