Enterprise SaaS Churn Rate: Benchmarks and Fixes for 2026
Most churn benchmarks floating around LinkedIn are SMB numbers wearing an enterprise badge. Here are the real 2026 figures, the formulas that matter, and the leading signals that predict a non-renewal months in advance.
TL;DR
- A healthy enterprise SaaS churn rate is roughly 5–8% gross revenue churn per year — not per month. If you are benchmarking against SMB numbers (3–5% monthly), you are grading yourself on the wrong curve.
- Logo churn and revenue churn tell different stories. Losing three small accounts and one seven-figure account produces the same logo churn and wildly different board meetings.
- Net revenue retention (NRR) above 110% is the enterprise standard in 2026; below 100% means expansion is not covering losses and growth becomes pure new-logo dependency.
- Most enterprise churn is decided 4–9 months before renewal. The predictive signals are usage decay, champion departure, and stalled onboarding milestones — not the renewal call.
- The cheapest churn fix is usually not a product change. It is re-establishing contact with the humans who actually hold budget after your champion leaves.
What is the enterprise SaaS churn rate?#
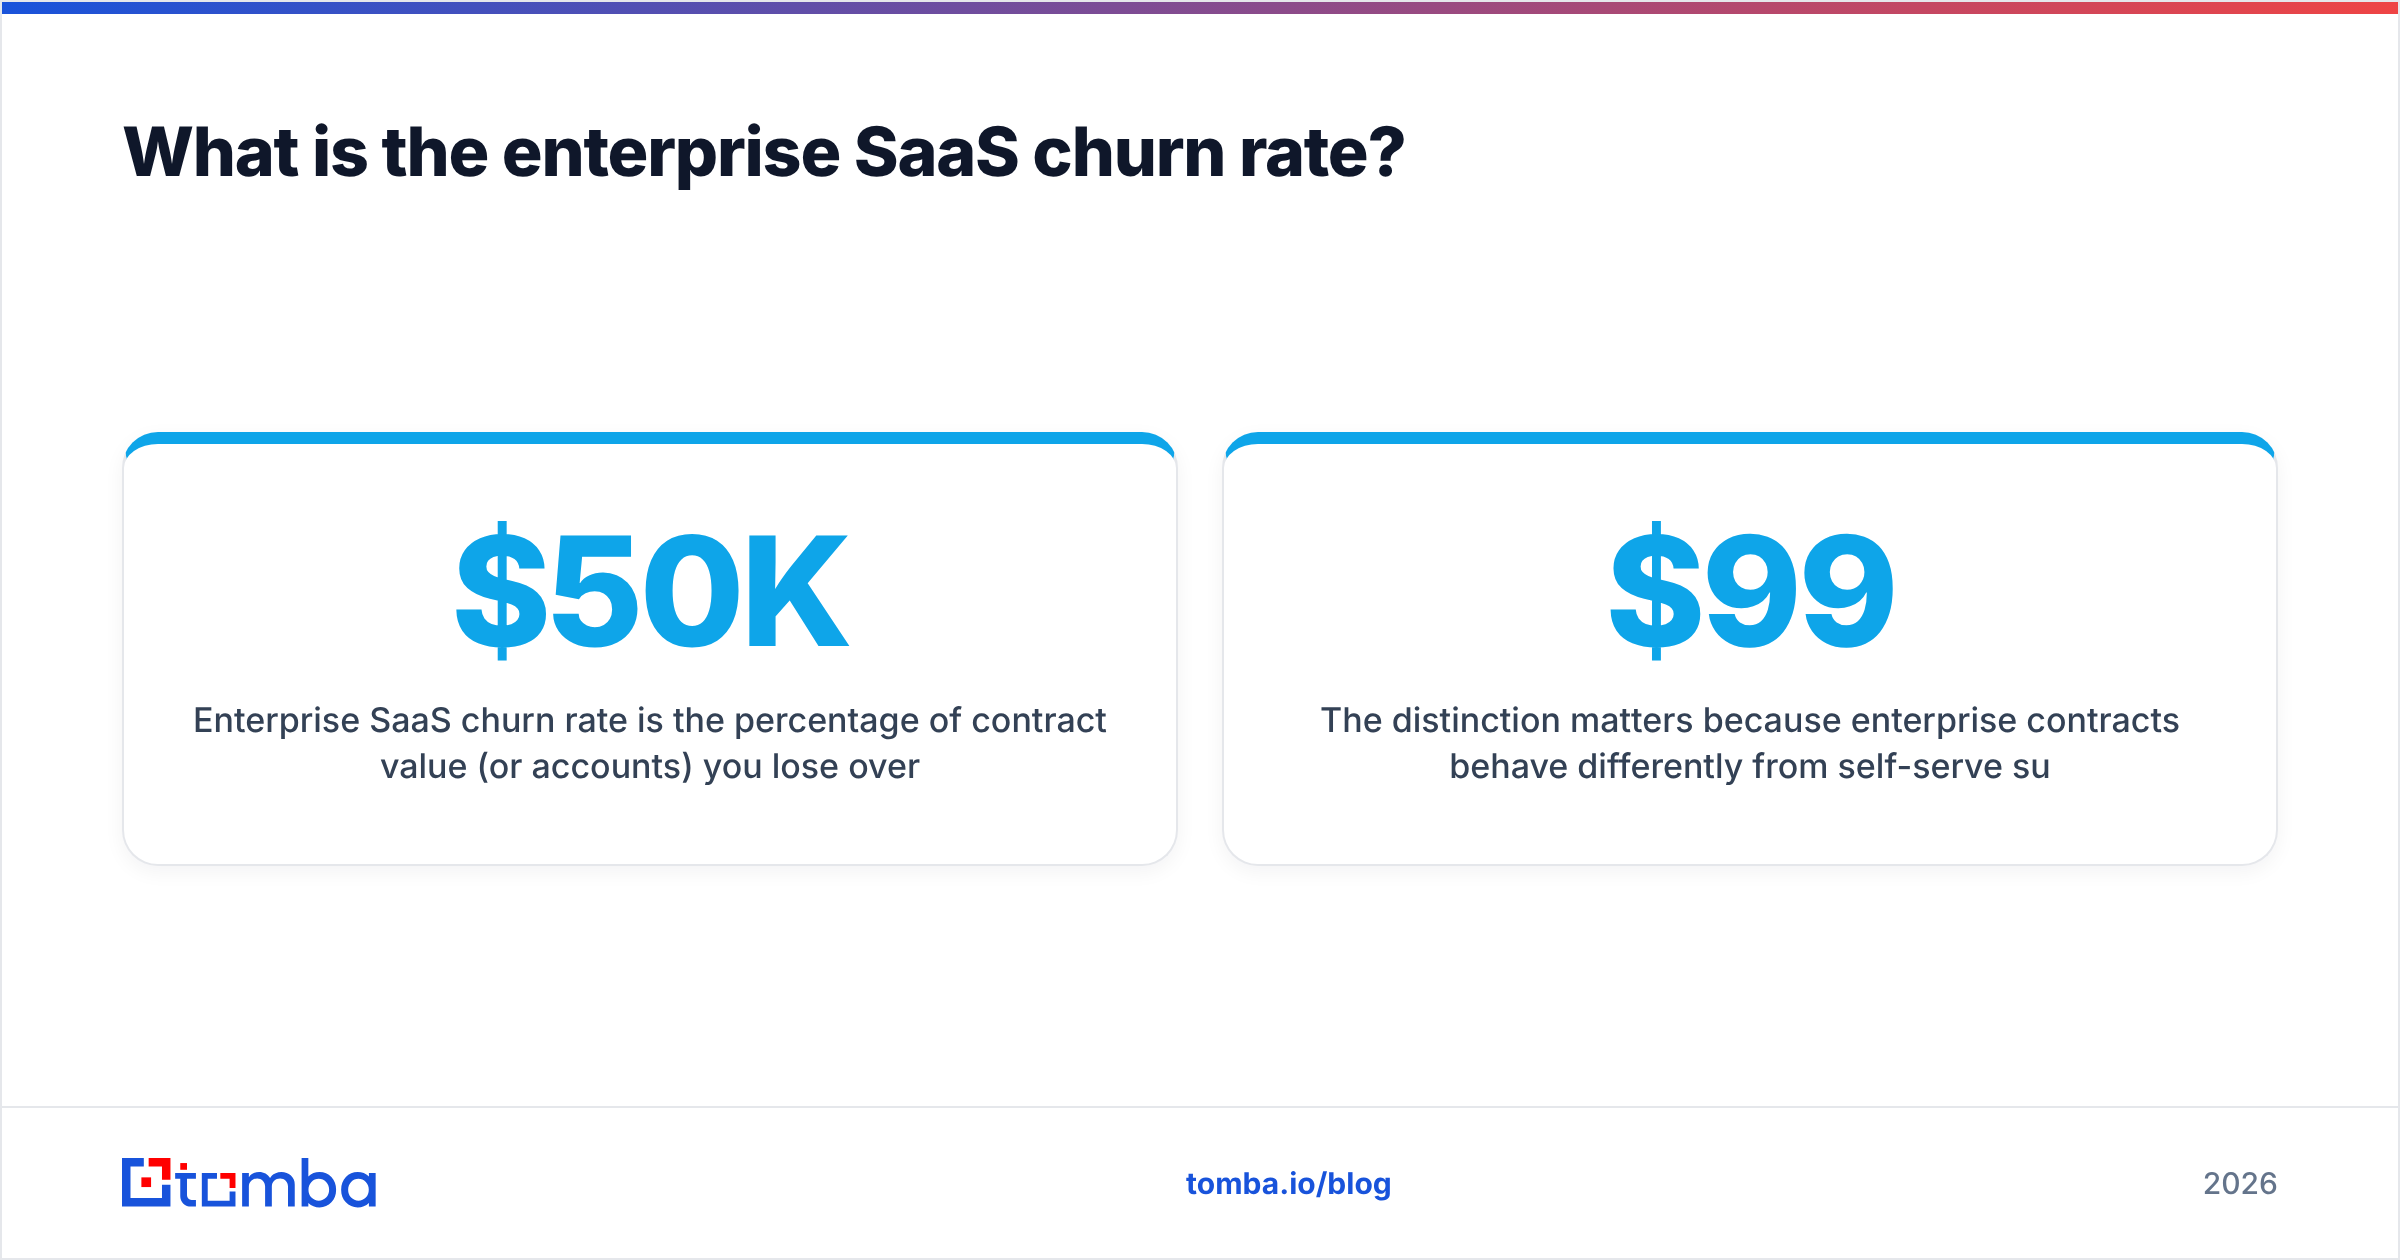
Enterprise SaaS churn rate is the percentage of contract value (or accounts) you lose over a defined period, measured on customers with enterprise-scale contracts — typically $50K+ ACV, multi-year terms, procurement involvement, and multiple stakeholders per account.
The distinction matters because enterprise contracts behave differently from self-serve subscriptions. A $99/month customer can cancel on a Tuesday afternoon with two clicks. A $400K/year customer cannot — they are locked into a term, they have an internal renewal process, and the decision to leave gets made in stages over quarters. That structural difference is why enterprise churn is measured annually while SMB churn is measured monthly, and why comparing the two produces nonsense.
There are four numbers you need, and teams routinely confuse them:
- Gross revenue churn — recurring revenue lost from cancellations and downgrades, divided by starting recurring revenue. This never goes below zero. It is the honest measure of leakage.
- Net revenue churn — gross churn minus expansion revenue from existing accounts. This can go negative (a good thing), which is where "negative churn" bragging comes from.
- Logo churn — the count of accounts lost, regardless of size. Useful for spotting segment-level problems, useless for forecasting revenue.
- Net revenue retention (NRR) — starting ARR plus expansion minus contraction and churn, divided by starting ARR. The single number most enterprise boards actually track.
If you only report one, report NRR. If you only fix one, fix gross churn — expansion revenue can mask a leaking bucket for about six quarters before the math catches up with you.
How do you calculate enterprise SaaS churn rate correctly?#
The formulas are simple. The definitions underneath them are where teams go wrong.
Gross revenue churn (annual):
(ARR lost to cancellations + downgrades) ÷ ARR at period start × 100
Logo churn (annual):
(Accounts lost) ÷ (Accounts at period start) × 100
Net revenue retention:
(Starting ARR + expansion − contraction − churn) ÷ Starting ARR × 100
Four rules that keep these numbers honest:
- Exclude new customers acquired mid-period from the denominator. A customer who signed in November cannot meaningfully churn in December. Including them inflates your base and flatters your rate.
- Count downgrades as churn, not as "a save." A customer who cut from 500 seats to 80 seats did not renew — they partially left. Contraction is churn with better PR.
- Measure on a cohort basis, not a blended one. Blended churn across all segments hides the fact that your mid-market book is fine and your enterprise book is bleeding, or vice versa.
- Pick one revenue definition and never move it. ARR, MRR × 12, or committed contract value — all defensible, all incompatible with each other. Switching mid-year makes trendlines meaningless.
- Report churn on a trailing-12-month basis. Quarterly enterprise churn is statistically noisy. With 200 enterprise accounts, one loss swings your quarterly rate by half a point.
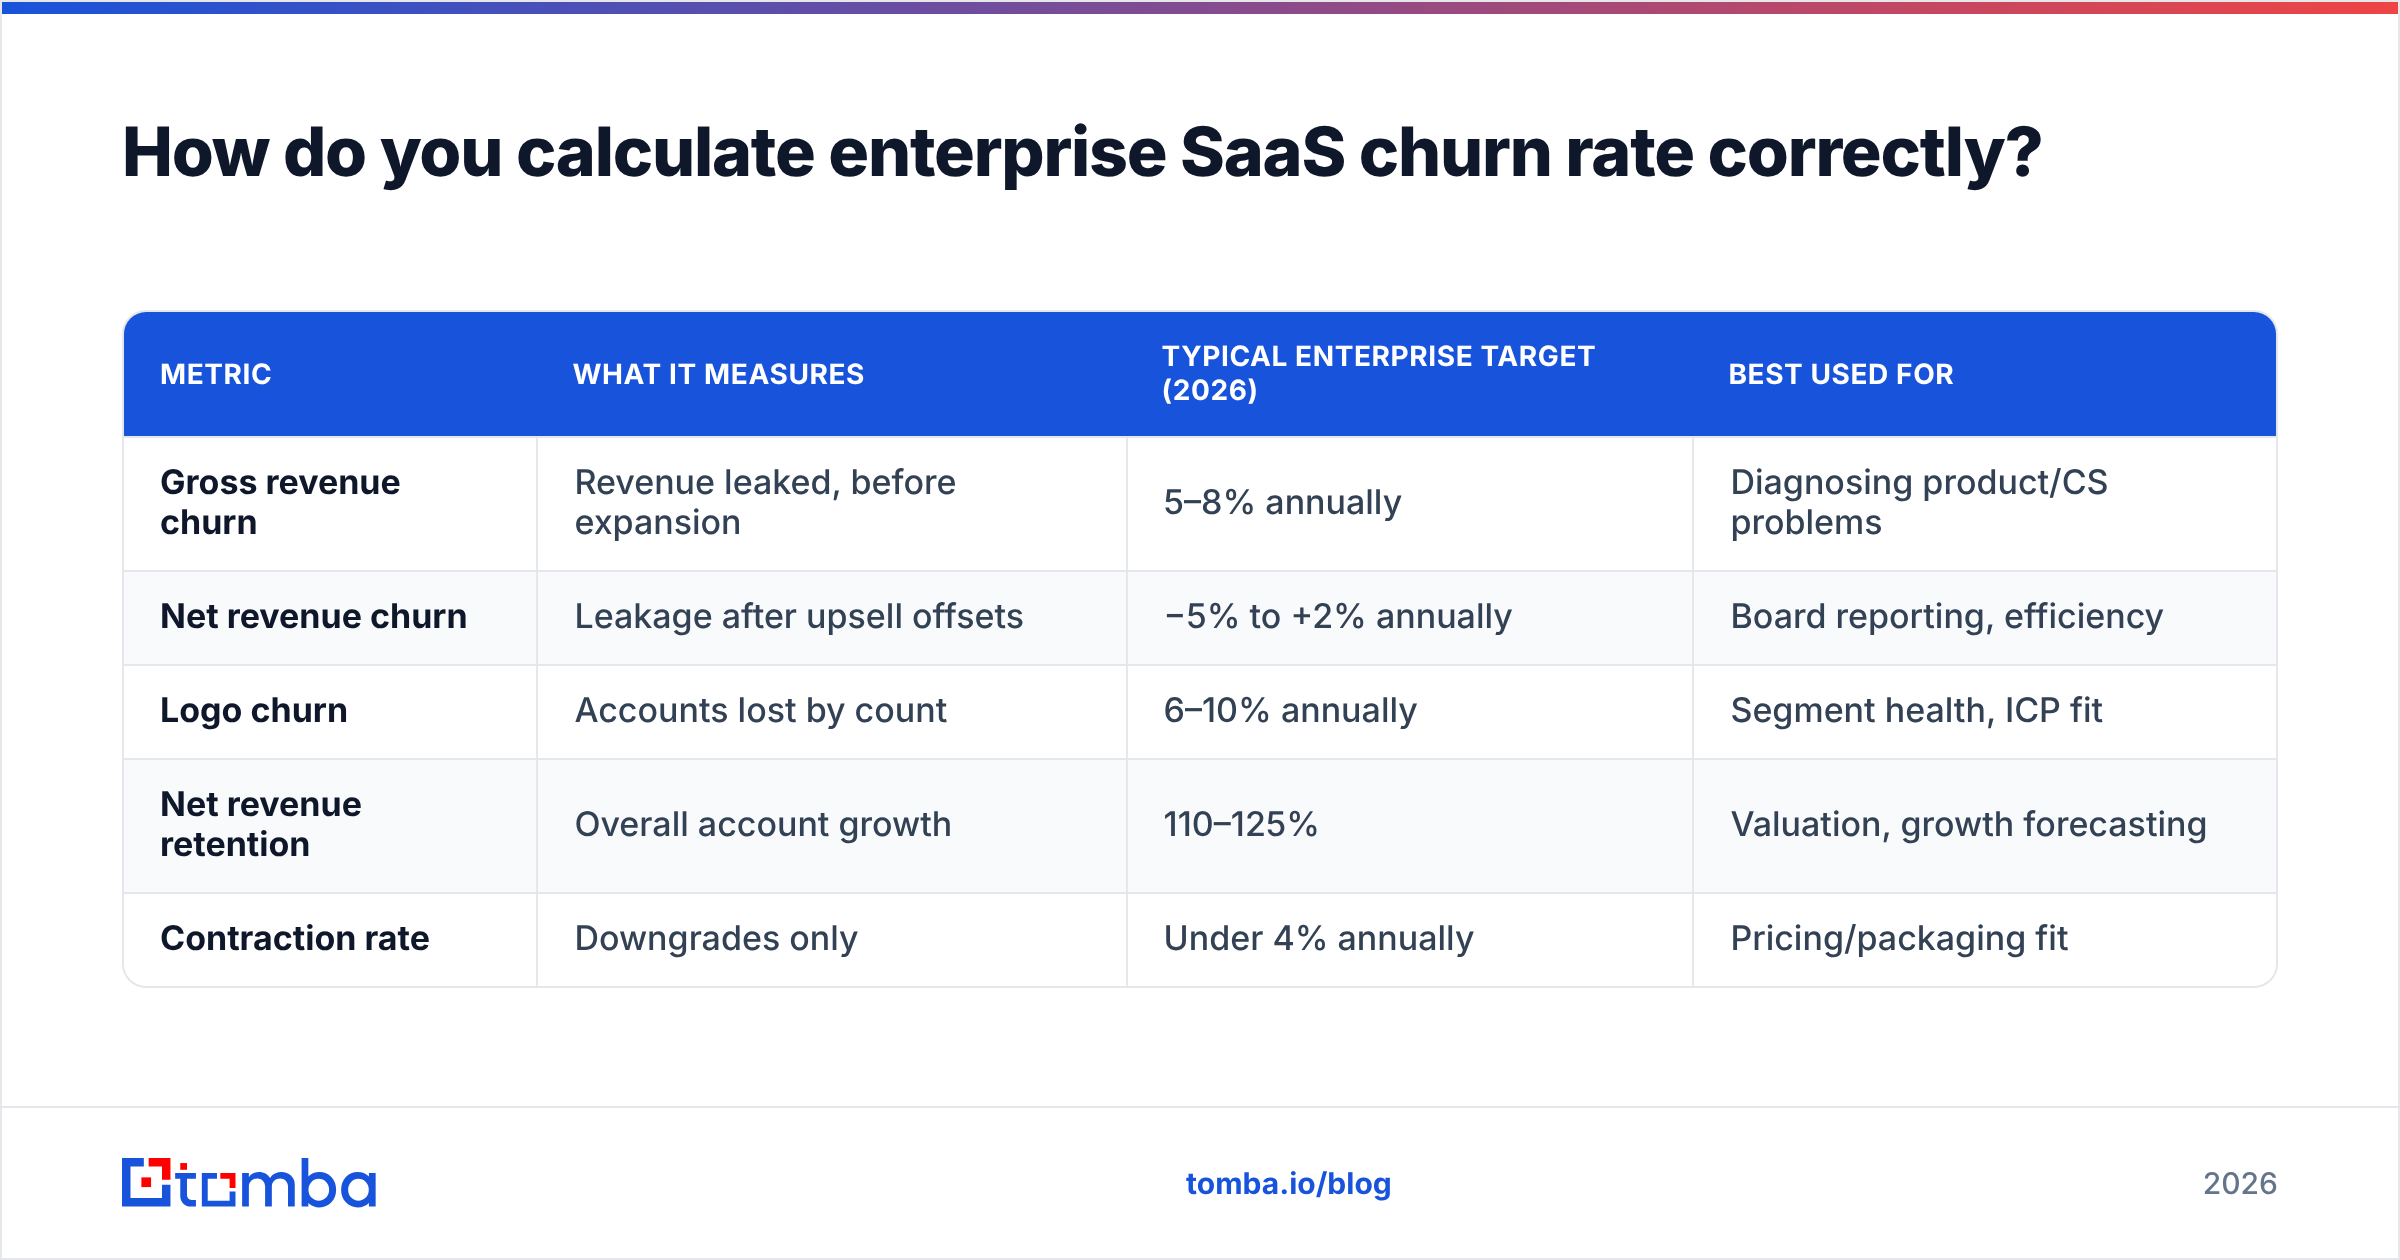
| Metric | What it measures | Typical enterprise target (2026) | Best used for |
|---|---|---|---|
| Gross revenue churn | Revenue leaked, before expansion | 5–8% annually | Diagnosing product/CS problems |
| Net revenue churn | Leakage after upsell offsets | −5% to +2% annually | Board reporting, efficiency |
| Logo churn | Accounts lost by count | 6–10% annually | Segment health, ICP fit |
| Net revenue retention | Overall account growth | 110–125% | Valuation, growth forecasting |
| Contraction rate | Downgrades only | Under 4% annually | Pricing/packaging fit |
What is a good enterprise SaaS churn rate in 2026?#
Roughly 5–8% gross annual revenue churn for true enterprise, with NRR between 110% and 125%. Anything materially worse suggests a fit problem; anything dramatically better usually means you are counting something loosely.
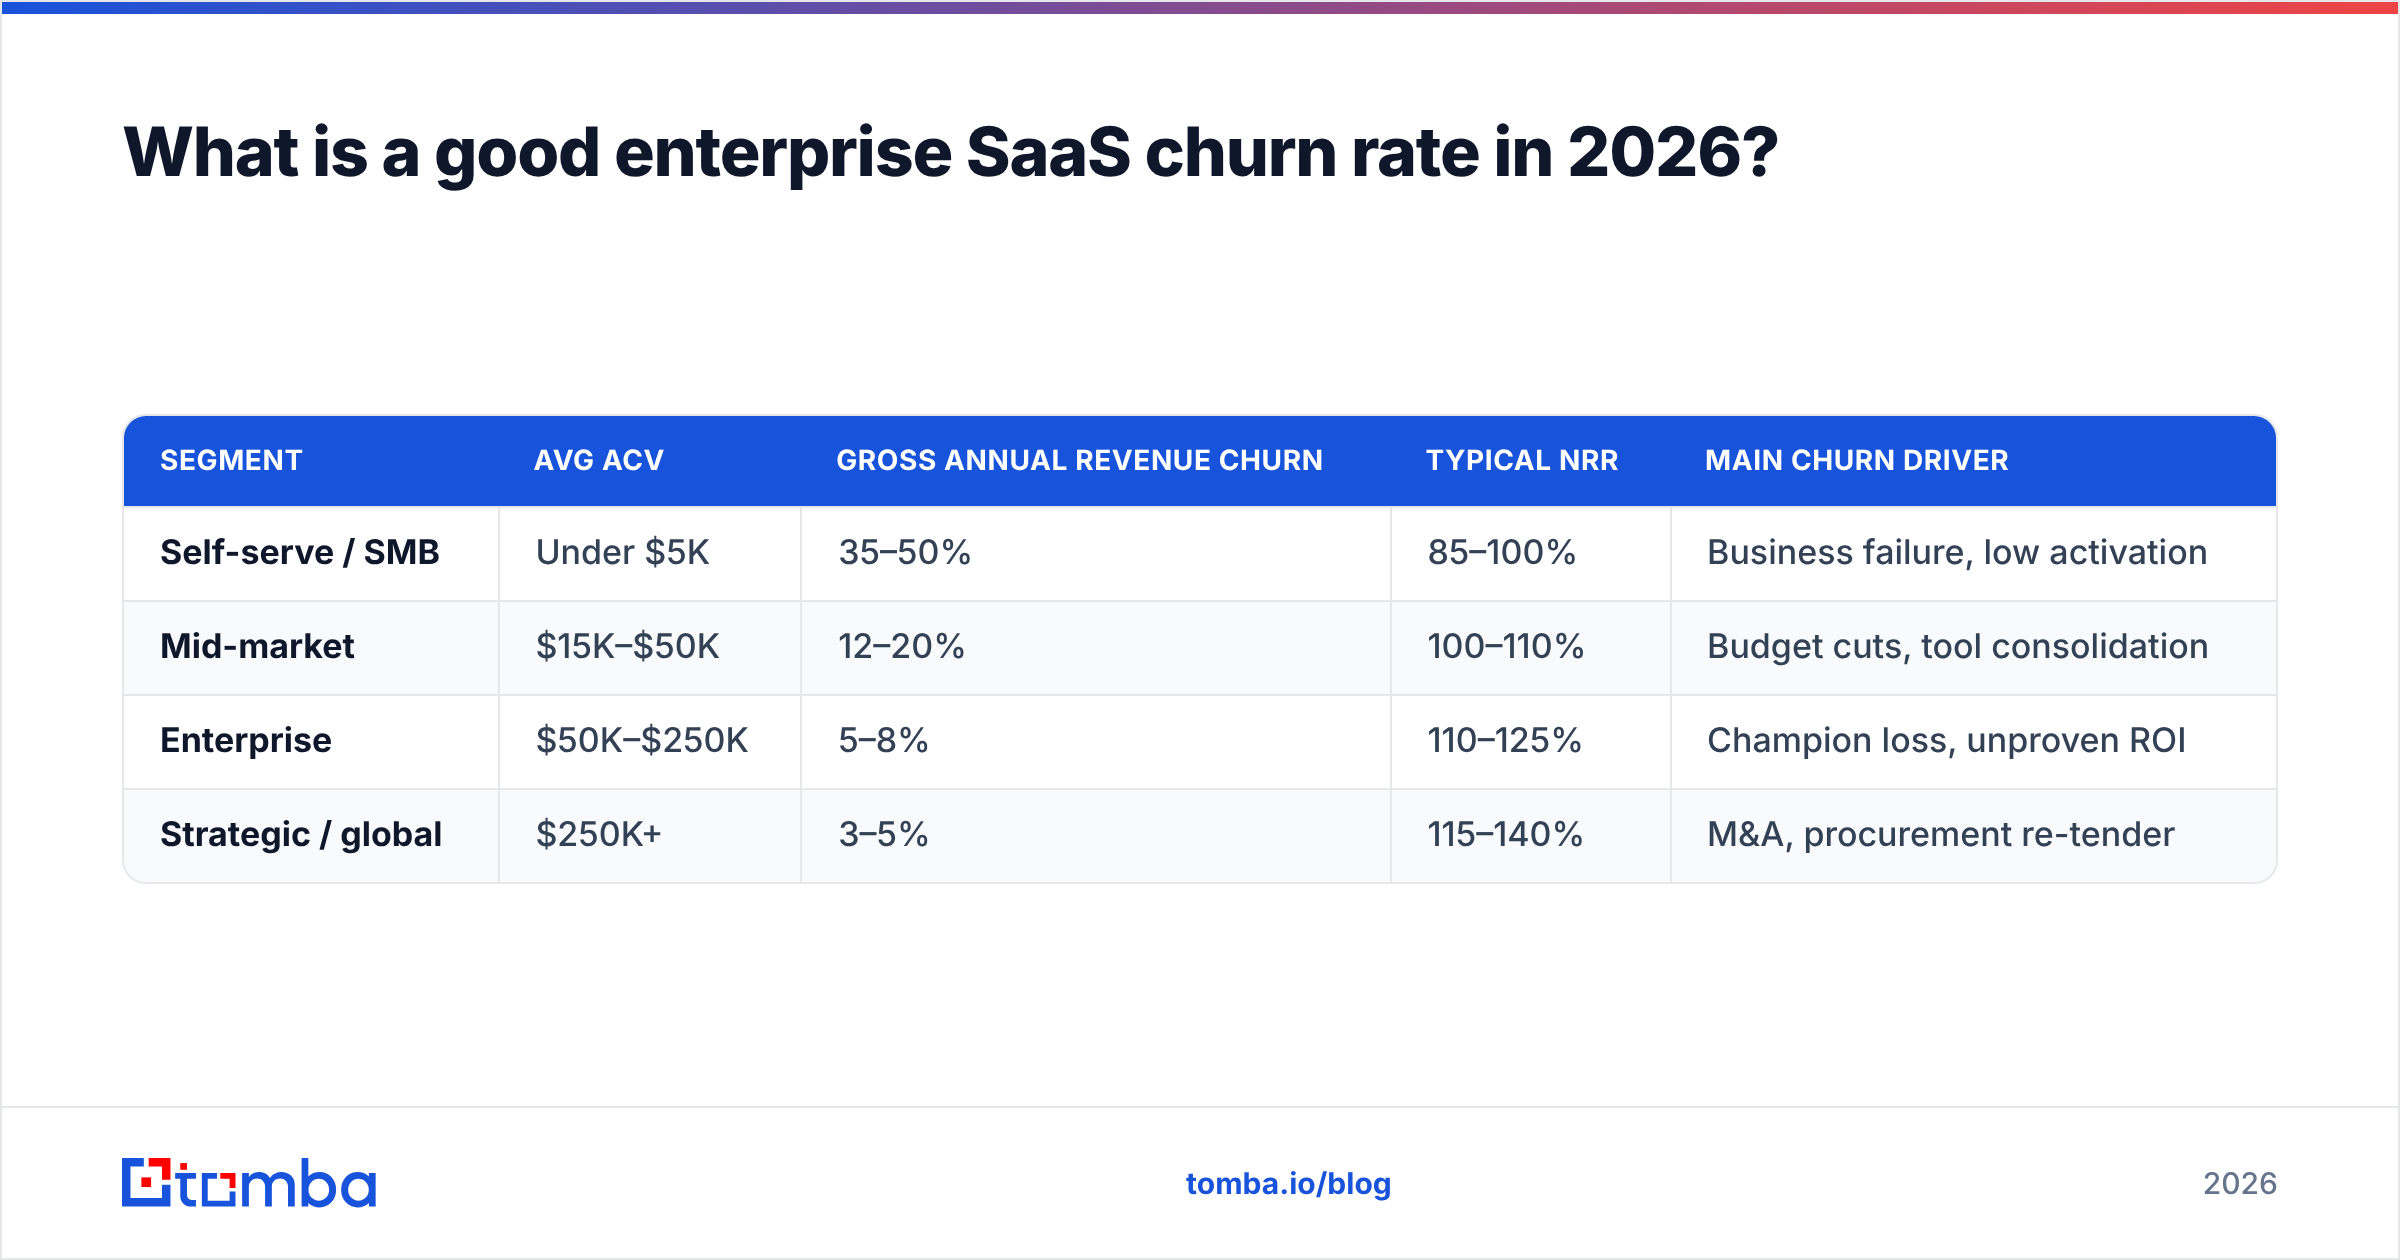
Here is how the benchmark shifts by segment, based on the ranges commonly reported across public SaaS filings and industry surveys:
| Segment | Avg ACV | Gross annual revenue churn | Typical NRR | Main churn driver |
|---|---|---|---|---|
| Self-serve / SMB | Under $5K | 35–50% | 85–100% | Business failure, low activation |
| Mid-market | $15K–$50K | 12–20% | 100–110% | Budget cuts, tool consolidation |
| Enterprise | $50K–$250K | 5–8% | 110–125% | Champion loss, unproven ROI |
| Strategic / global | $250K+ | 3–5% | 115–140% | M&A, procurement re-tender |
Two caveats before you screenshot that table.
First, churn is inversely correlated with contract length, not with quality. A three-year term mechanically produces lower annual churn because only a third of your base is up for renewal each year. Companies that shifted to multi-year contracts in 2024–2025 saw churn "improve" without doing anything to the product. Adjust for renewal exposure — measure churn as a percentage of ARR up for renewal, not total ARR, if you want the real number.
Second, downgrades are running hotter than cancellations. The pattern across the last two years has been seat reduction rather than outright exits: customers keep the platform, cut the license count 20–40%, and call it optimization. Gross logo churn looks stable while ARR quietly compresses. If your logo retention is 95% and your NRR is 98%, contraction is your actual problem.
Why does gross churn hide the real problem?#
Because expansion revenue is an anesthetic. A company growing 60% year over year can post 12% gross churn and still show 115% NRR — the new expansion buries the losses. Then growth decelerates to 25%, expansion thins out, and the same 12% churn suddenly produces 98% NRR and a very different valuation multiple.
The pattern is predictable enough to plan around:
- Growth stage: expansion masks churn. Nobody investigates because NRR looks fine.
- Deceleration stage: churn becomes visible. Emergency retention initiatives launch.
- Recovery stage: the fixes take 12–18 months to show up in renewals, because the accounts churning this year were lost 9 months ago.
That lag is the single most under-appreciated fact about enterprise retention. Whatever you fix today shows up in next year's numbers. Which means diagnosis has to run on leading indicators, not on the renewal outcome itself.
What actually causes enterprise churn?#
Ranked by frequency in post-mortems, not by how satisfying they are to fix:
- Champion departure. Your executive sponsor leaves, and their replacement has no memory of why the contract exists. This is the top cause in enterprise, and it is a data problem before it is a relationship problem — most teams find out weeks late, from an auto-reply bounce.
- Unproven ROI at renewal. The value was obvious during the pilot and never got quantified afterward. When procurement asks "what did this deliver," nobody has a number.
- Shallow deployment. One team of 40 uses the product; the other 900 seats sit idle. Usage concentration is the strongest single predictor of non-renewal.
- Consolidation mandates. A new CIO decides on a platform standard and your point solution is on the wrong side of the line.
- Onboarding that never finished. The integration was scoped, half-built, and abandoned. Accounts that miss their 90-day activation milestone churn at roughly twice the rate of those that hit it.
- Pricing friction at scale. Per-seat pricing that made sense at 50 seats becomes indefensible at 800. The customer does not leave — they contract.
Notice how few of these are "the product was bad." Enterprise churn is overwhelmingly a go-to-market and account-coverage failure, which is why it sits squarely in revenue operations rather than engineering.
How do you predict churn before the renewal call?#
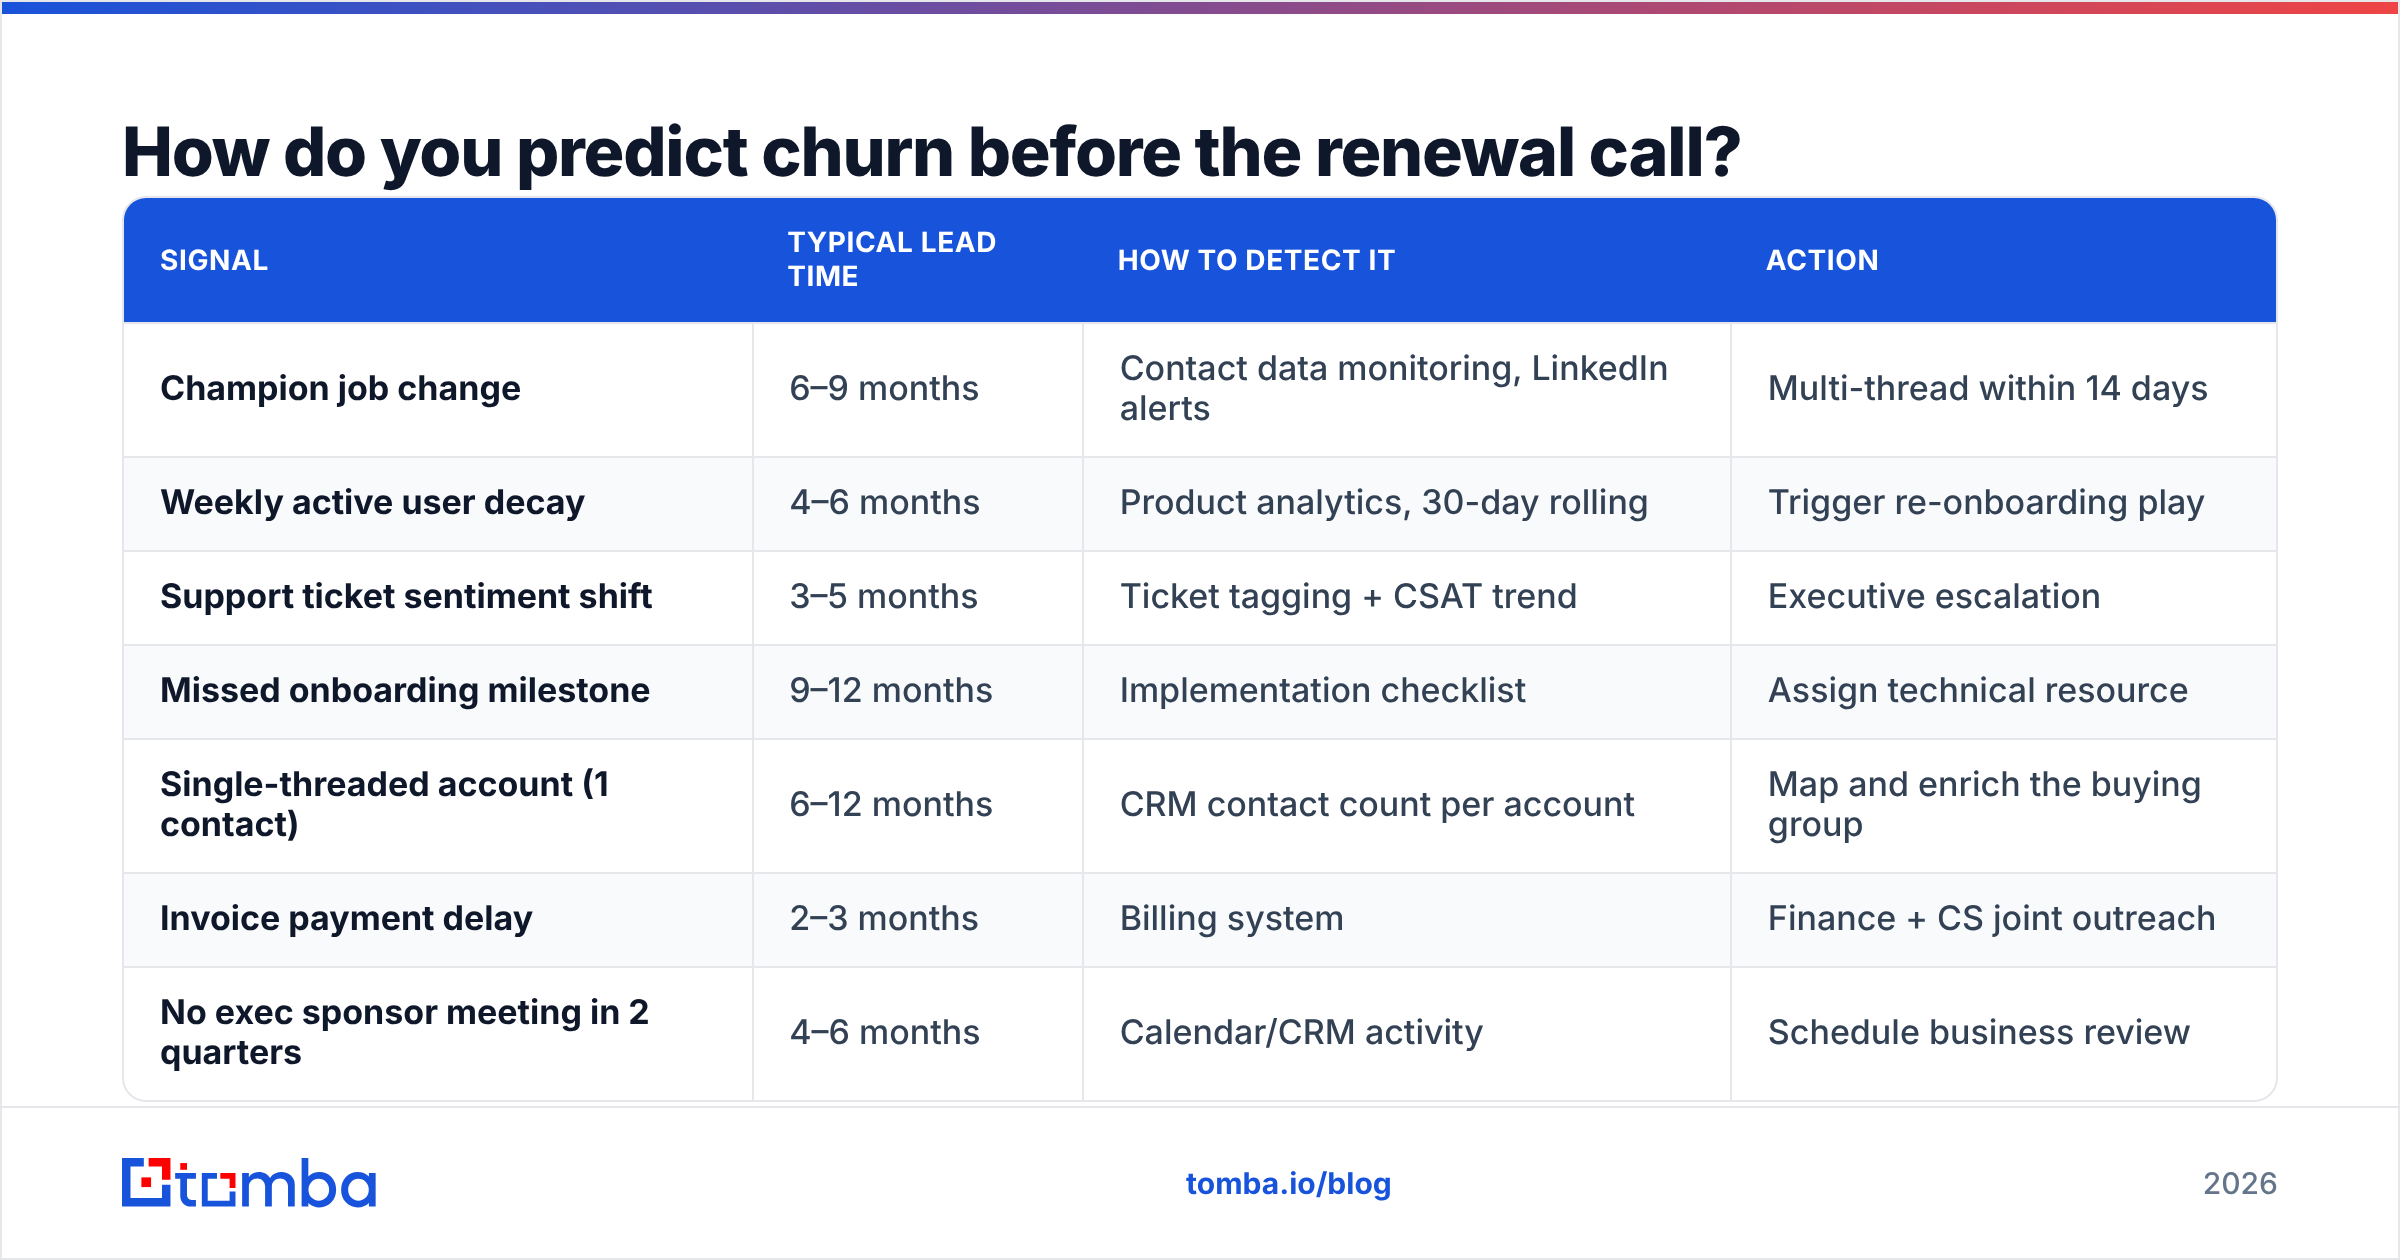
Score accounts on leading signals and act on the ones that move. The signals below are ranked by lead time — how far in advance they typically fire.
| Signal | Typical lead time | How to detect it | Action |
|---|---|---|---|
| Champion job change | 6–9 months | Contact data monitoring, LinkedIn alerts | Multi-thread within 14 days |
| Weekly active user decay | 4–6 months | Product analytics, 30-day rolling | Trigger re-onboarding play |
| Support ticket sentiment shift | 3–5 months | Ticket tagging + CSAT trend | Executive escalation |
| Missed onboarding milestone | 9–12 months | Implementation checklist | Assign technical resource |
| Single-threaded account (1 contact) | 6–12 months | CRM contact count per account | Map and enrich the buying group |
| Invoice payment delay | 2–3 months | Billing system | Finance + CS joint outreach |
| No exec sponsor meeting in 2 quarters | 4–6 months | Calendar/CRM activity | Schedule business review |
The first and fifth rows are the ones most teams cannot action, and they are the two with the longest lead times. You cannot multi-thread an account when your CRM has one contact record on it, and you cannot detect a champion departure when the only signal is a bounced email six weeks after they left.
This is where contact data quality stops being a marketing-ops concern and becomes a retention concern. An enterprise account with four mapped stakeholders across two departments churns at a fraction of the rate of a single-threaded one — HubSpot's research on customer retention and broader industry analysis from firms like Gartner have made this point repeatedly, and it holds across verticals.
Can better account data actually reduce churn?#
Yes — specifically for the champion-departure and single-threading failure modes, which together account for a large share of enterprise losses.
The mechanics are unglamorous:
- Keep contact records current. B2B contact data decays at roughly 25–30% per year through job changes alone. An account you closed 18 months ago has, statistically, lost at least one of its key contacts. Running your CRM contacts through a data enrichment pass on a quarterly cadence turns silent decay into a dated alert.
- Verify before you escalate. Nothing torches an executive escalation faster than an email that bounces. Running renewal-cycle contacts through an email verifier before a save campaign is a five-minute step that prevents a dead-end quarter.
- Map the buying group, not the user. For each at-risk account, you want the economic buyer, the technical owner, and at least one day-to-day user on file. Using domain search against the customer's domain surfaces the adjacent stakeholders your AE never met — the ones who will inherit the decision when your champion leaves.
- Rebuild coverage after a departure. When a champion moves on, you have two jobs: re-thread the account, and follow them to their new company. The second one is a pipeline opportunity most teams leave on the table entirely.
None of this replaces product value or customer success execution. It removes the excuse that you couldn't see it coming. Peer review sites like G2 are full of enterprise buyers describing the same experience: the vendor went quiet, the sponsor left, nobody re-engaged, and the renewal quietly lapsed.
What does a churn reduction playbook look like?#
Six moves, in order of expected impact per hour invested:
- Instrument renewal exposure. Know exactly how much ARR is up for renewal each quarter, 12 months out. Half of retention "surprises" are calendar surprises.
- Set a contact-coverage floor. No enterprise account renews with fewer than three verified, current stakeholder records. Make it a CS-qualified gate, audited monthly.
- Run a quarterly contact-decay sweep. Re-verify every contact on every enterprise account. Flag departures within days, not at renewal.
- Define one activation milestone and defend it. Whatever "deployed" means for your product, measure days-to-milestone and escalate every account past the threshold.
- Quantify value in writing, twice a year. A one-page ROI summary delivered to the economic buyer, whether or not they asked. It becomes the renewal defense document.
- Separate save motions from expansion motions. The team chasing upsell should not be the team running retention triage. The incentives conflict and retention always loses.
Track the result on gross revenue churn, cohorted, trailing twelve months. Expect no movement for two to three quarters — that lag is structural, not a sign the playbook failed.
Where should you start?#
Start with the accounts where you have one contact and a renewal inside nine months. That intersection is the highest-density churn risk in almost every enterprise book, and it is fixable with data rather than roadmap.
If you want to close that coverage gap without a six-week data project, Tomba Email Finder maps the additional stakeholders on any customer domain — name, role, and verified work email — so your CS team can multi-categorize an account before the champion leaves rather than after. The free tier covers 25 searches a month if you want to test it on your ten riskiest accounts first; paid Tomba plans start at $49/month for teams running this as a standing quarterly sweep. Retention is a data-coverage problem long before it is a relationship problem — fix the coverage, and the relationships get a chance.
Related guides#
Ready to find emails that actually work?
Join 150,000+ professionals who stopped guessing and started sending. Free credits on signup — no credit card required.
Get the Tomba newsletter
Practical outbound tactics and product updates — once every two weeks.
About the author