Excel Pipeline Template: Build, Score, and Forecast Deals
A spreadsheet pipeline is fine until it silently lies to you. Here is the exact column schema, the three formulas that matter, and the point where Excel stops being cheaper than a CRM.

TL;DR
- An Excel pipeline template works well up to roughly 3 reps and 150 open deals. Past that, version conflicts and manual stage updates cost more than a CRM seat.
- The template only earns its keep if it has 12 specific columns — most free downloads ship 6 and forecast nothing useful.
- Three formulas do 90% of the work: weighted value, days-in-stage, and stage conversion rate. Everything else is decoration.
- Garbage contact data breaks a spreadsheet faster than it breaks a CRM, because Excel has no validation layer. Verify emails before the row exists.
- Switch signals: two people editing at once, more than 200 rows, or a forecast that misses by more than 20% two quarters running.
What is an Excel pipeline template, really?#
An Excel pipeline template is a structured spreadsheet where each row is one open opportunity and each column is a fact about that opportunity — company, contact, stage, value, close date, next step. Formulas roll those rows into a weighted forecast and a stage-by-stage conversion view.
Think of it like a kitchen order rail in a small restaurant. Every ticket hangs in one place, in order, and anyone walking past can see what's cooking and what's stalled. It works beautifully for one kitchen. It falls apart the moment you open a second location and both kitchens need the same rail.
That's the honest framing. A spreadsheet pipeline is not a downgrade from a CRM — it's a different tool with a different ceiling. Teams that pretend otherwise either overpay for software they don't populate, or cling to a workbook that quietly stopped reflecting reality four weeks ago.
The distinction that matters: a CRM is a system of record. A spreadsheet is a system of review. If your workbook is the only place a deal exists, you have a single point of failure with no audit trail. If it's a weekly review surface fed by verified data, it's genuinely efficient.

Which columns does a working pipeline template need?#
Most free templates you'll find give you Company, Contact, Value, Stage, Close Date, and Notes. That is enough to list deals and not enough to manage them. Here's the schema that actually produces a forecast:
- Deal ID — a simple sequential number. Without it, you cannot reference a row in Slack, a meeting, or a VLOOKUP without ambiguity when two prospects share a company name.
- Company + Domain — the domain is the join key for everything else. Company names are typed inconsistently ("Acme Inc" vs "Acme, Inc."); domains are not.
- Primary contact, title, verified email — the verified flag is the part people skip. An unverified email in the sheet means the deal has no reachable owner, which means the stage is fiction.
- Stage — a dropdown backed by data validation, never free text. Five to six stages maximum: Identified, Contacted, Qualified, Proposal, Negotiation, Closed.
- Stage probability — a lookup driven by stage, not a number the rep types. Rep-entered probability is the single biggest source of forecast inflation.
- Deal value and weighted value — weighted value is value × probability, calculated, never manual.
- Date entered stage — the field that makes days-in-stage possible. This is the strongest early warning signal you have.
- Expected close date and next action date — two different things. Conflating them is why deals go quiet.
- Source — outbound, inbound, referral, partner. Without it you cannot tell which channel is producing pipeline versus producing noise.
- Loss reason — populated only on closed-lost rows. Six months of loss reasons is the cheapest product research your company will ever run.
Ten to twelve columns. Anything beyond that and reps stop updating it, which is worse than having fewer fields.
Data validation on Stage, Source, and Loss Reason is non-negotiable. Microsoft's own Excel documentation covers dropdown lists in a couple of clicks, and the discipline it enforces is the difference between a workbook you can pivot and a workbook you can only read.
Which formulas actually drive the forecast?#
Three. Everything else in a "advanced" template is usually cosmetic conditional formatting.
Weighted pipeline value. In your weighted column: =[@Value]*[@Probability]. Sum the column for your forecast. If your stage probabilities are honest — derived from your own historical conversion, not a blog post's defaults — this number lands within about 15% over a full quarter.
Days in stage. =TODAY()-[@[Date Entered Stage]]. Then conditional-format anything over your stage's median to red. A deal sitting in Proposal for 40 days when your median is 11 is not a deal; it's a memory. Most pipeline bloat is deals nobody wants to mark closed-lost.
Stage conversion rate. =COUNTIFS(Stage,"Proposal")/COUNTIFS(Stage,"Qualified") across your closed history, not your open pipeline. Run this per stage and you get the actual funnel shape, which is what should set your probabilities in the first place. Most teams discover their Qualified→Proposal step is where they leak, not the close.
Add a pivot table over Stage and Source, refresh it weekly, and you have a forecast meeting agenda that writes itself. HubSpot's overview of sales pipeline management is a solid reference on stage definitions if yours are fuzzy.
Is Excel better than Google Sheets or a CRM?#
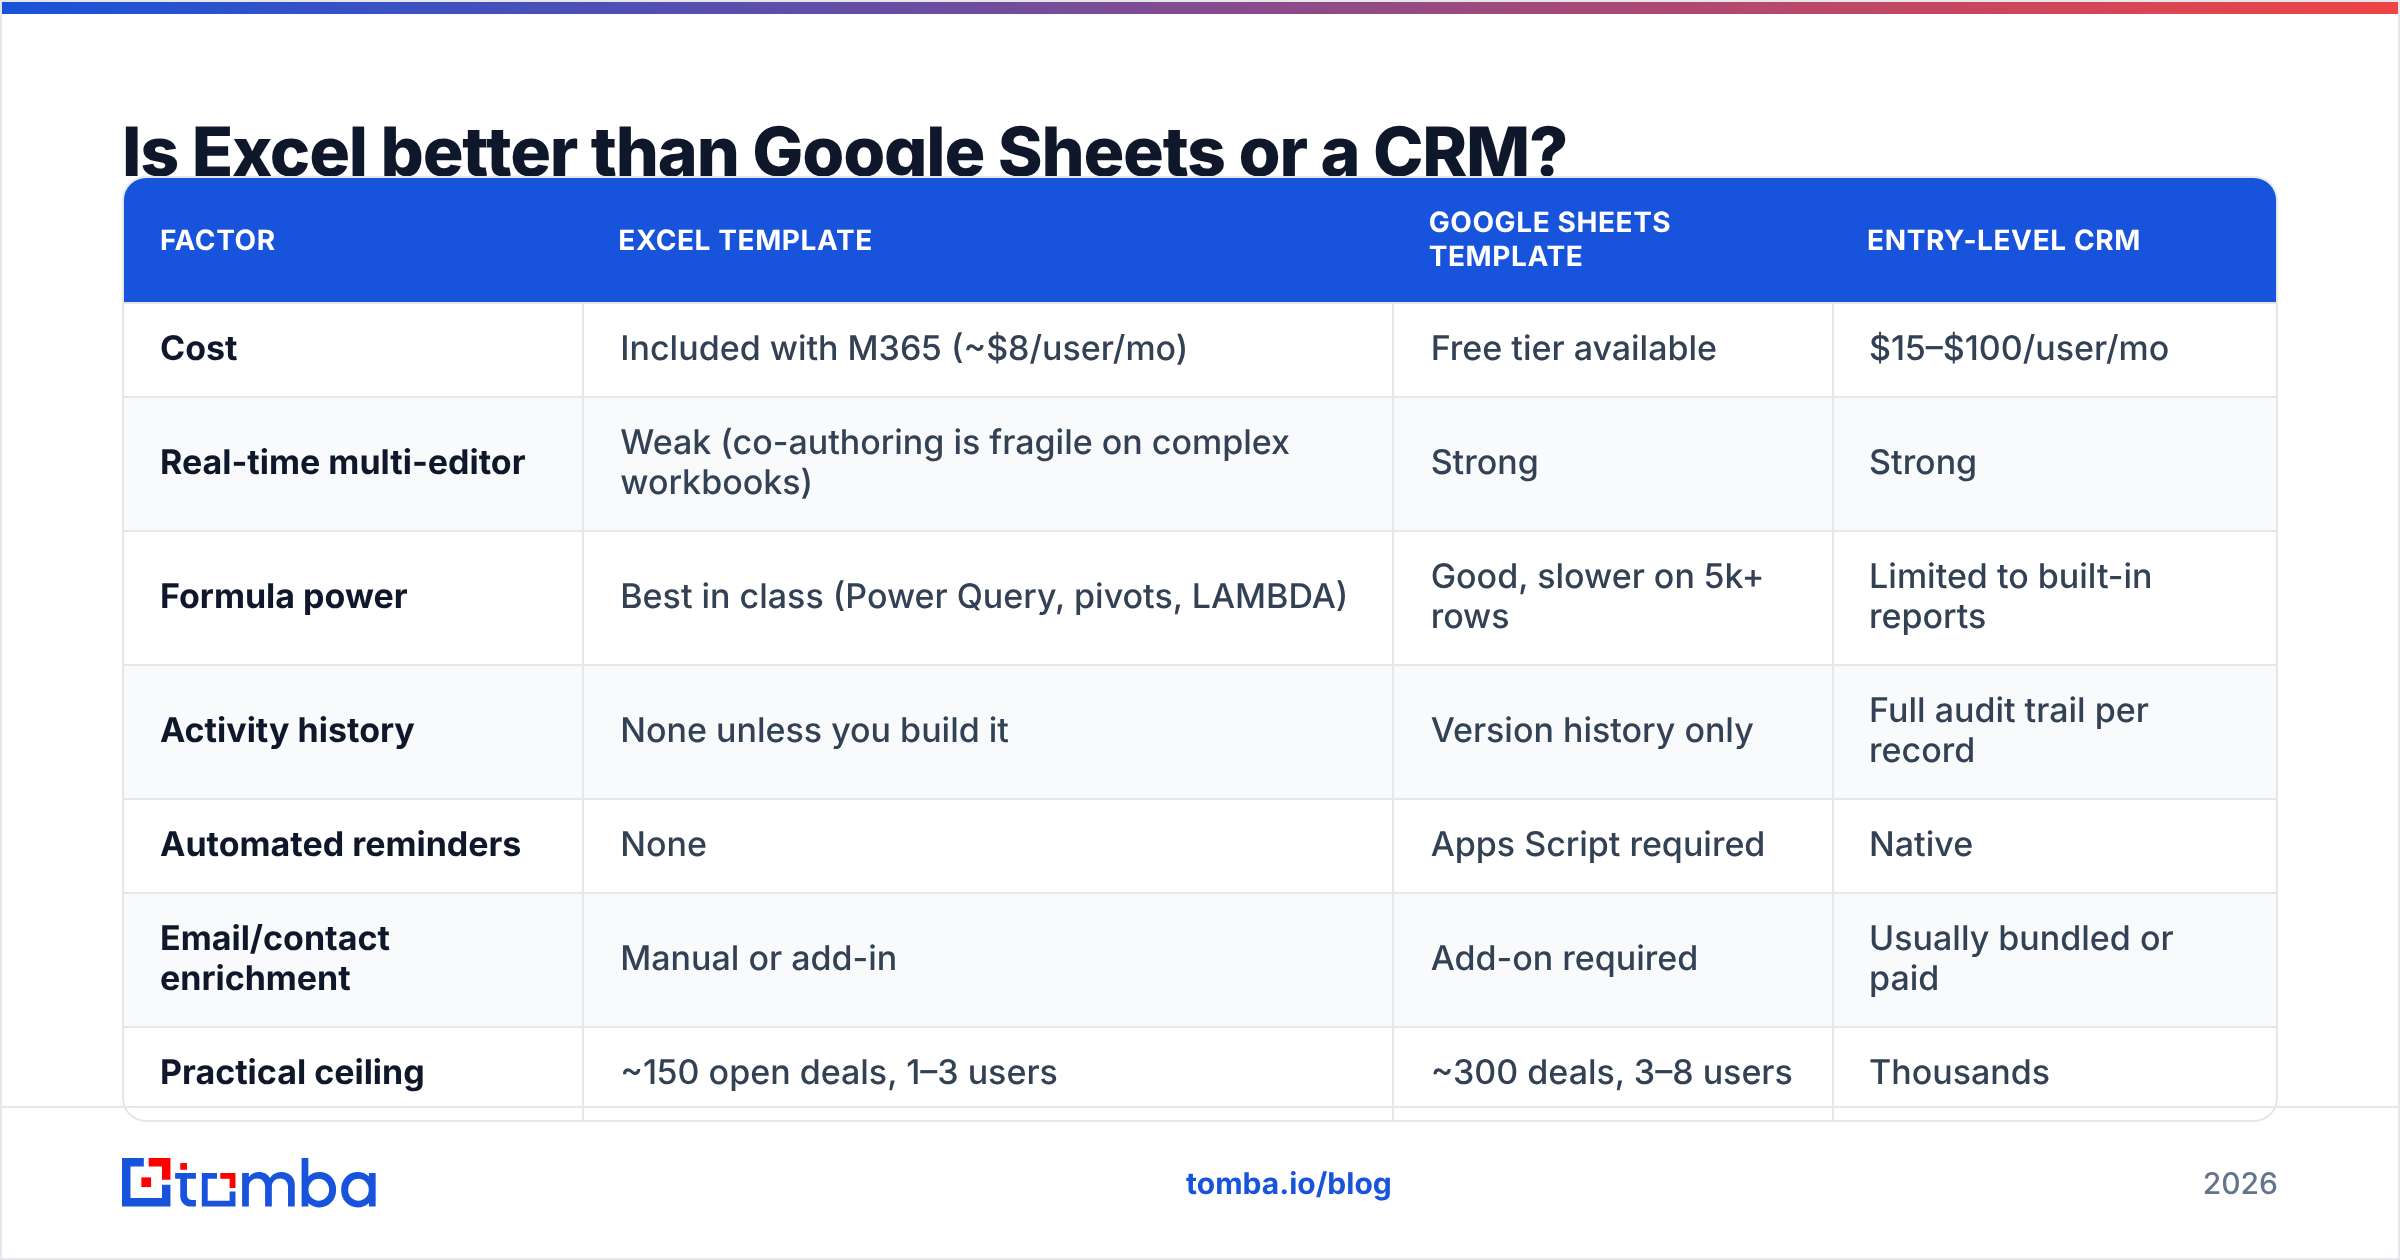
Depends entirely on team size and how many people need to write at the same time. Here's the honest comparison:
| Factor | Excel template | Google Sheets template | Entry-level CRM |
|---|---|---|---|
| Cost | Included with M365 (~$8/user/mo) | Free tier available | $15–$100/user/mo |
| Real-time multi-editor | Weak (co-authoring is fragile on complex workbooks) | Strong | Strong |
| Formula power | Best in class (Power Query, pivots, LAMBDA) | Good, slower on 5k+ rows | Limited to built-in reports |
| Activity history | None unless you build it | Version history only | Full audit trail per record |
| Automated reminders | None | Apps Script required | Native |
| Email/contact enrichment | Manual or add-in | Add-on required | Usually bundled or paid |
| Practical ceiling | ~150 open deals, 1–3 users | ~300 deals, 3–8 users | Thousands |
| Setup time | 1–2 hours | 1 hour | 1–3 days |
| Offline access | Yes | Partial | Rarely |
The pattern in that table: Excel wins on analysis, Sheets wins on collaboration, CRM wins on memory. A solo founder or two-person team analysing a short list of enterprise deals should stay in Excel. A five-person SDR team running 400 accounts should not — the coordination cost eats the license savings within a month. Browse the CRM category on G2 if you're near that line and want to price the alternative honestly.
One nuance worth stating: many teams that "moved to a CRM" still run their forecast in a spreadsheet export. That's fine. The CRM holds the record, Excel holds the model. The failure mode is the reverse — the spreadsheet holding the record with no backup.
How do you keep the contact data from rotting?#
This is where spreadsheet pipelines quietly die, and it has nothing to do with formulas.
A CRM at least flags bounces back to the record. Excel does not. So a workbook accumulates dead contacts — people who left, addresses that were guessed, domains that changed after an acquisition — and every one of them holds a stage value that inflates your forecast. B2B contact data decays at roughly 2–3% per month. Over a year, a third of a static list is wrong.
Three habits fix most of it:
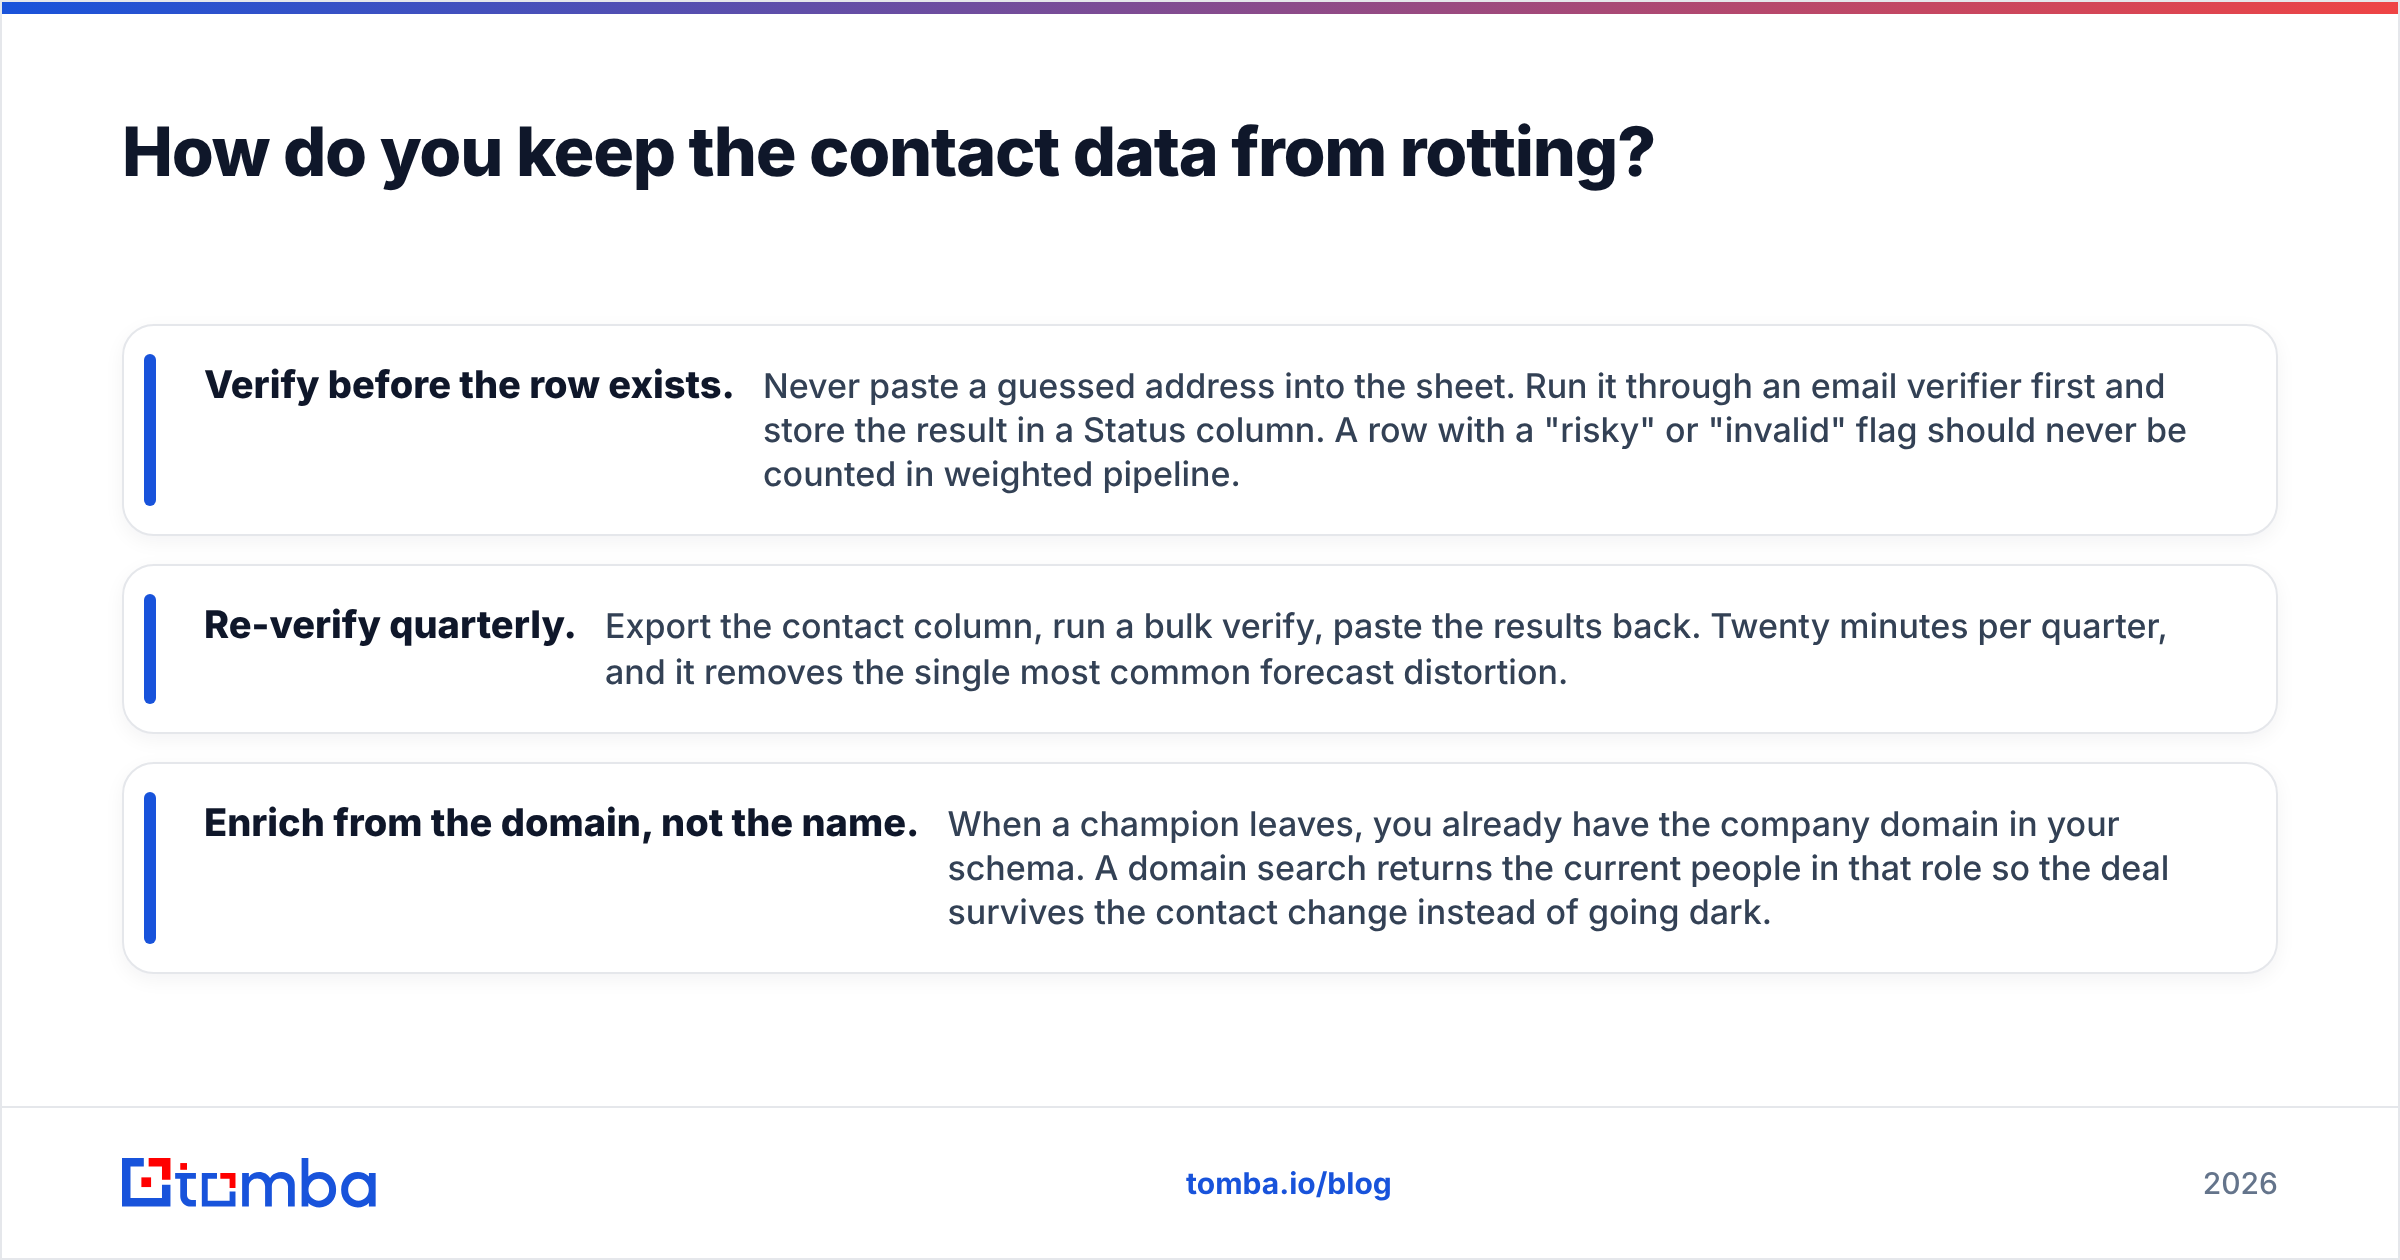
- Verify before the row exists. Never paste a guessed address into the sheet. Run it through an email verifier first and store the result in a Status column. A row with a "risky" or "invalid" flag should never be counted in weighted pipeline.
- Re-verify quarterly. Export the contact column, run a bulk verify, paste the results back. Twenty minutes per quarter, and it removes the single most common forecast distortion.
- Enrich from the domain, not the name. When a champion leaves, you already have the company domain in your schema. A domain search returns the current people in that role so the deal survives the contact change instead of going dark.
If your pipeline lives in Google Sheets rather than Excel, the Sheets add-on does the same lookups inline, so verification happens in the same tab as the pipeline instead of in a separate export-import loop.

When should you abandon the spreadsheet?#
There are four clear signals. Any two of them together, and the spreadsheet is now costing you more than it saves.
Two people editing simultaneously. Excel co-authoring on a workbook with pivots, named ranges, and conditional formatting is not reliable. The moment you see "Copy of Pipeline (1).xlsx" in a shared folder, you have already lost the single source of truth.
More than 200 open rows. Not because Excel can't handle it — it handles a million — but because no human reviews 200 rows weekly with real attention. Beyond that count you need filtered views, assignment logic, and reminders, which is a CRM.
Forecast misses by more than 20%, twice. If your weighted model is consistently wrong, the input data is stale, not the math. A tool that timestamps every stage change fixes that; a workbook where stages are edited silently cannot.
Anyone asks "when did this deal change stage?" Excel has no answer unless you built a change log. That question is the actual boundary between a review surface and a system of record.
Conversely, do not switch just because a competitor uses Salesforce. A well-maintained spreadsheet with verified contacts beats a CRM nobody populates. The most expensive pipeline tool in B2B is a $150/seat platform with empty next-step fields.
What does a weekly pipeline review look like in this template?#
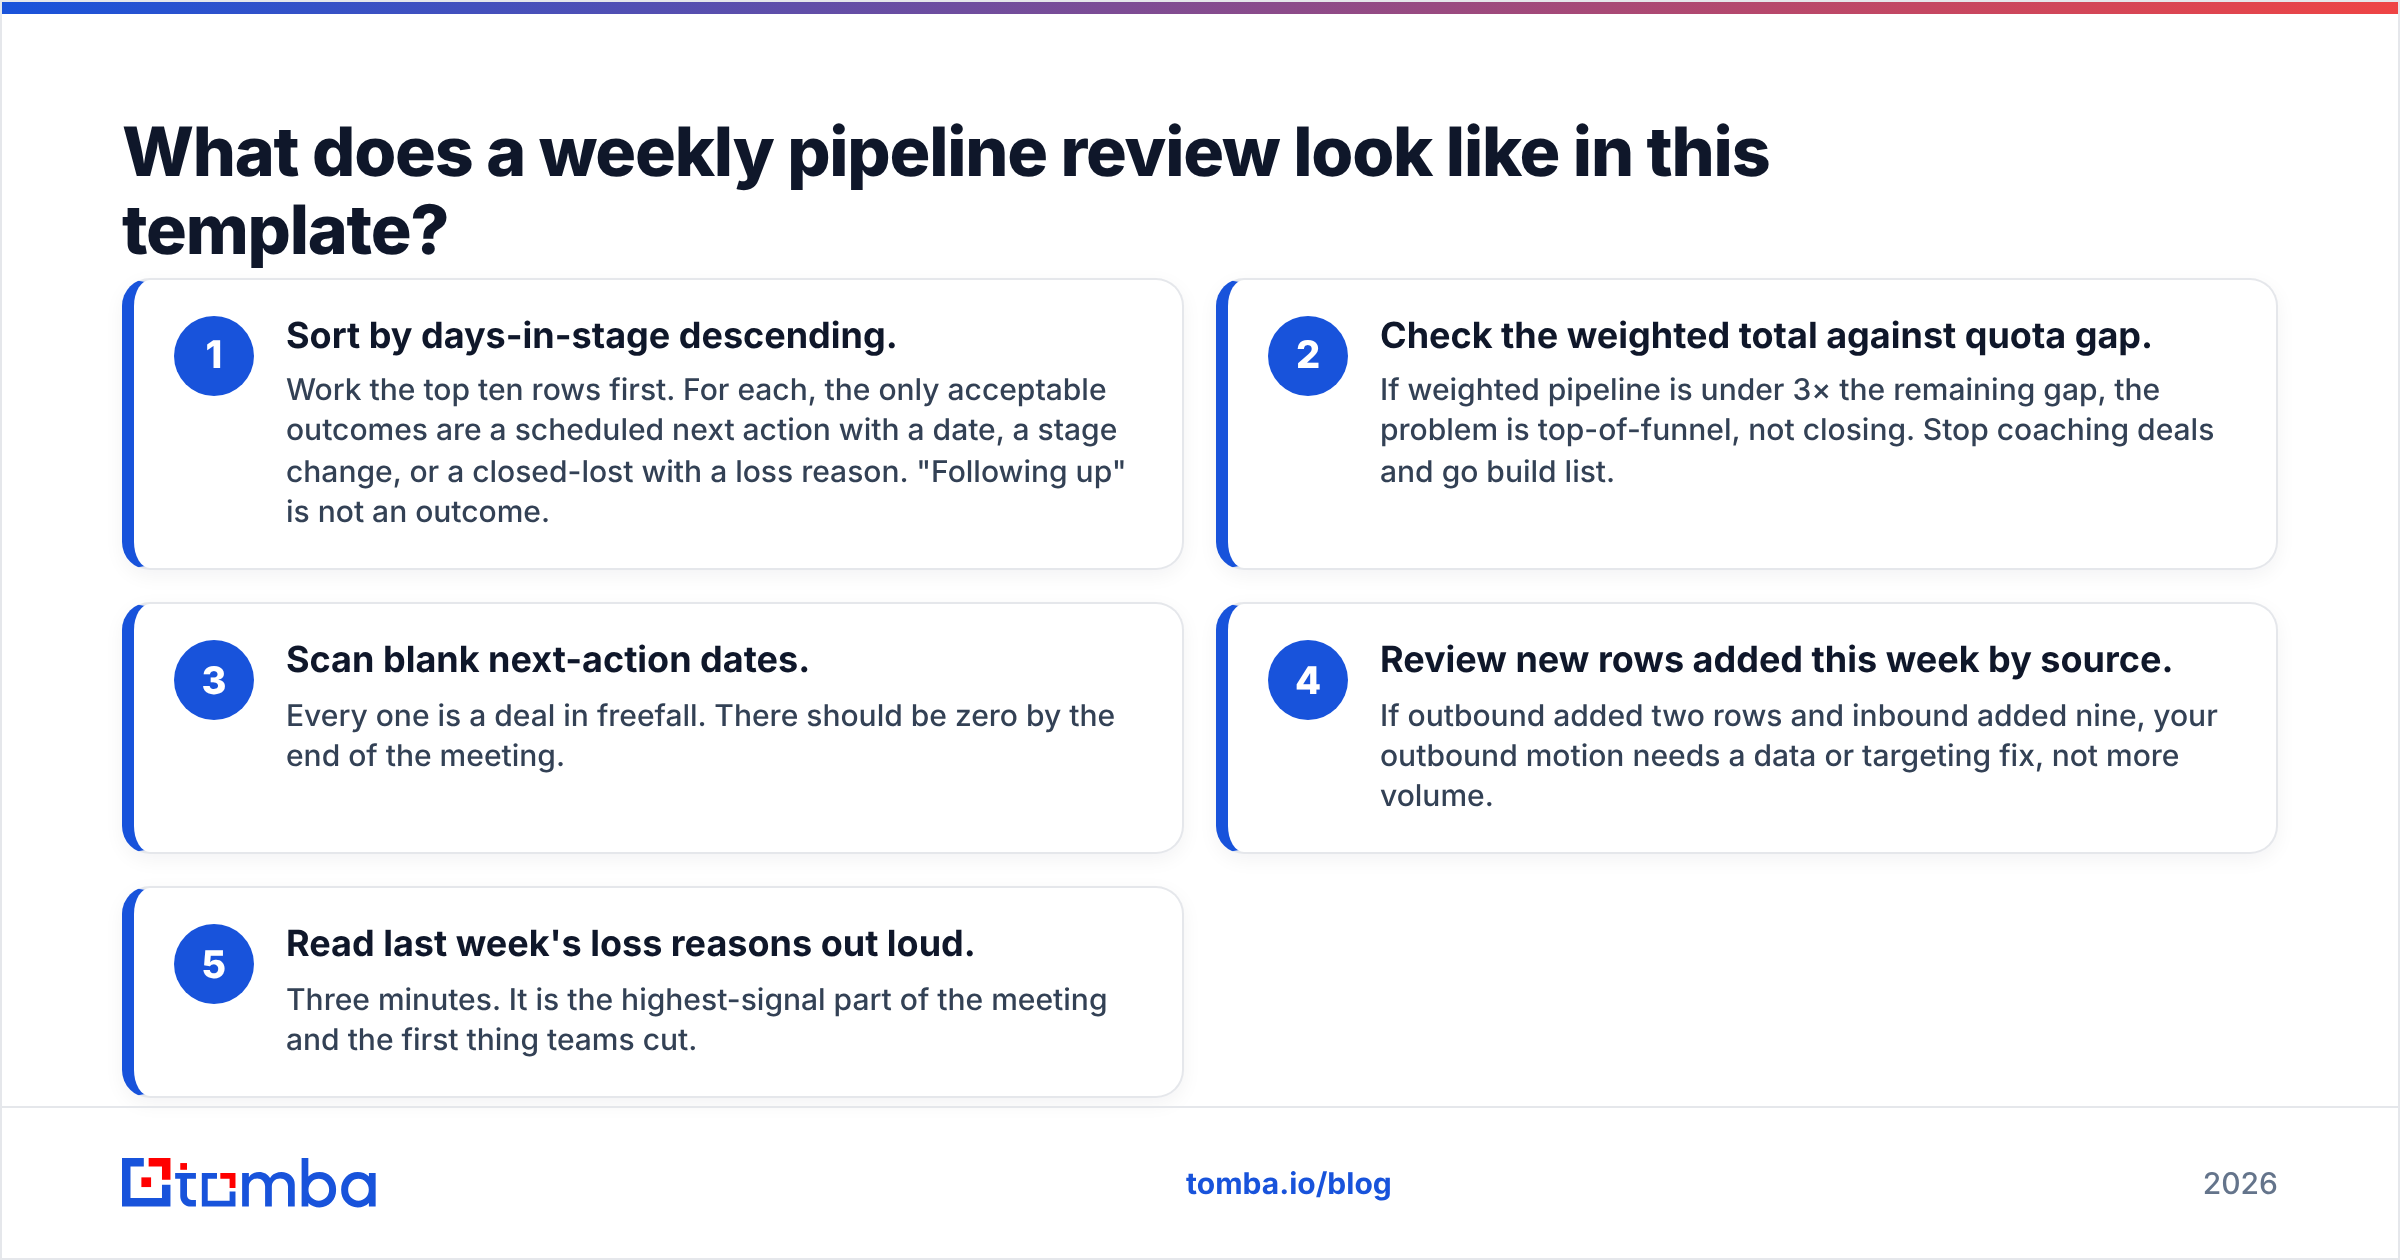
Twenty-five minutes, same order every week:
- Sort by days-in-stage descending. Work the top ten rows first. For each, the only acceptable outcomes are a scheduled next action with a date, a stage change, or a closed-lost with a loss reason. "Following up" is not an outcome.
- Check the weighted total against quota gap. If weighted pipeline is under 3× the remaining gap, the problem is top-of-funnel, not closing. Stop coaching deals and go build list.
- Scan blank next-action dates. Every one is a deal in freefall. There should be zero by the end of the meeting.
- Review new rows added this week by source. If outbound added two rows and inbound added nine, your outbound motion needs a data or targeting fix, not more volume.
- Read last week's loss reasons out loud. Three minutes. It is the highest-signal part of the meeting and the first thing teams cut.
That cadence is what makes the template useful. The workbook is a prop; the review is the product. A team running this discipline in Excel will outperform a team with a beautifully configured CRM and no weekly rhythm — and understanding your win rate per stage is what turns the review from opinion into arithmetic.
What about filling the top of the pipeline?#
A template only forecasts what's in it. Empty rows forecast nothing, and this is where most spreadsheet pipelines actually fail — not in the formulas, but in a Qualified stage with four deals in it.
The mechanical version of top-of-funnel for a spreadsheet workflow: build a target account list by domain, find the decision-maker at each, verify the address, then create one row per verified contact with the source tagged. Because your schema is domain-keyed, this is a paste operation rather than a data-entry project. Fifty accounts becomes fifty rows in under an hour, and every row has a reachable human attached.
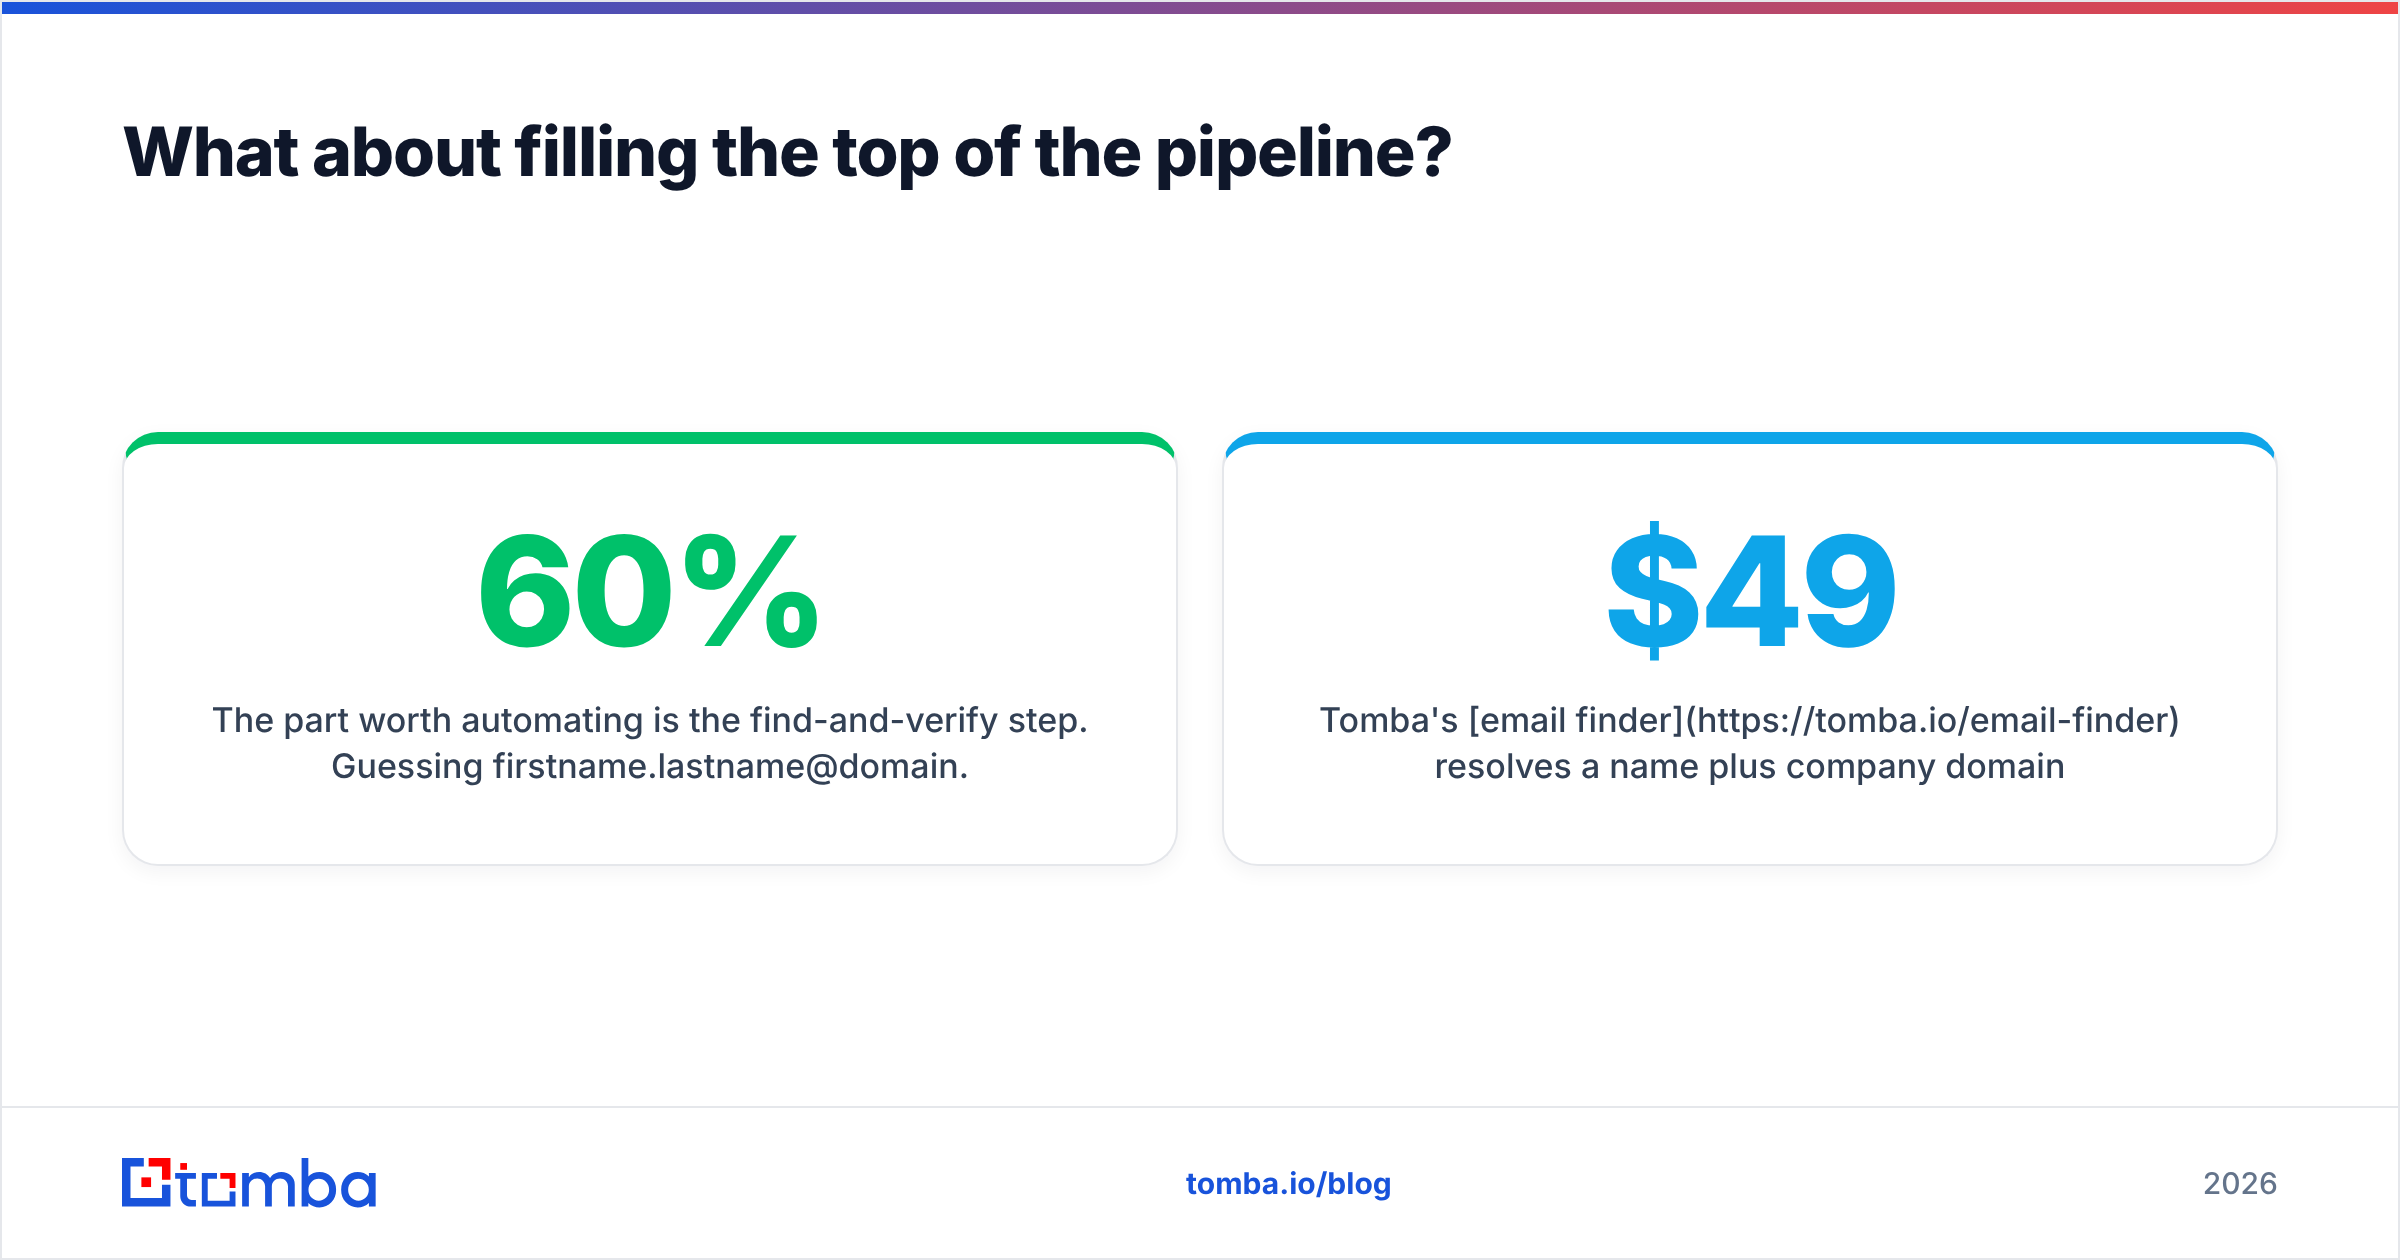
The part worth automating is the find-and-verify step. Guessing firstname.lastname@domain.com produces a 40–60% bounce rate depending on industry, and each bounce damages your sending domain in a way that outlasts the deal.
Tomba's email finder resolves a name plus company domain into a verified professional address, with the free tier covering 25 searches a month if you want to test the workflow against your own accounts before paying for anything. Paid plans start at $49/mo on Starter and $99/mo on Growth — see Tomba pricing for the credit breakdown. Populate your Excel pipeline template with verified contacts instead of guesses, and the forecast column starts telling you the truth.
Related guides#
Ready to find emails that actually work?
Join 150,000+ professionals who stopped guessing and started sending. Free credits on signup — no credit card required.
Get the Tomba newsletter
Practical outbound tactics and product updates — once every two weeks.
About the author