Expansion Rate: How to Measure, Benchmark, and Grow It
Expansion rate is the quietest growth lever in B2B SaaS — and the easiest one to fake. Here's the formula, honest 2026 benchmarks by segment, and the five things that actually move it.
TL;DR
- Expansion rate measures the percentage of recurring revenue you add from existing customers through upsells, cross-sells, and seat growth — before subtracting churn.
- Formula:
(Expansion MRR / Starting MRR) × 100. Keep it separate from net revenue retention (NRR), which nets out churn and contraction and therefore hides a weak expansion motion. - Median B2B SaaS expansion rate in 2026 sits around 8–14% annually for SMB-focused products and 20–35% for enterprise-heavy, usage-priced products.
- The single most common cause of a stalled expansion rate isn't pricing — it's stale contact data. Your champion left, nobody noticed, and the renewal quietly flatlined.
- Fix the boring inputs first: verified contacts on every account, multithreaded relationships, and usage triggers wired to a human follow-up.
What is expansion rate?#
Expansion rate is the percentage of your existing recurring revenue base that grows through additional purchases in a given period. It counts upgrades, added seats, usage overages, cross-sold modules, and price increases customers accepted. It does not count new logos, and it does not subtract churn.
Think of it like a garden you already planted. New business is buying more seeds. Expansion rate is how much the existing plants grew this season. Most teams obsess over the seed budget and never measure the growth — then wonder why the yield is flat.
The distinction matters because expansion rate is the only retention metric that is purely offensive. Gross revenue retention (GRR) is defense — the best you can score is 100%. Net revenue retention combines both, which is useful for investors and useless for diagnosing what your team should do differently on Monday.
How do you calculate expansion rate?#
The base formula:
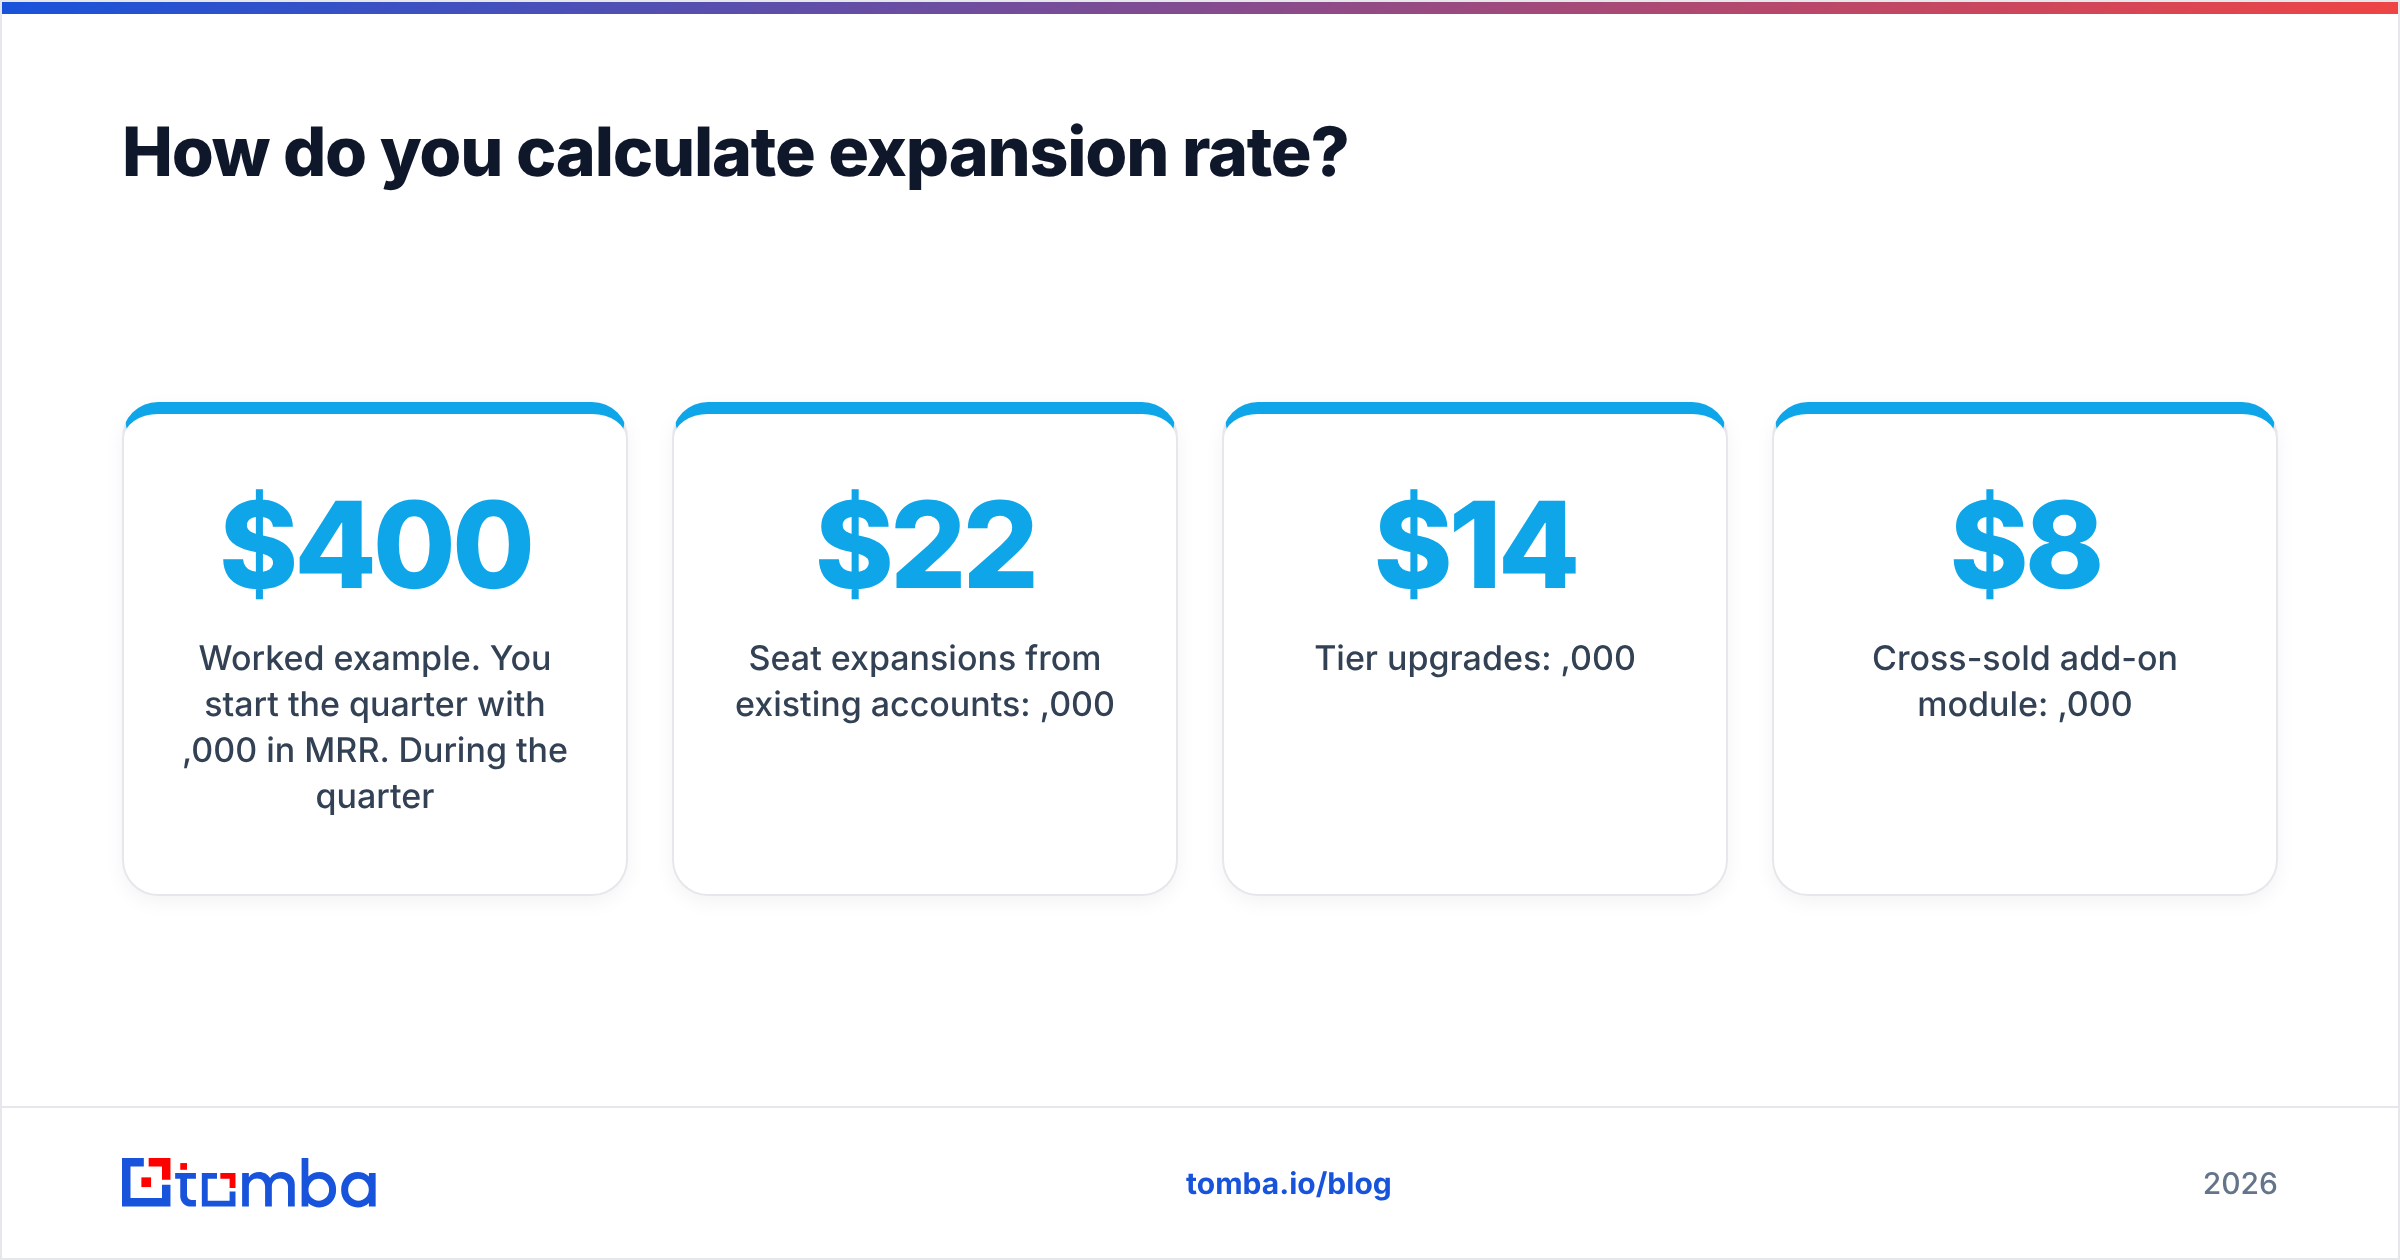
Expansion Rate = (Expansion MRR in period / MRR at start of period) × 100Worked example. You start the quarter with $400,000 in MRR. During the quarter:
- Seat expansions from existing accounts: $22,000
- Tier upgrades: $14,000
- Cross-sold add-on module: $8,000
- Churned MRR: $18,000
- Contraction (downgrades): $9,000
- New logo MRR: $60,000
Expansion MRR = $22,000 + $14,000 + $8,000 = $44,000
Expansion rate = ($44,000 / $400,000) × 100 = 11% for the quarter.
Note what you excluded: the $60,000 in new logos. If you include new business in the numerator you are not measuring expansion, you are measuring bookings with extra steps. Plenty of dashboards get this wrong, usually because the CRM field for "new ARR" doesn't distinguish an upsell opportunity from a net-new one.
Also decide once, in writing, how you treat these edge cases:
- Reactivated accounts — a customer who churned nine months ago and came back is new business, not expansion. Otherwise your churn-and-return loop looks like growth.
- Contractual price escalators — a 5% annual uplift written into the original contract is expansion revenue, but flag it separately so you can see organic expansion without it.
- Usage overages — count them, but track volatility. Overage-driven expansion reverses fast in a downturn.
- Multi-year prepay — normalize to monthly recurring value, not cash collected, or Q1 will look heroic and Q2 will look broken.
- Currency swings — for international books, calculate in constant currency, or FX will masquerade as sales performance.

How does expansion rate compare to NRR, GRR, and churn?#
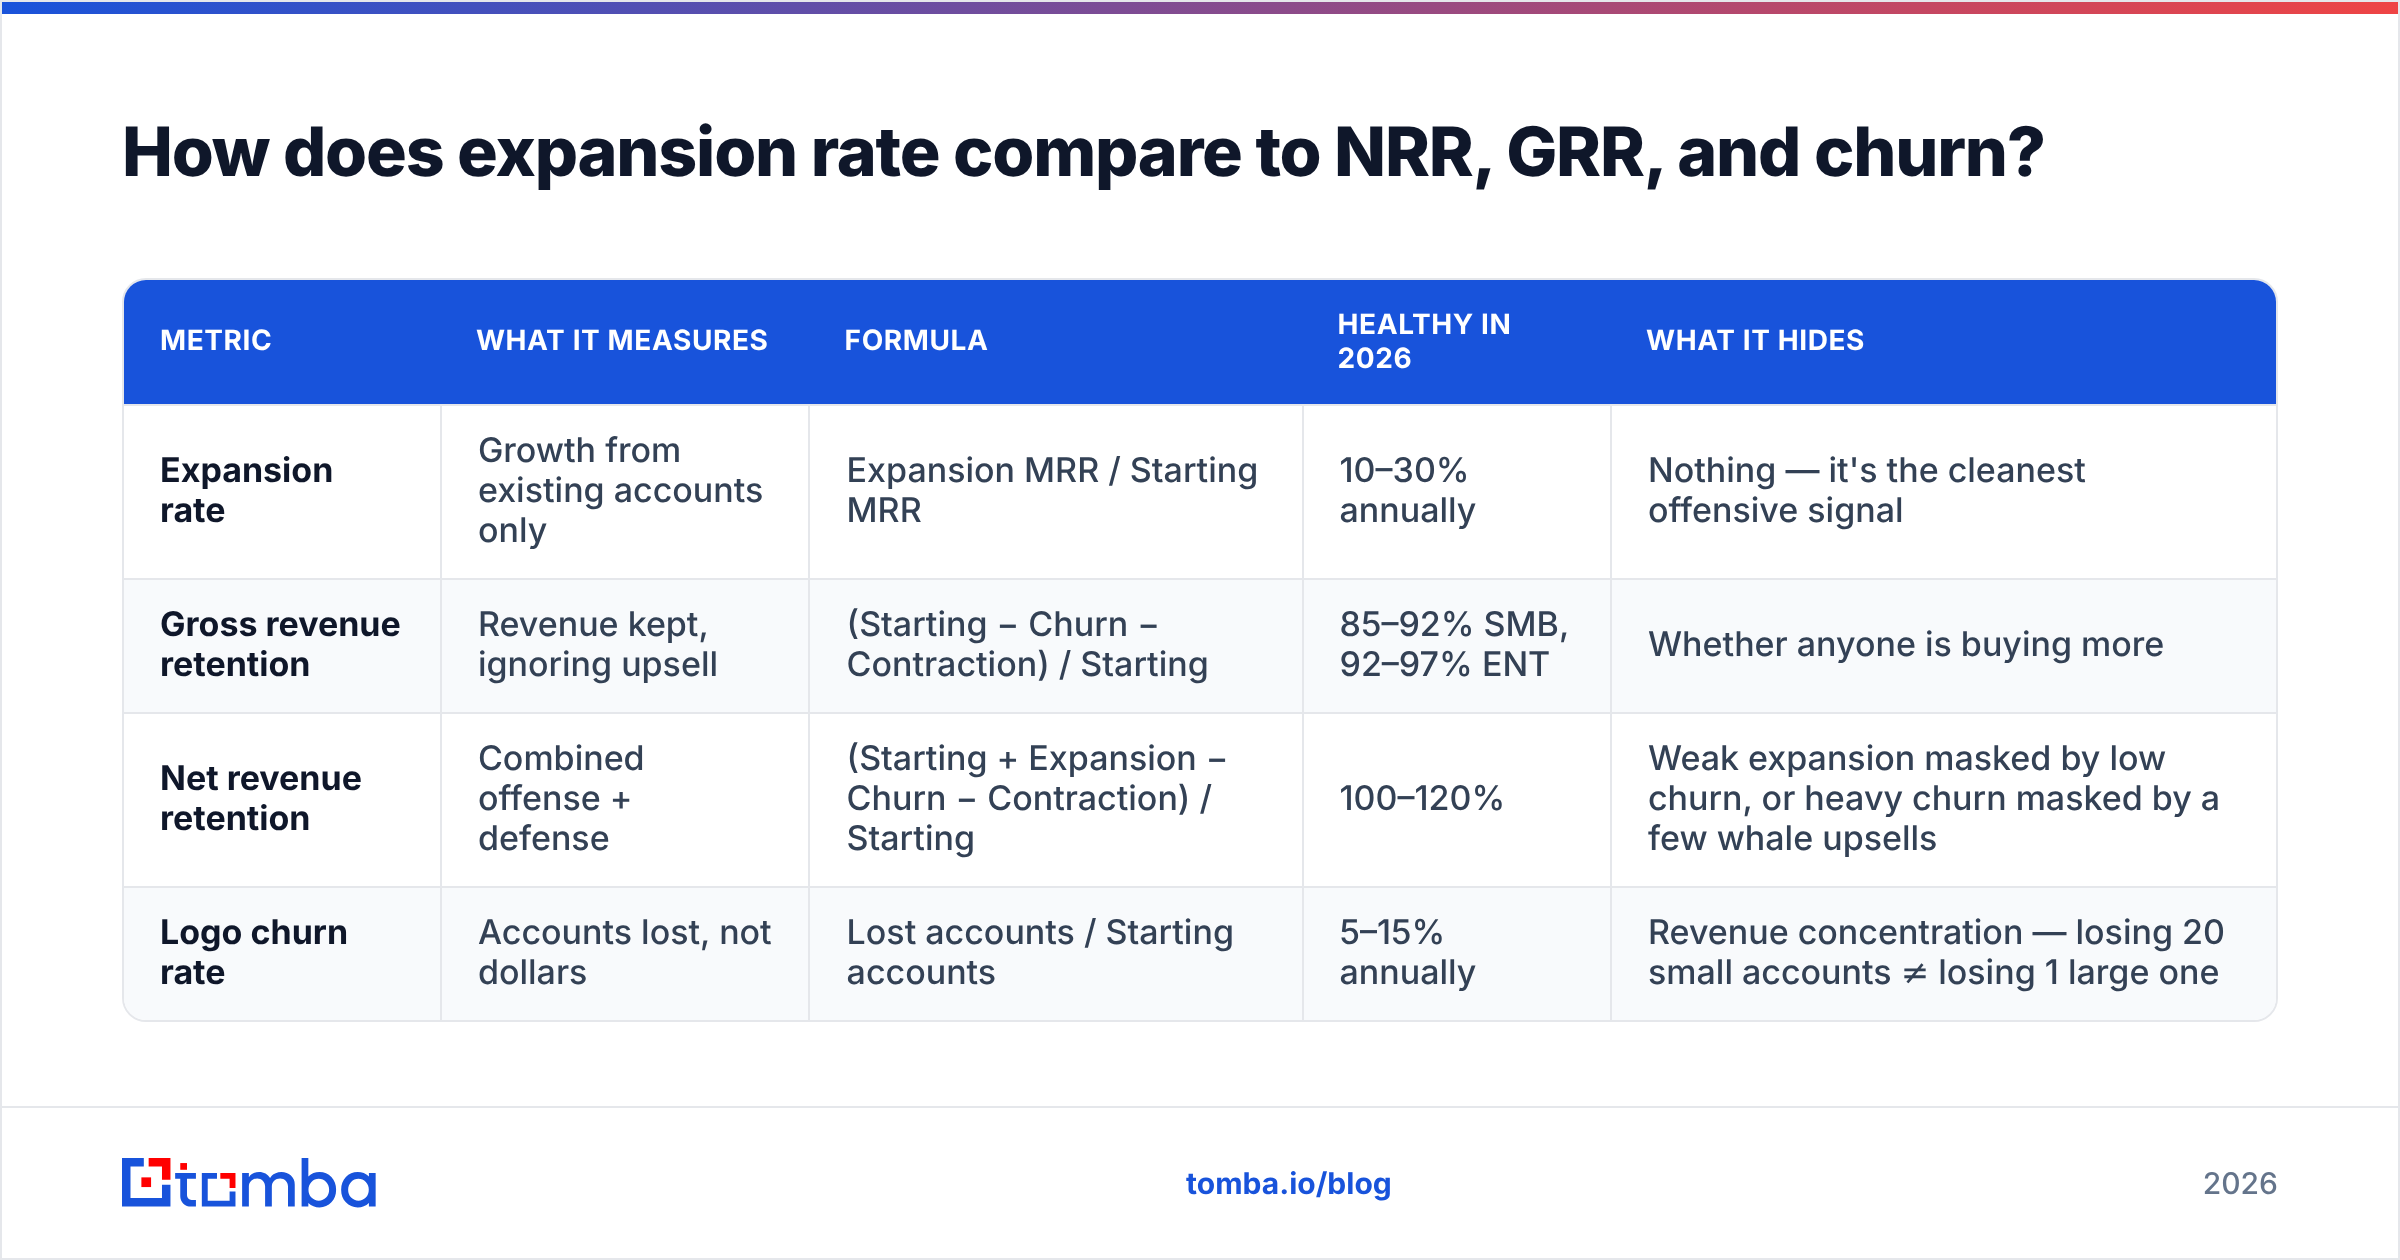
These four metrics get used interchangeably in board decks and they measure very different things. Here's the clean separation.
| Metric | What it measures | Formula | Healthy in 2026 | What it hides |
|---|---|---|---|---|
| Expansion rate | Growth from existing accounts only | Expansion MRR / Starting MRR | 10–30% annually | Nothing — it's the cleanest offensive signal |
| Gross revenue retention | Revenue kept, ignoring upsell | (Starting − Churn − Contraction) / Starting | 85–92% SMB, 92–97% ENT | Whether anyone is buying more |
| Net revenue retention | Combined offense + defense | (Starting + Expansion − Churn − Contraction) / Starting | 100–120% | Weak expansion masked by low churn, or heavy churn masked by a few whale upsells |
| Logo churn rate | Accounts lost, not dollars | Lost accounts / Starting accounts | 5–15% annually | Revenue concentration — losing 20 small accounts ≠ losing 1 large one |
The trap: a company with 97% GRR and 4% expansion rate reports 101% NRR and calls it a win. A company with 88% GRR and 26% expansion rate reports 114% NRR. Both look "over 100%." Only one has a growth engine. Reading the composite metric alone is how a leadership team spends two years optimizing the wrong side of the equation.
If you want the vocabulary standardized across your org, Tomba's B2B glossary and its entry on revenue operations define these consistently — useful when finance, CS, and sales each brought their own definition from their last company.
What is a good expansion rate in 2026?#
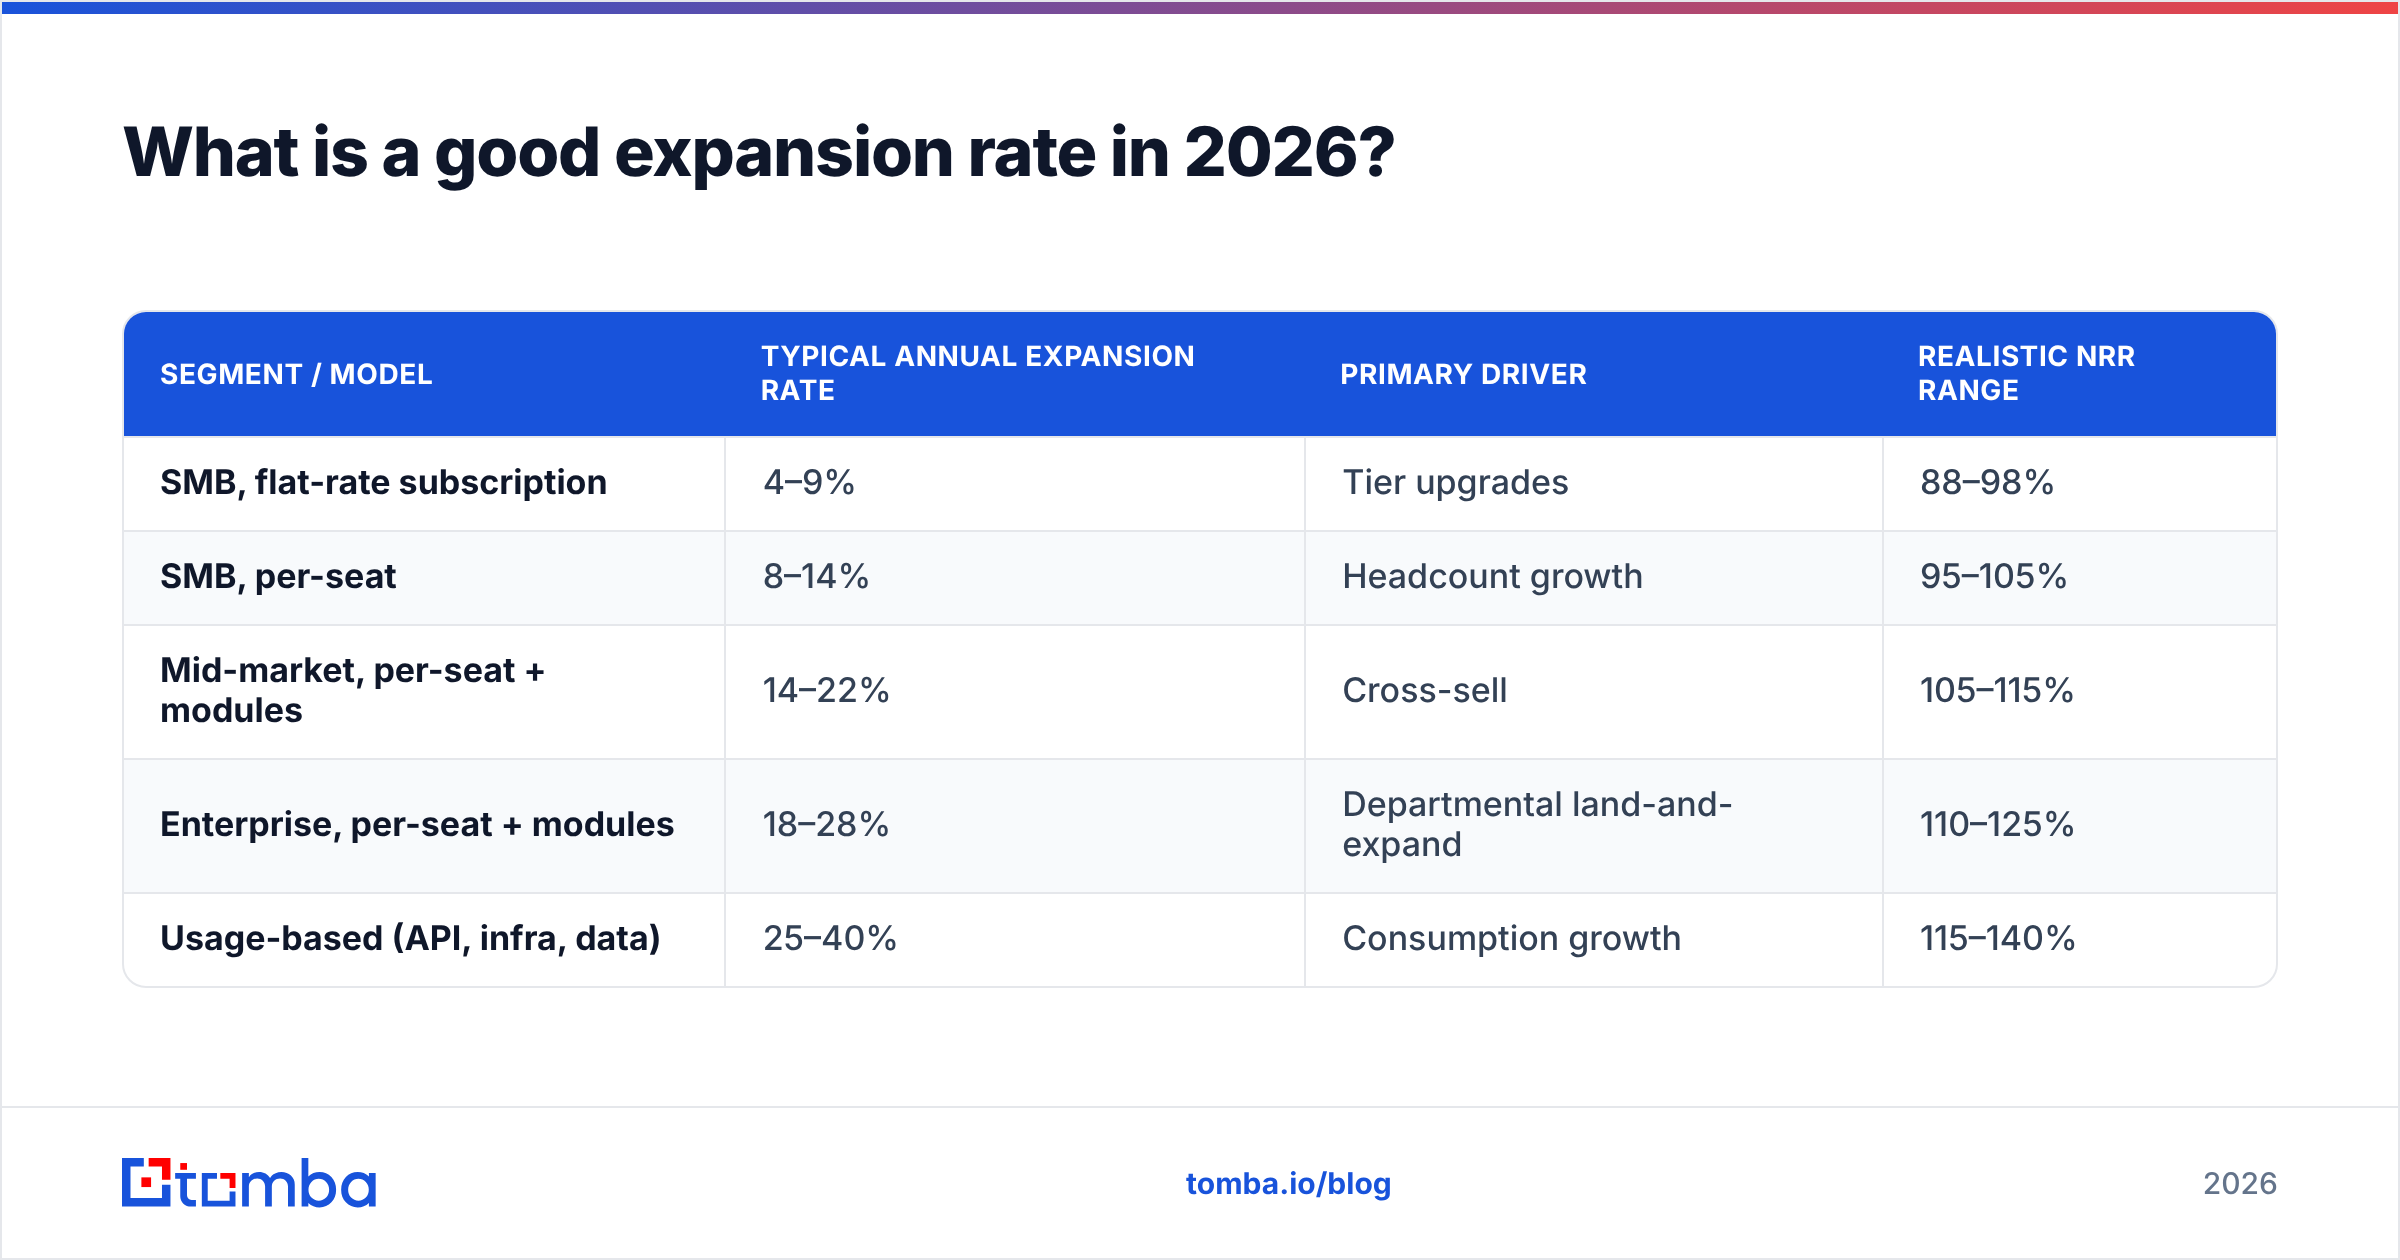
There is no universal number, because expansion rate is mostly a function of your pricing model and your buyer's size. A per-seat tool sold to 12-person agencies has a structural ceiling that a usage-priced infrastructure product does not.
| Segment / model | Typical annual expansion rate | Primary driver | Realistic NRR range |
|---|---|---|---|
| SMB, flat-rate subscription | 4–9% | Tier upgrades | 88–98% |
| SMB, per-seat | 8–14% | Headcount growth | 95–105% |
| Mid-market, per-seat + modules | 14–22% | Cross-sell | 105–115% |
| Enterprise, per-seat + modules | 18–28% | Departmental land-and-expand | 110–125% |
| Usage-based (API, infra, data) | 25–40% | Consumption growth | 115–140% |
Two honest caveats about benchmark shopping. First, public benchmarks skew high because struggling companies don't publish. Second, expansion rate is deeply seasonal in seat-based models — it tracks your customers' hiring, which means Q1 and Q3 look nothing alike. Compare yourself to your own trailing four quarters before you compare yourself to a chart on G2 or a VC's annual survey.
Why does expansion rate stall?#
When expansion flattens, most teams reach for pricing and packaging first. In practice, the causes are usually more mundane and more fixable:
- Your champion left and nobody knew. B2B job-change rates run high, and the average SaaS account has one real internal advocate. When that person leaves, expansion probability drops sharply and renewal risk spikes — often silently, because the CRM still lists their old email.
- Single-threaded accounts. If you have one contact at a 400-person company, you cannot cross-sell into a second department. You don't have the relationships, and often you don't even have the names.
- No usage-to-human trigger. Product telemetry shows an account hitting 90% of its seat limit, and the alert goes to a Slack channel nobody reads. Expansion requires someone to act on the signal within days, not at the next QBR.
- CS owns expansion but isn't compensated for it. Structural, not motivational. If nobody's variable comp moves when an account upgrades, the account doesn't upgrade.
- The upsell path requires a new procurement cycle. If adding a module means a fresh legal review, your expansion rate is capped by your customer's legal department, not your product.
- Dirty data in the expansion list. You built a target list of 300 accounts to expand into, exported contacts, and 30% of the emails bounced. Sequence deliverability tanked, the campaign got shut down, and the motion was labeled "didn't work."
Cause #1 and #6 are the ones almost nobody instruments. They're also the cheapest to fix.
How does contact data affect your expansion rate?#
Directly, and more than most RevOps teams model. Expansion is a sales motion aimed at people, and people move.
Run the arithmetic on a mid-market book. Say you have 500 accounts and an average of 3 known contacts each — 1,500 records. B2B contact data decays at roughly 22–30% per year through job changes, title changes, and domain migrations. That means about 400 of your 1,500 contacts are wrong within twelve months. If those are disproportionately your champions and economic buyers (they are — senior people move more), your expansion motion is running on a list where the highest-value third is broken.
What that looks like operationally:
- Champion tracking. When a contact's email starts bouncing, that's a job-change signal, not an IT glitch. Feed bounces into a workflow that triggers a re-discovery task instead of a suppression.
- Re-finding the person at their new company. Your former champion is now a warm buyer at a new logo. A reverse email lookup on the dead address surfaces the person, and their new employer becomes a high-intent new-business target — one of the highest-converting sources most teams never work.
- Multithreading before you need to. Adding two to four contacts per account in adjacent departments turns a single-threaded account into an expandable one. Domain search does this at the account level — pull the org's known contacts by domain, filter by department, and hand CS a list of names instead of a task called "find more stakeholders."
- List hygiene before every campaign. Running an expansion sequence into an unverified list is how you burn the sending domain that your renewal reminders also use. An email verifier pass before send costs cents per record and protects deliverability across every other program.
- Enrichment on the account record. Headcount growth, funding events, and new tooling in the stack are all expansion triggers. Contact enrichment keeps those fields current so scoring models see reality rather than the state of the world on the day the account was created.

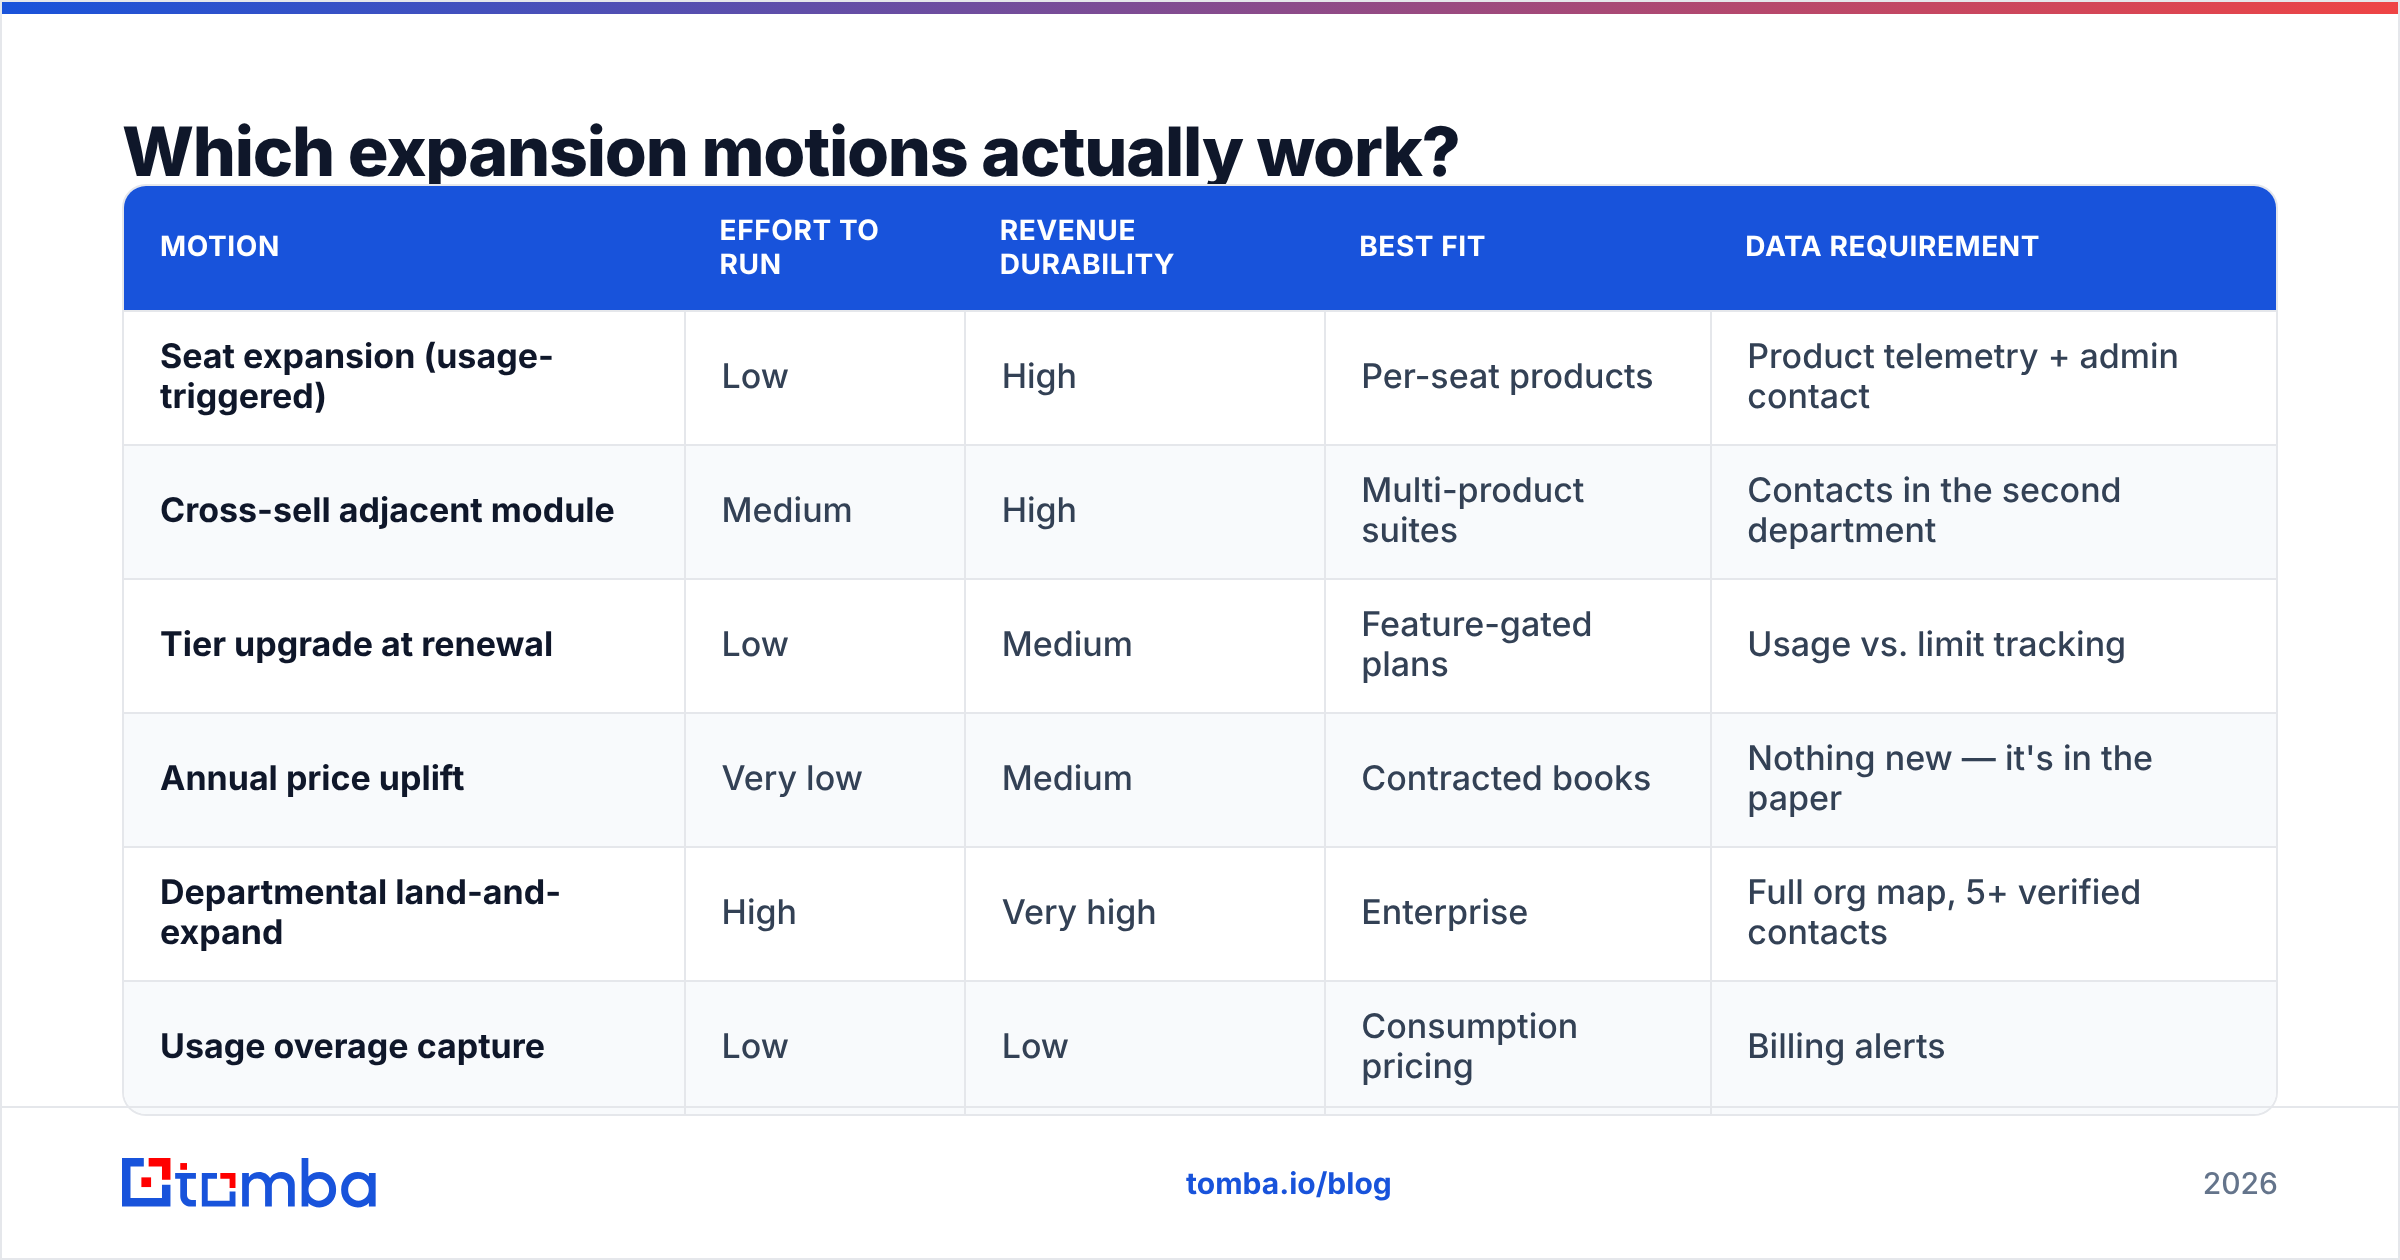
Which expansion motions actually work?#
Not all expansion is equal. Some motions compound; others are one-time sugar hits that inflate a quarter and leave the next one exposed.
| Motion | Effort to run | Revenue durability | Best fit | Data requirement |
|---|---|---|---|---|
| Seat expansion (usage-triggered) | Low | High | Per-seat products | Product telemetry + admin contact |
| Cross-sell adjacent module | Medium | High | Multi-product suites | Contacts in the second department |
| Tier upgrade at renewal | Low | Medium | Feature-gated plans | Usage vs. limit tracking |
| Annual price uplift | Very low | Medium | Contracted books | Nothing new — it's in the paper |
| Departmental land-and-expand | High | Very high | Enterprise | Full org map, 5+ verified contacts |
| Usage overage capture | Low | Low | Consumption pricing | Billing alerts |
The pattern is hard to miss: the motions with the highest durability all require knowing more people at the account. Seat expansion needs the admin. Cross-sell needs a buyer in a department you've never sold to. Land-and-expand needs an org map. This is why teams that treat contact discovery as a top-of-funnel-only tool leave the most valuable expansion revenue untouched.
For a practical starting point, HubSpot's research library on customer retention and revenue growth covers the CS-side playbooks well, and if you're pressure-testing whether your model is actually accretive, the customer lifetime value fundamentals are worth revisiting before you set expansion targets.
How do you build an expansion motion from scratch?#
A 90-day sequence that works for most mid-market teams:
Days 1–15: instrument the metric. Split expansion MRR out of new bookings in the CRM. Add opportunity types for upsell, cross-sell, and seat add. Calculate expansion rate for the trailing eight quarters so you have a real baseline instead of a vibe.
Days 16–30: audit the account data. For your top 100 accounts by ARR, count verified contacts. Anything with fewer than three is single-threaded and should be flagged. Run the whole list through verification and log the bounce rate — that number is your data-decay baseline, and it's usually worse than anyone guessed.
Days 31–50: fill the gaps. Use bulk lead generation to add two to four contacts per under-threaded account, targeting the departments your cross-sell module serves. Verify before importing. Assign each new contact an owner; unowned contacts don't get worked.
Days 51–70: wire the triggers. Pick three product signals that predict expansion (seat utilization above 85%, a second team creating workspaces, API call volume trending up 30% month over month). Route each to a task with an SLA, not to a dashboard.
Days 71–90: run and measure. Work the flagged accounts. Report expansion rate weekly against baseline, separated from new business. Kill the motions that don't move it within two quarters instead of defending them for a year.
The unglamorous truth is that steps two and three — the data steps — take the longest and produce most of the lift. Teams that skip them build a beautiful trigger architecture that fires alerts at contacts who left eight months ago.
What should you track alongside expansion rate?#
Expansion rate on its own can be gamed by one enormous upsell. Pair it with:
- Expansion rate excluding top account — if removing one logo halves the number, you have a customer, not a motion.
- Percentage of accounts expanding — breadth matters more than depth for durability. 18% of accounts expanding beats 3% of accounts expanding hugely.
- Contacts per account, verified — your leading indicator. It moves before expansion rate does.
- Time from usage trigger to human touch — the operational bottleneck in almost every stalled motion.
- Champion turnover rate — how many of your primary contacts changed jobs this quarter, and how many did you re-establish.
Track these five for two quarters and the reason your expansion rate is where it is will stop being a mystery.
Get the contact layer right first#
Expansion rate is downstream of relationships, and relationships are downstream of knowing who works where — today, not last year. Before you rewrite pricing or rebuild the QBR deck, make sure your accounts are multithreaded with contacts that actually resolve.
The Tomba Email Finder finds professional email addresses by domain, name, or company, so you can map the departments you haven't sold into and re-establish champions who moved on. The free tier covers 25 searches a month if you want to test it against a handful of accounts first; paid plans start at $49/mo, with full details on Tomba pricing. Start with your twenty largest single-threaded accounts — that's usually where the next quarter's expansion revenue is already sitting, waiting for someone to find the right person to talk to.
Related guides#
Ready to find emails that actually work?
Join 150,000+ professionals who stopped guessing and started sending. Free credits on signup — no credit card required.
Get the Tomba newsletter
Practical outbound tactics and product updates — once every two weeks.
About the author