Expansion Revenue in 2026: The Complete Operator's Guide
Expansion revenue is now the largest growth line in most B2B software companies — and the easiest one to fake with a flattering NRR chart. Here's how to measure it, benchmark it, and build a repeatable expansion pipeline.
TL;DR
- Expansion revenue is additional recurring revenue from customers you already have: seat growth, tier upgrades, cross-sells, and usage overage. It excludes new logos and excludes renewals at flat price.
- Net revenue retention (NRR) is the headline metric, but NRR alone hides the story. Always read it next to gross revenue retention (GRR) — a 110% NRR built on 80% GRR is a leaky bucket with a big hose pointed into it.
- Expansion typically costs a fraction of new-logo acquisition. Most benchmark studies put expansion CAC somewhere between one-third and one-half of new business CAC, which is why boards push on it in flat-budget years.
- The bottleneck is almost never willingness to buy. It's data: knowing who joined the account, who got promoted, which team started using the product, and who actually controls budget.
- Build the motion in three layers — signal capture, contact accuracy, and a named owner per account — before you write a single upsell email.
What is expansion revenue?#
Expansion revenue is the recurring revenue you add inside existing customer accounts during a period, on top of what they already paid you.
Think of it like a restaurant. New-logo revenue is getting a stranger through the door. Expansion revenue is the second bottle of wine, the dessert, and the fact that they booked the private room for twelve people next month. Same relationship, more revenue, near-zero acquisition cost.
In practice, expansion shows up in four shapes:
- Seat expansion — the customer adds users. Most predictable, most automatable, lowest margin per event.
- Tier upgrade — the customer moves from Starter to Growth to Pro to unlock features or limits. Higher deal value, usually needs a human conversation.
- Cross-sell — the customer buys an adjacent product or module. Often lands with a different buyer inside the same company, which is where most teams stall.
- Usage / consumption growth — API calls, credits, records, GB stored. Grows silently and is the dominant expansion type in usage-priced products.
What is not expansion revenue: a flat renewal, a one-time services fee, a reactivation of a churned account (that's win-back), or a price increase you push across the base with no added value. Some finance teams do book uplift pricing as expansion. That's defensible, but tag it separately or you'll fool yourself about product-led growth.
How do you calculate expansion revenue and NRR?#
The base formula is unglamorous:
Expansion revenue = (Upsell ARR + Cross-sell ARR + Usage overage ARR) from accounts active at the start of the period
Then the ratios that leadership actually reads:
- Net revenue retention (NRR) = (Starting ARR + Expansion − Contraction − Churn) ÷ Starting ARR
- Gross revenue retention (GRR) = (Starting ARR − Contraction − Churn) ÷ Starting ARR, capped at 100%
- Expansion rate = Expansion ARR ÷ Starting ARR
- Expansion share of net new ARR = Expansion ARR ÷ (Expansion ARR + New logo ARR)
That last one is the honest one. If expansion is 60% of your net new ARR and your sales team is 90% new-logo headcount, you have a resourcing problem hiding in plain sight.
Three rules that keep the numbers clean:
- Fix the cohort at period start. Accounts that signed mid-period are new logos, not expansion, no matter how fast they upgraded.
- Never net contraction inside expansion. A downgraded account and an upgraded account are two separate stories. Blending them is how a shrinking base looks healthy.
- Report NRR and GRR on the same slide, always. Gartner and most institutional investors read them as a pair for exactly this reason (gartner.com).
What counts as good expansion revenue in 2026?#
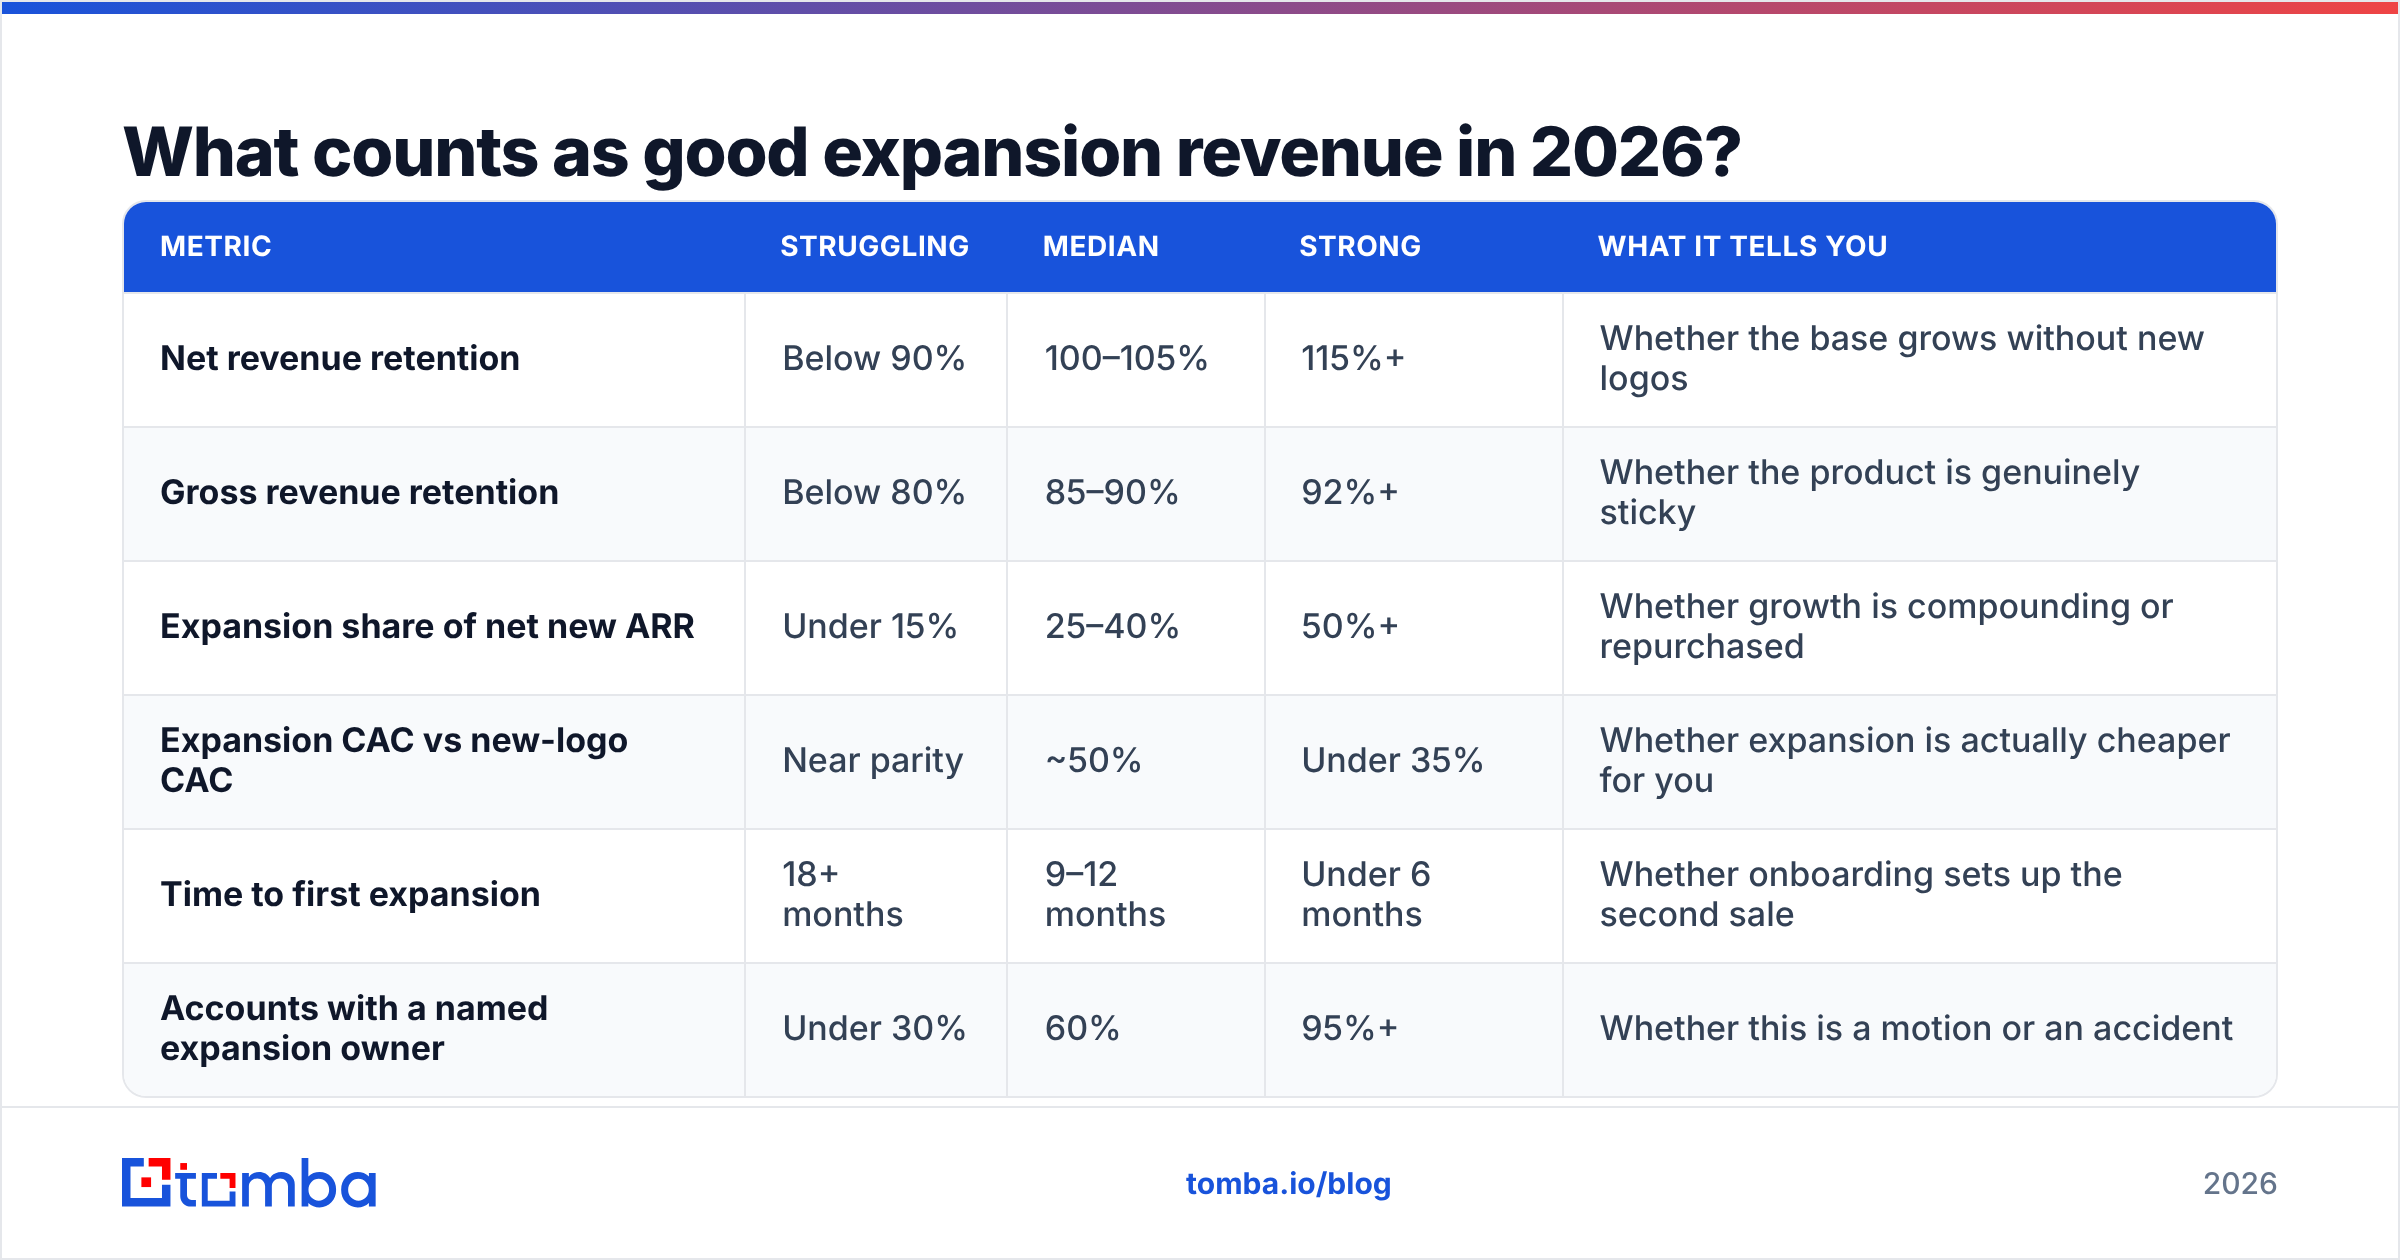
Benchmarks move by segment, pricing model, and who's publishing them, so treat the table below as a directional read rather than gospel. SMB-heavy books run lower on both retention lines; enterprise and usage-priced products run higher on NRR and are more volatile quarter to quarter.
| Metric | Struggling | Median | Strong | What it tells you |
|---|---|---|---|---|
| Net revenue retention | Below 90% | 100–105% | 115%+ | Whether the base grows without new logos |
| Gross revenue retention | Below 80% | 85–90% | 92%+ | Whether the product is genuinely sticky |
| Expansion share of net new ARR | Under 15% | 25–40% | 50%+ | Whether growth is compounding or repurchased |
| Expansion CAC vs new-logo CAC | Near parity | ~50% | Under 35% | Whether expansion is actually cheaper for you |
| Time to first expansion | 18+ months | 9–12 months | Under 6 months | Whether onboarding sets up the second sale |
| Accounts with a named expansion owner | Under 30% | 60% | 95%+ | Whether this is a motion or an accident |
The most common failure I see is a company celebrating 112% NRR while GRR sits at 78%. That means a handful of whale accounts are expanding hard while the long tail quietly bleeds out. Cut NRR by segment and by ARR band before you believe any single number.
Is expansion revenue really cheaper than new logo acquisition?#
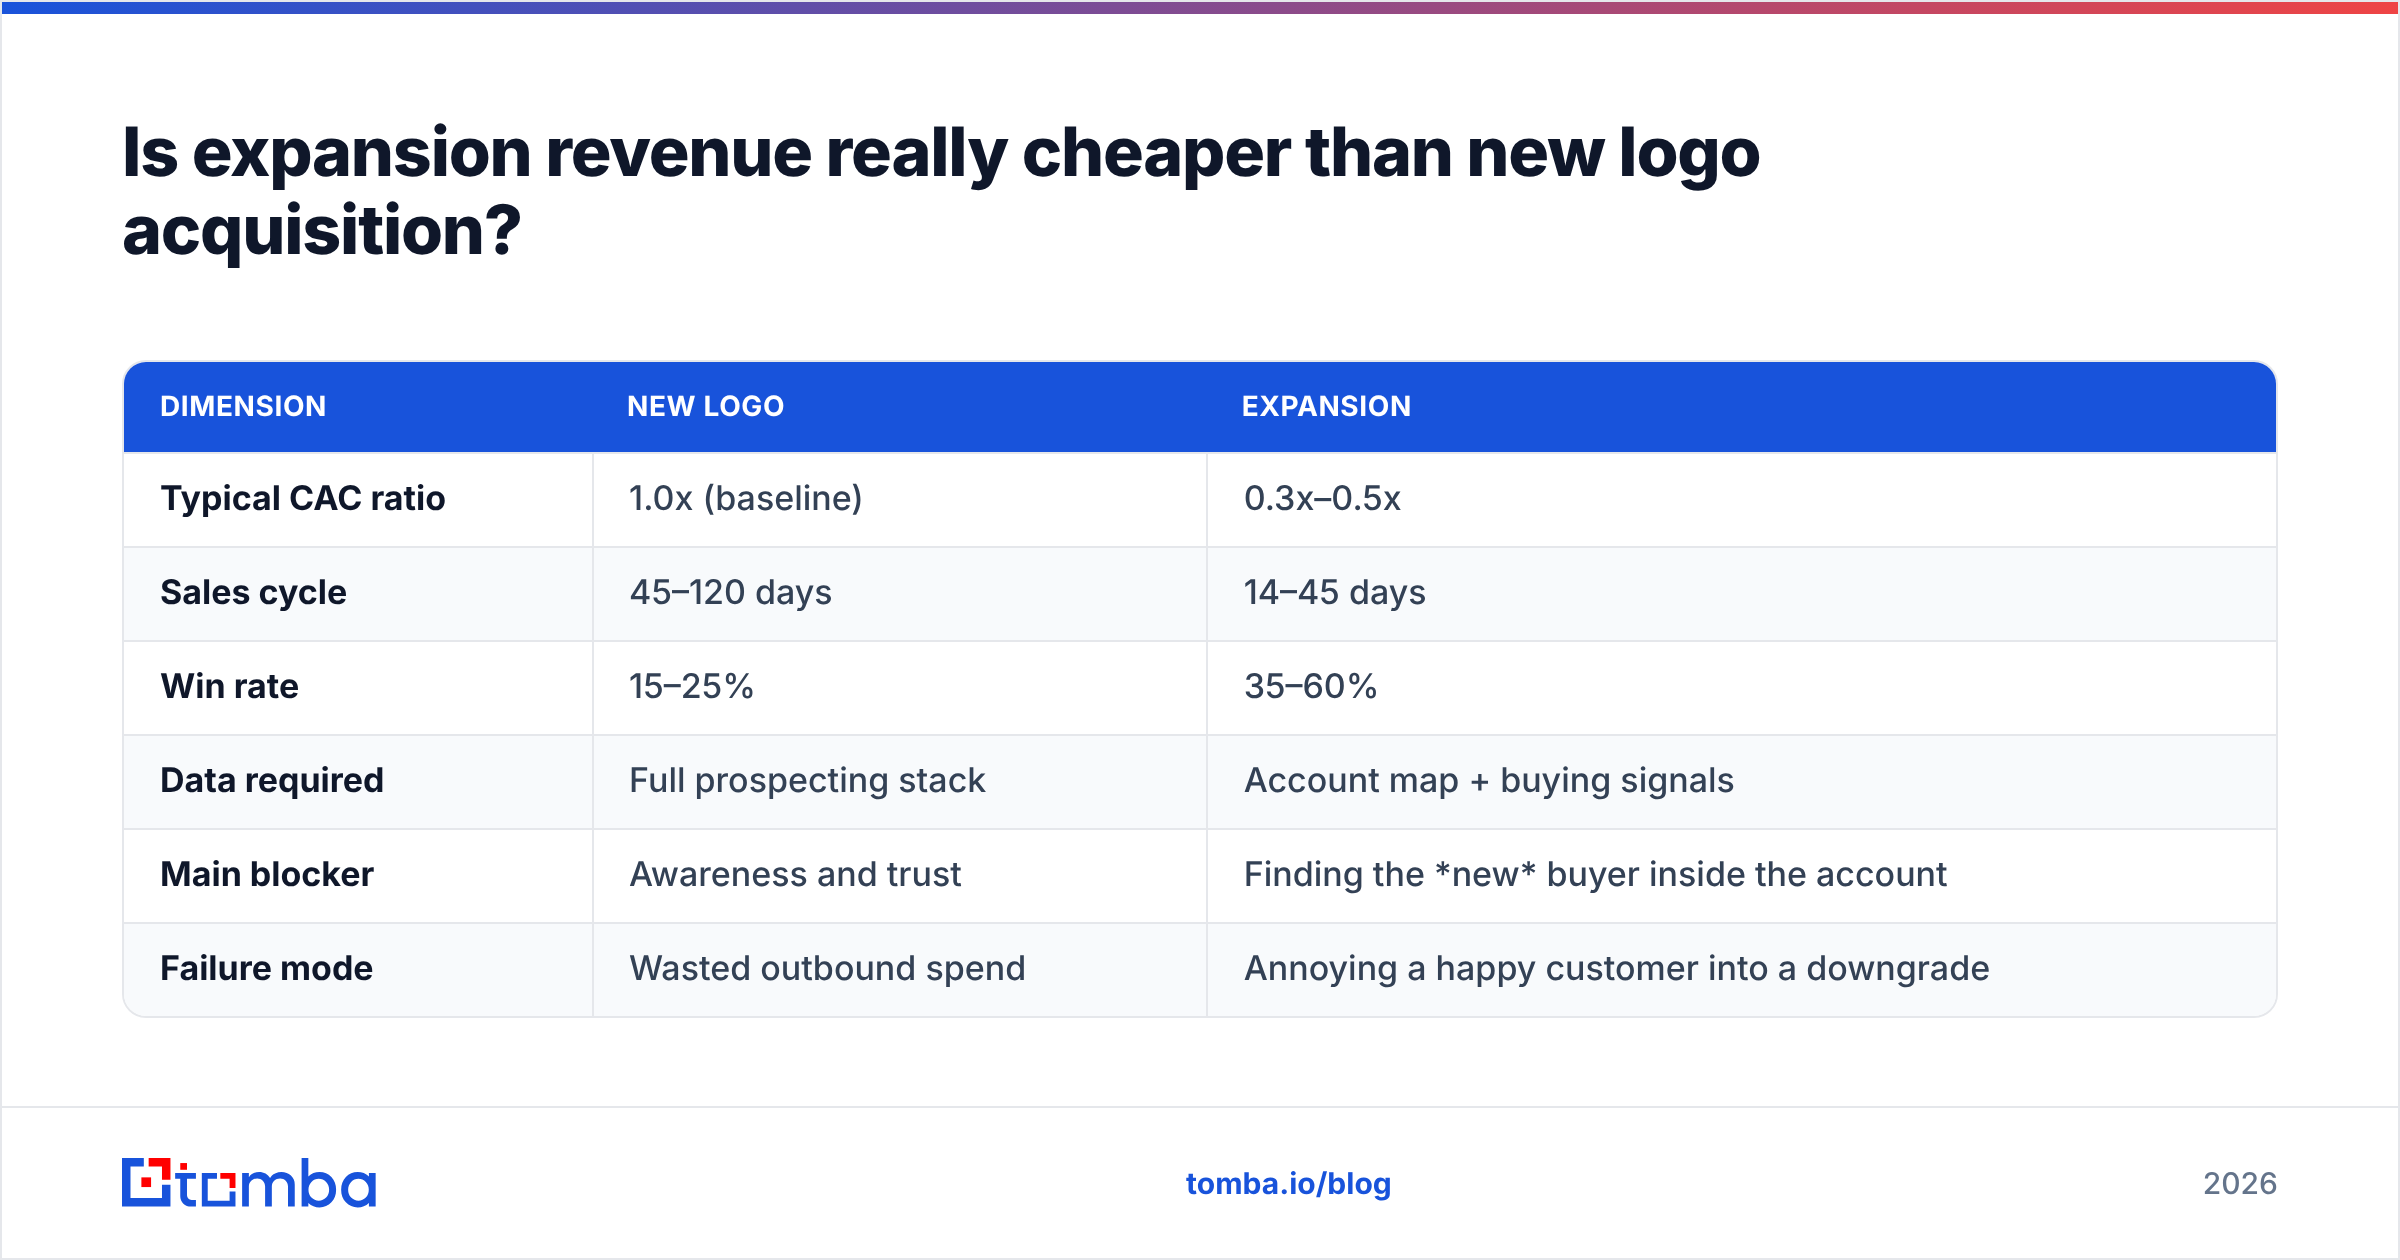
Usually yes, but not automatically — and the gap is narrower than the "5x cheaper to keep a customer" folklore suggests.
| Dimension | New logo | Expansion |
|---|---|---|
| Typical CAC ratio | 1.0x (baseline) | 0.3x–0.5x |
| Sales cycle | 45–120 days | 14–45 days |
| Win rate | 15–25% | 35–60% |
| Data required | Full prospecting stack | Account map + buying signals |
| Main blocker | Awareness and trust | Finding the new buyer inside the account |
| Failure mode | Wasted outbound spend | Annoying a happy customer into a downgrade |
The catch is in the last row. Expansion is cheaper only when it's targeted. A blanket "upgrade now" campaign to your whole base costs almost nothing to send and can cost a lot in goodwill. HubSpot's own research on customer-led growth makes the same point: expansion works when it's tied to observed value delivered, not to your fiscal calendar (blog.hubspot.com).
Which expansion motion should you run first?#
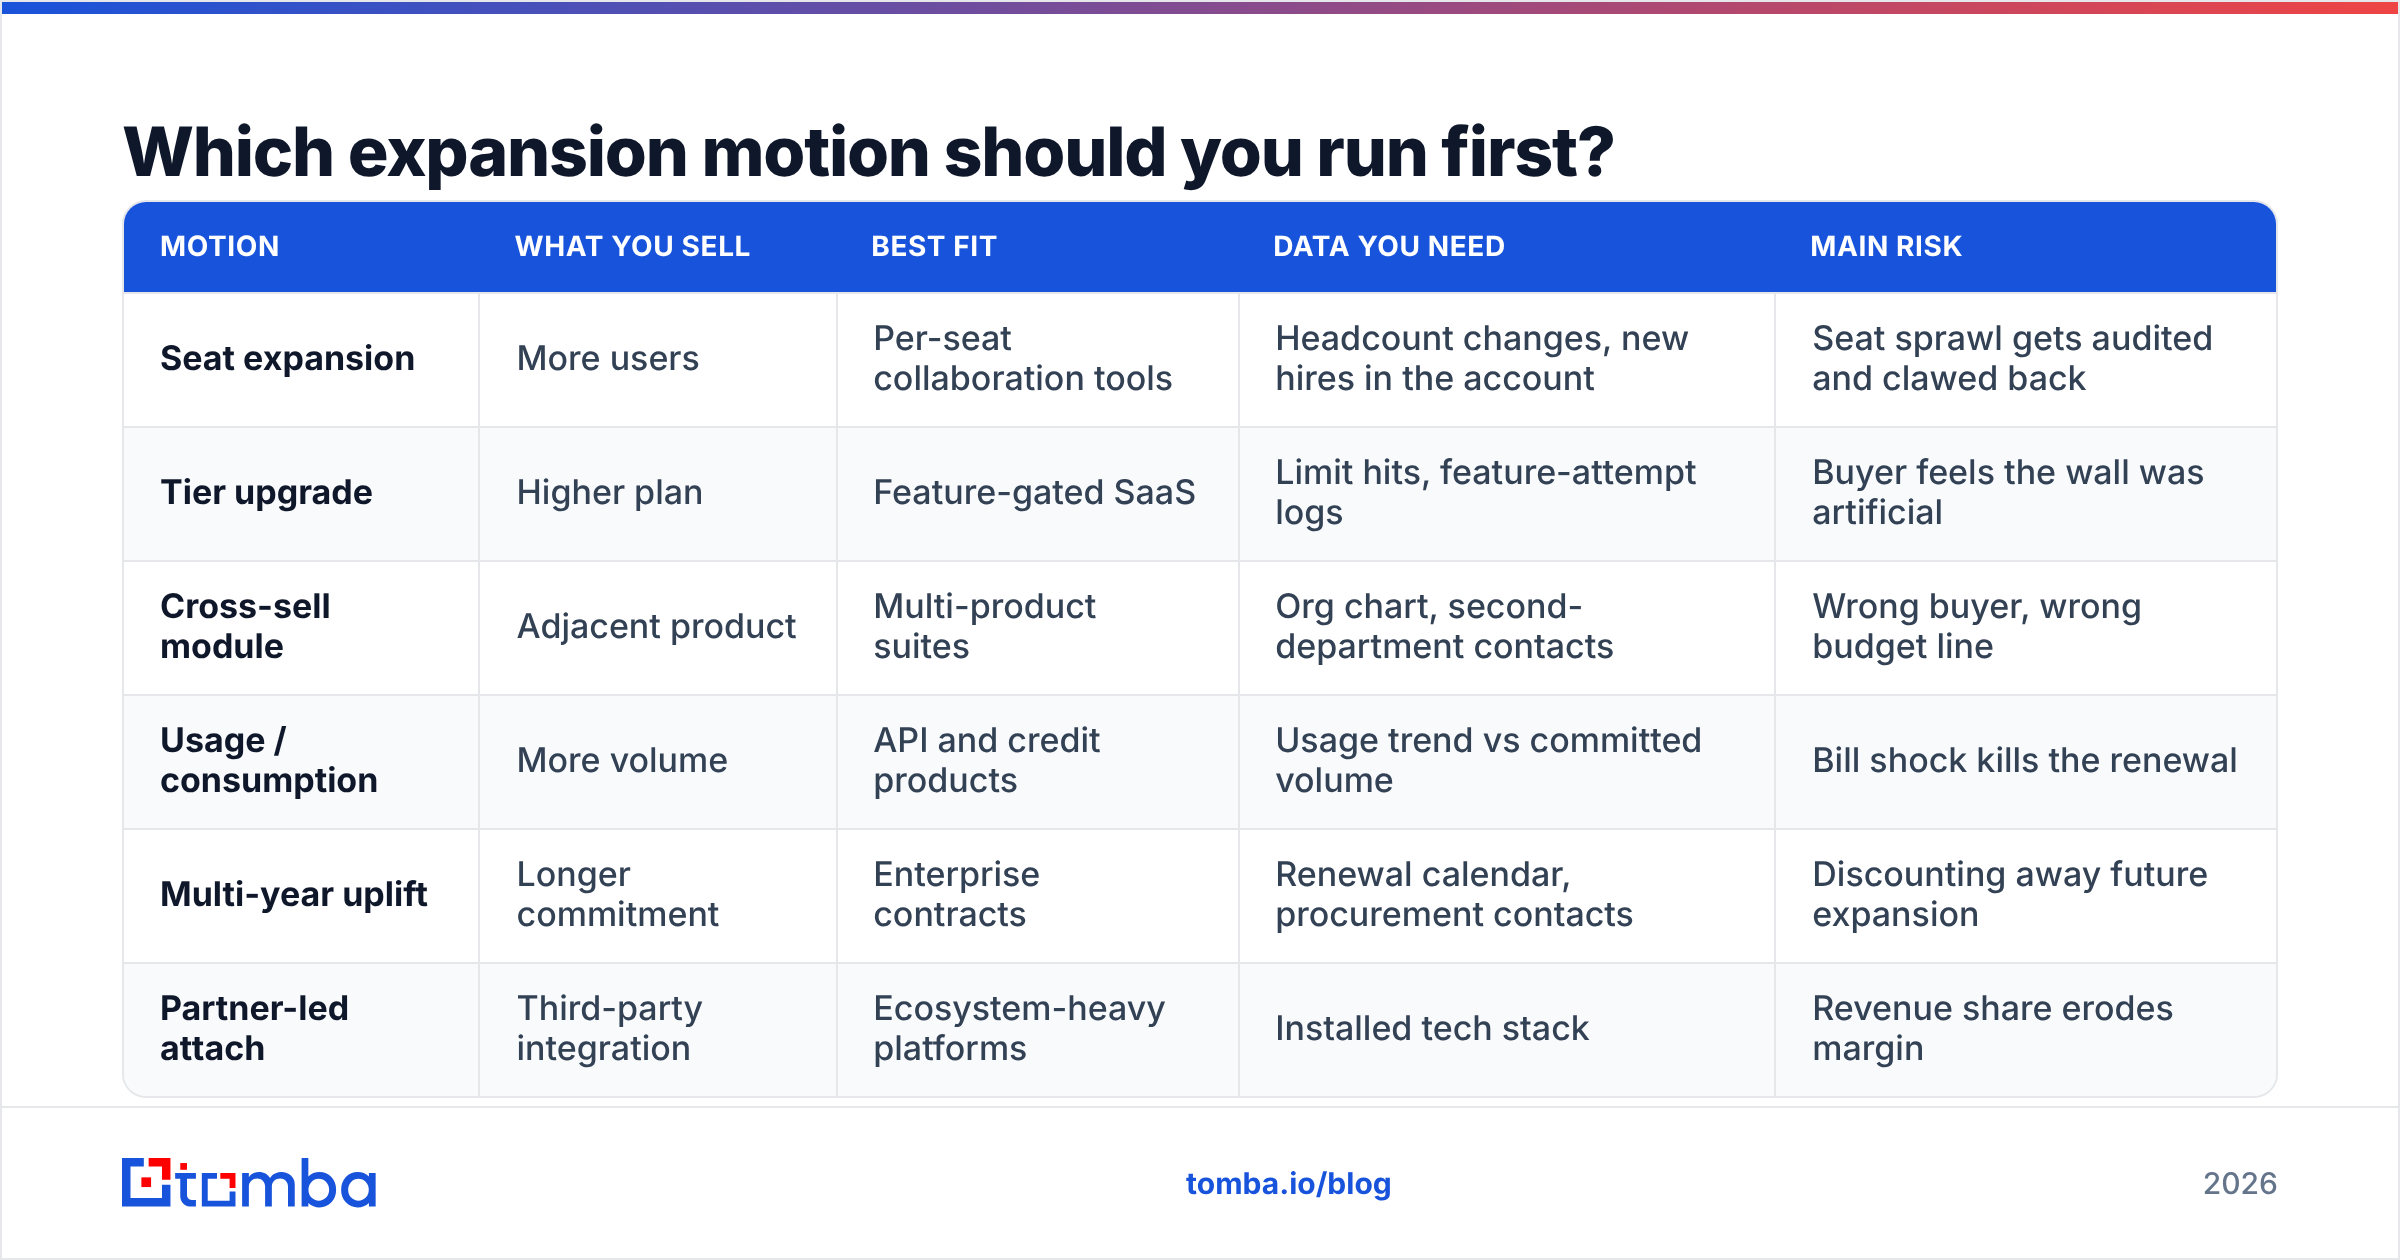
Pick based on your pricing model and how your product creates value, not on what worked at the last company someone on your team came from.
| Motion | What you sell | Best fit | Data you need | Main risk |
|---|---|---|---|---|
| Seat expansion | More users | Per-seat collaboration tools | Headcount changes, new hires in the account | Seat sprawl gets audited and clawed back |
| Tier upgrade | Higher plan | Feature-gated SaaS | Limit hits, feature-attempt logs | Buyer feels the wall was artificial |
| Cross-sell module | Adjacent product | Multi-product suites | Org chart, second-department contacts | Wrong buyer, wrong budget line |
| Usage / consumption | More volume | API and credit products | Usage trend vs committed volume | Bill shock kills the renewal |
| Multi-year uplift | Longer commitment | Enterprise contracts | Renewal calendar, procurement contacts | Discounting away future expansion |
| Partner-led attach | Third-party integration | Ecosystem-heavy platforms | Installed tech stack | Revenue share erodes margin |
For most B2B software companies under $20M ARR, seat expansion plus tier upgrade covers 80% of realistic near-term expansion. Cross-sell is the one everyone wants and the one that fails most often, because it requires reaching a buyer your CSM has never met.
Why does cross-sell fail when the customer already loves you?#
Because "the account" isn't a person. It's twelve people, four of whom have changed jobs since you signed.
Here's the pattern. Your champion in Marketing renews happily. Your cross-sell product is for RevOps. Nobody on your team has a name, an email, or a warm intro into RevOps. So the CSM asks the champion for an introduction, the champion is busy, the request dies in a Slack thread, and the quarter closes with zero cross-sell.
The fix is boring and mechanical: build a real account map before you need it.
- Inventory the org. Pull every relevant department head and manager at the customer domain, not just your users. A domain search across the customer's domain gives you the shape of the org in minutes.
- Fill the contact gaps. CRM records decay at roughly 25–30% a year through job changes alone. Re-verify before every campaign with an email verifier rather than discovering the decay through bounce rates.
- Enrich for context. Title, seniority, department, and tenure decide who gets a peer-level exec email versus a product-led in-app nudge. Push that through data enrichment into the CRM so reps don't research manually.
- Watch the account's own traffic. When three people from a customer domain hit your pricing page, that's an expansion signal with a timestamp. Website visitor reveal turns anonymous sessions into named accounts.
- Assign one owner. Every account gets one human accountable for expansion number, whether that's an AE, a CSM, or an account manager. Shared ownership means no ownership.
- Trigger on value, not on date. "You've processed 40,000 records this quarter, up 3x" beats "checking in about upgrading" every single time.
What signals actually predict expansion?#
Not NPS. Not "the customer seems happy on calls." The signals that hold up under scrutiny are behavioral and organizational:
- Limit proximity — the account is at 80%+ of a plan ceiling (seats, credits, records, API calls). This is the single highest-converting trigger in most usage-priced products.
- Breadth of adoption — the number of distinct teams or departments with active users. Two departments in means a third is reachable.
- New hires in a relevant function — a new Head of Demand Gen at a customer is a cross-sell window that closes in about 90 days, because new leaders re-tool fast.
- Champion promotion — your user became a director. Their budget authority just changed.
- Integration depth — accounts with 3+ connected tools expand more and churn less, because switching cost is now real.
- Support-ticket topic drift — questions about a feature that lives in a higher tier are a pre-qualified upgrade conversation.
Score these, don't just list them. A simple weighted model — limit proximity 40%, adoption breadth 25%, org changes 20%, integration depth 15% — beats rep intuition and takes an afternoon to build in your CRM. If you want the formal framing, this sits squarely inside revenue operations rather than customer success, because it needs data plumbing more than relationship skill.
What breaks expansion revenue programs?#
Five failure modes account for most of it.
Compensation misalignment. If AEs are paid full rate on new logos and half rate on expansion, expansion gets worked last. Pay it at parity or accept the outcome.
Treating expansion as a renewal task. Renewal is defensive, expansion is offensive. Bundling them into one conversation 30 days before contract end means the customer negotiates them together, and you trade discount for upgrade.
No product telemetry in the CRM. If reps can't see usage without asking an analyst, they'll guess. Guessing produces the generic "quick question about your plan" email that nobody answers.
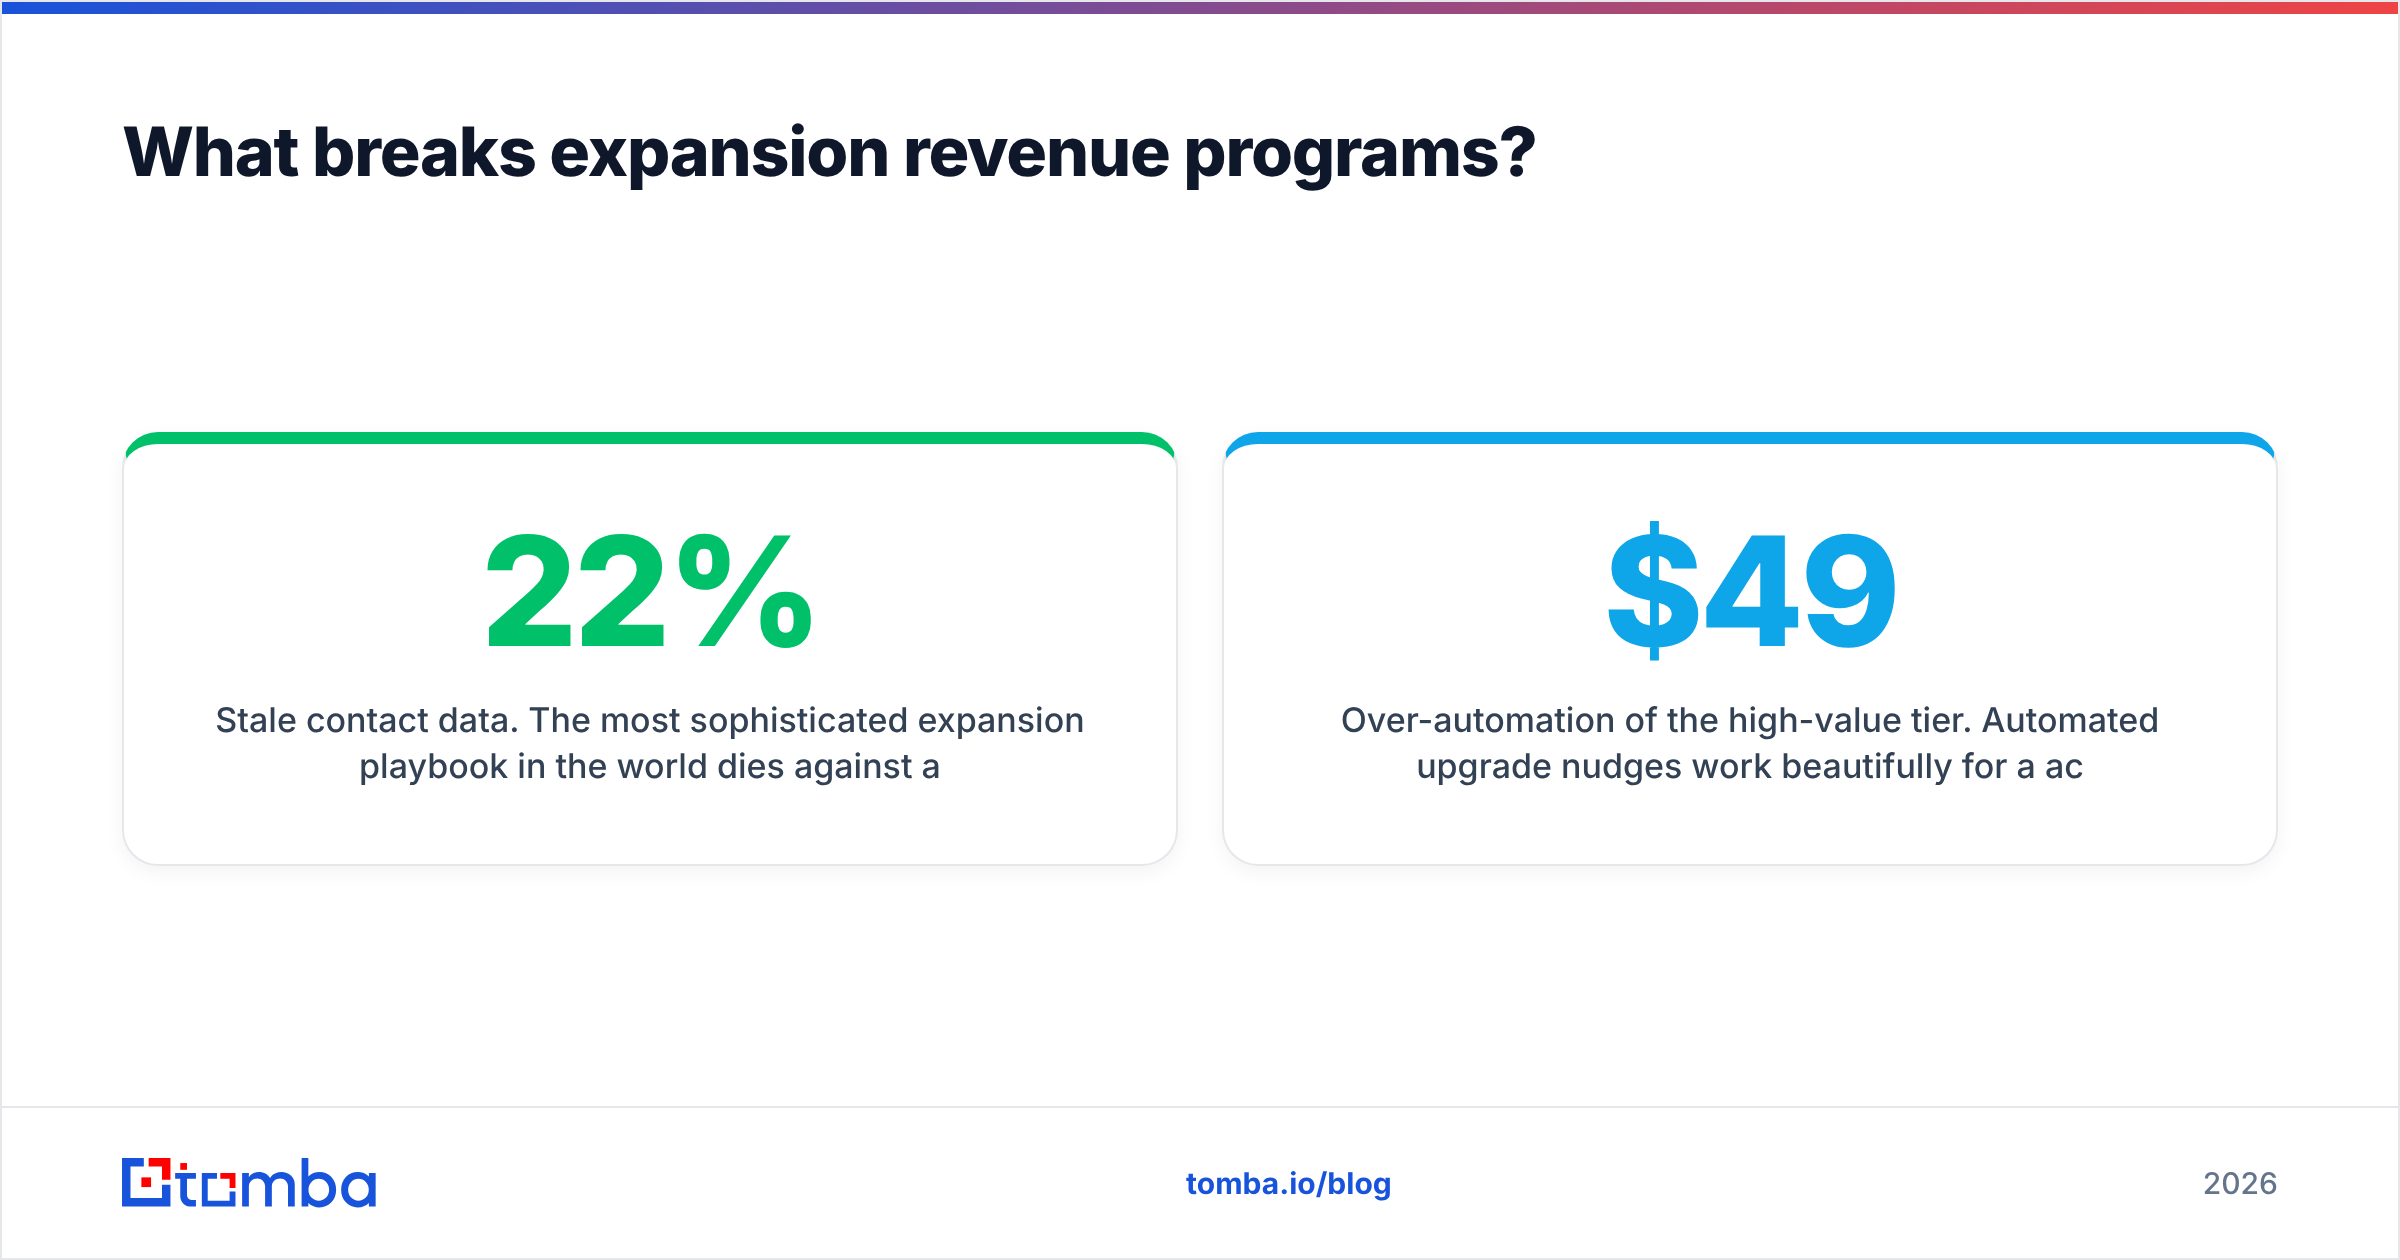
Stale contact data. The most sophisticated expansion playbook in the world dies against a 22% bounce rate, and the bounces damage your sending domain for the rest of the base too. Verify first, send second.
Over-automation of the high-value tier. Automated upgrade nudges work beautifully for a $49/mo account and read as insulting to a $250K enterprise customer. Segment the motion by ARR band. Product-led for the tail, human-led for the head.
One more that's worth naming: measuring expansion only at the company level. If you can't say which segment, which product, and which motion produced the expansion dollars, you can't repeat it next quarter. Software review data on G2 and Capterra is full of vendors whose expansion story worked exactly once (g2.com).
How do you build an expansion pipeline in 90 days?#
Days 1–30: instrument. Get product usage, plan limits, and renewal dates into one view. Define expansion, contraction, and churn in writing so finance and sales agree. Baseline NRR and GRR by segment.
Days 31–60: map and clean. Build account maps for your top 100 accounts by ARR. Verify every contact. Enrich titles and departments. Identify, for each account, the one person who would sign for the next module. This is the step teams skip and the step that determines whether the other 89 days matter.
Days 61–90: run two plays and only two. One product-led play triggered on limit proximity for the tail. One human-led play triggered on org change or adoption breadth for the head. Measure conversion, cycle length, and average expansion deal size. Kill whichever underperforms and double the other in the next quarter.
Keep the plays narrow. Teams that launch six expansion motions simultaneously learn nothing from any of them.
Where does contact data fit into all of this?#
Expansion revenue is a data problem wearing a sales problem's clothes. You already have the relationship. What you're missing is the name and verified email of the person in the next department, the new VP who replaced your champion, and the manager whose team just tripled its usage.
That's the gap Tomba Email Finder closes. Point it at a customer's domain, get the current professional contacts by department and seniority, verify them before you send, and push the enriched records straight into your CRM through the Tomba API or a native integration. The free tier covers 25 searches a month if you want to test the motion on ten accounts before committing, and paid plans start at $49/mo on Tomba pricing when you're ready to map the whole base.
Start with your top 50 accounts. Find the second buyer in each one. That list — not a new outbound sequence — is where next quarter's expansion revenue is hiding.
Related guides#
Ready to find emails that actually work?
Join 150,000+ professionals who stopped guessing and started sending. Free credits on signup — no credit card required.
Get the Tomba newsletter
Practical outbound tactics and product updates — once every two weeks.
About the author