Factors Affecting Sales Performance: The 2026 Field Guide
Quota attainment is falling while headcount grows. Here are the factors that actually move sales performance in 2026 — ranked by measured impact, with the diagnostic order to fix them in.
TL;DR
- The biggest factors affecting sales performance are not motivation or talent. They are data quality, territory design, pipeline hygiene, ramp time, and manager coaching cadence — in roughly that order of leverage per dollar spent.
- Bad contact data is the cheapest problem to fix and the most expensive to ignore. A rep working a 68% deliverable list loses about one full selling day per week to bounces, wrong numbers, and dead ends.
- Headcount is the most common first response and the worst one. Adding reps to a broken funnel multiplies the breakage; it does not dilute it.
- Diagnose in this order: data → targeting → activity quality → conversion → ramp → comp. Fixing comp when the problem is data burns two quarters.
- Every factor below has a measurable proxy. If you cannot instrument it, you cannot claim you improved it.
Why Do Most Sales Performance Diagnoses Start in the Wrong Place?#
Because the visible symptom is almost never the cause.
A VP sees quota attainment drop from 61% to 44%. The board asks what happened. The fastest-sounding answer is "we need better reps" or "the comp plan is misaligned," so the org runs a hiring sprint and a comp redesign. Two quarters later, attainment is 46%.
Think of it like a leaking building. Water shows up on the third floor, so you patch the third-floor ceiling. But the crack is on the roof. Every quarter you patch a different floor and the water keeps coming.
Sales performance works the same way. The visible layer is closed revenue. The layer underneath is conversion rates. Under that is activity quality. Under that is who you targeted. And at the bottom — the roof — is whether the contact data you targeted them with was real.
Most teams start at the top and work down. The productive order is the reverse.
What Are the Actual Factors Affecting Sales Performance?#
There are seven that show up consistently across B2B orgs, and they are not equally weighted. Here they are with the metric that exposes each one:
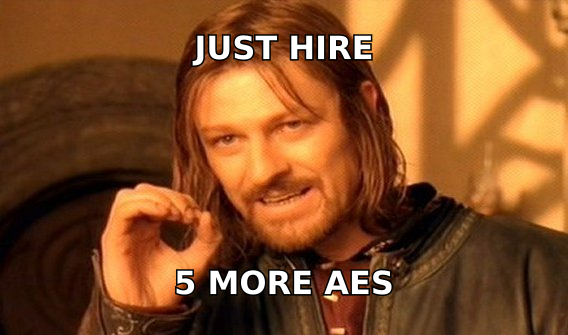
- Contact data accuracy — measured by hard bounce rate and connect rate. Below 95% deliverability, everything downstream is noise. This is the highest-leverage, lowest-cost factor and almost nobody audits it monthly.
- Territory and account fit — measured by win rate variance across reps. If your top rep and your median rep have similar activity volume but a 3x win-rate gap, you have a territory problem masquerading as a talent problem.
- Pipeline hygiene — measured by percentage of open deals with no activity in 21 days. Stale pipeline inflates forecasts and hides the real coverage ratio.
- Ramp time — measured in days to first closed-won and days to 70% of quota. Every 30 days you shave off ramp is roughly a quarter of extra productive capacity per new hire per year.
- Manager coaching cadence — measured by documented 1:1s per rep per month and call reviews per rep per month. This is the single strongest predictor of median-rep improvement, not top-rep improvement.
- Sales process adherence — measured by percentage of deals with a completed qualification framework. Not because the framework is magic, but because adherence correlates with deal inspection.
- Compensation design — measured by the ratio of at-plan earnings across the rep distribution. Real, but it is a multiplier on the six above, not a substitute for them.
Notice the ordering logic: factors 1–3 are systemic and fixable in weeks. Factors 4–6 are organizational and take a quarter or two. Factor 7 is political and takes a fiscal year. Most orgs attack them in exactly the reverse order.
How Much Does Bad Contact Data Actually Cost?#
More than the tooling budget you are protecting by not fixing it.
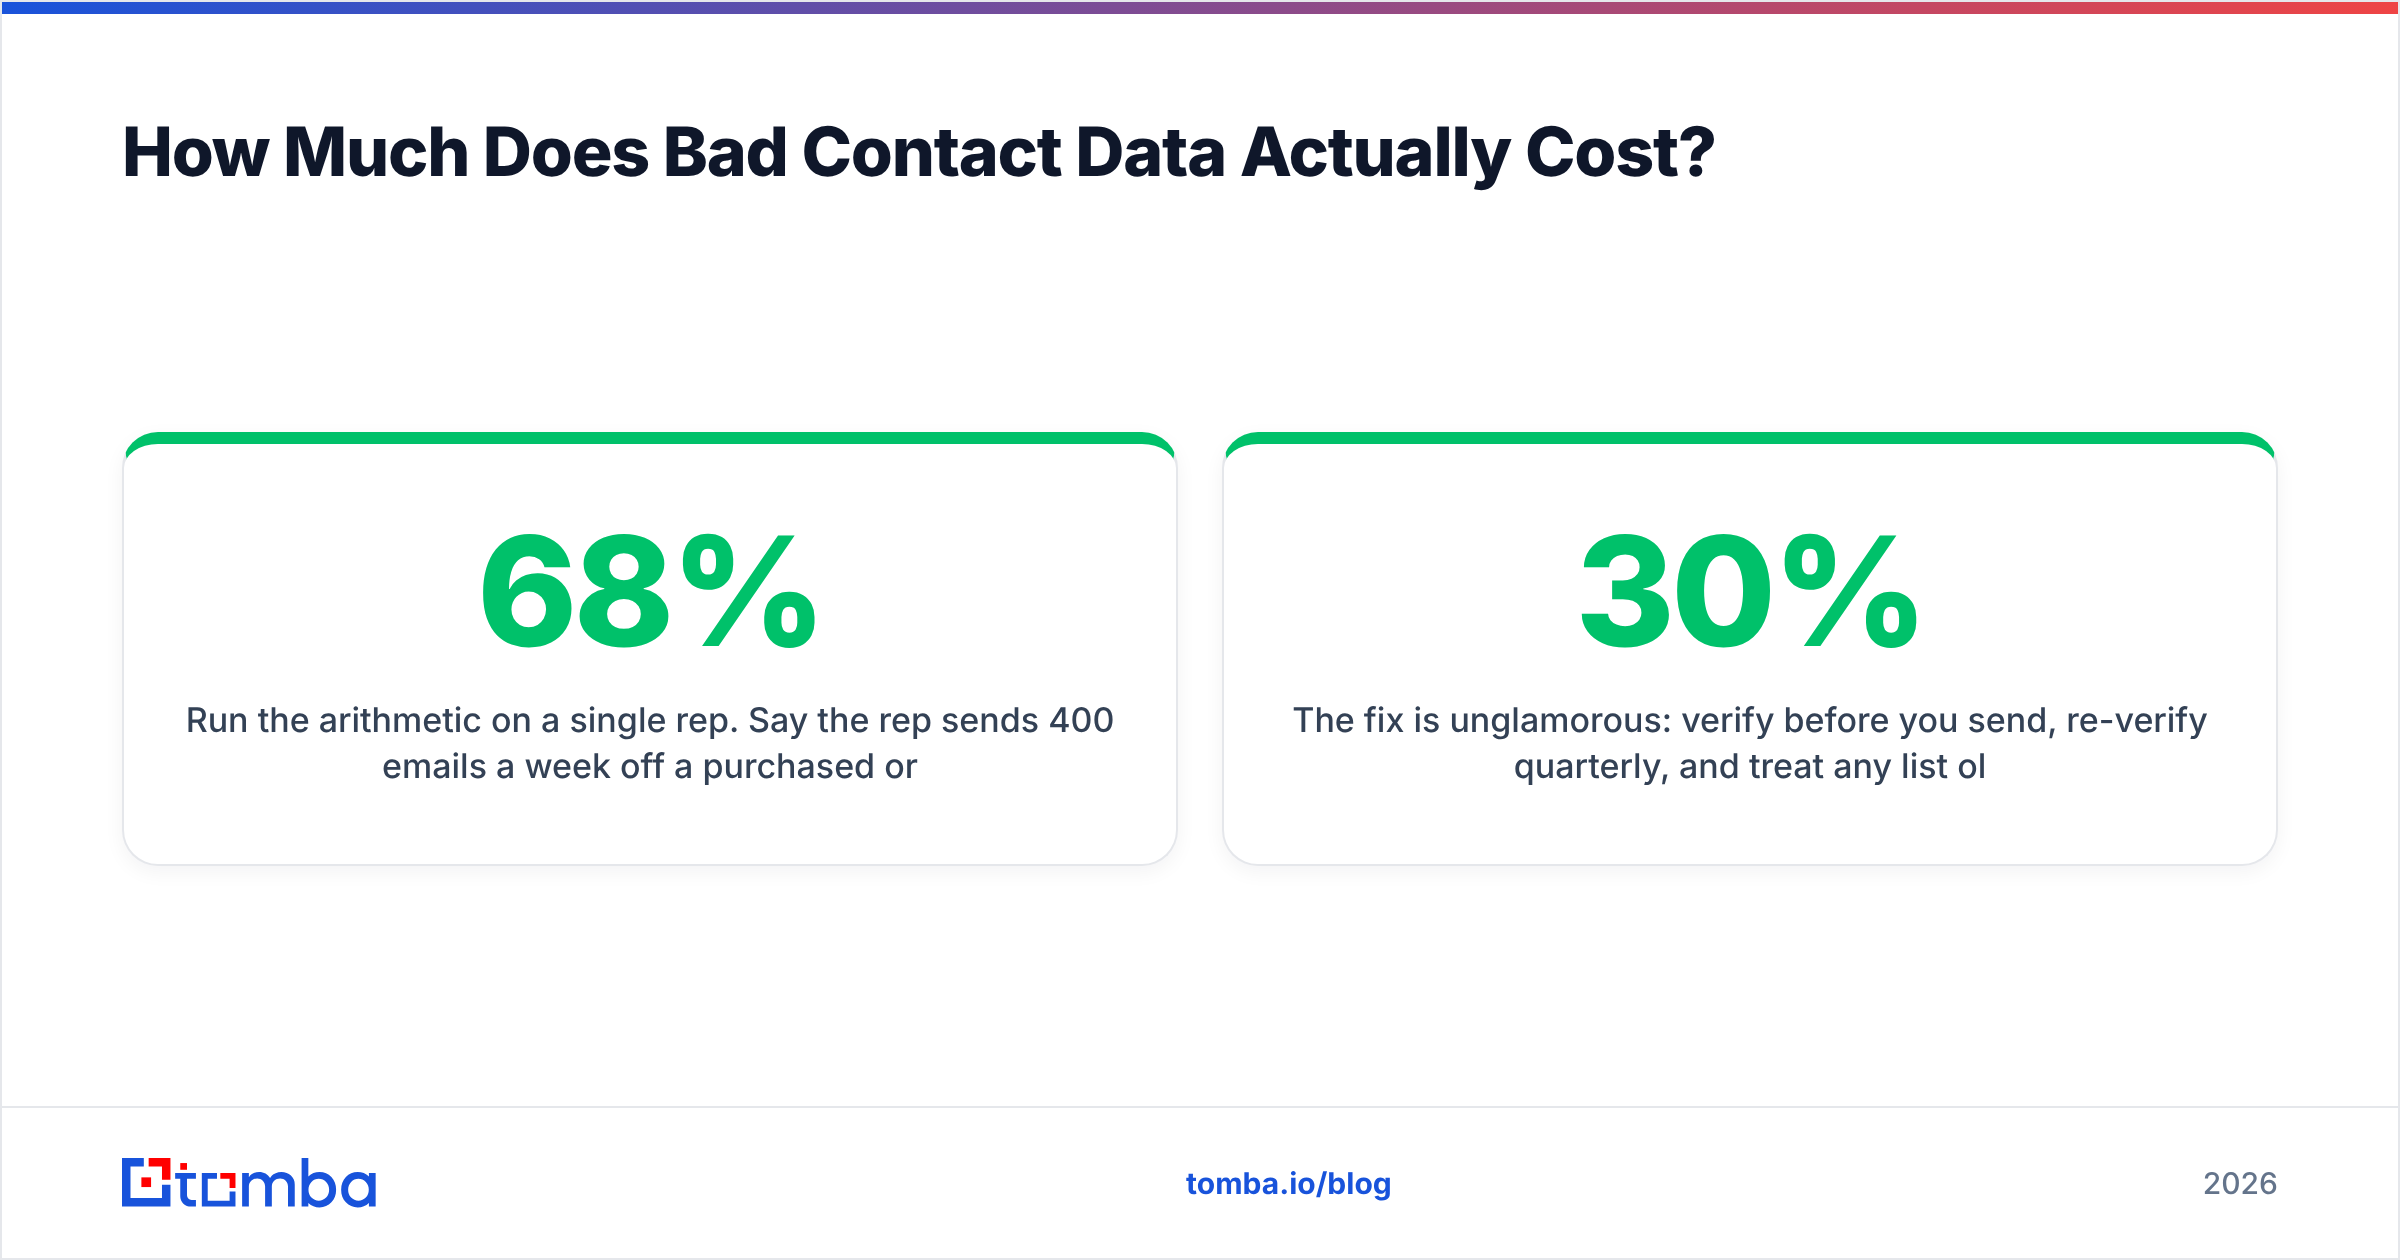
Run the arithmetic on a single rep. Say the rep sends 400 emails a week off a purchased or scraped list with 68% deliverability. That is 128 emails that never land. At a 4% reply rate on delivered mail, those 128 represent about 5 lost conversations a week — 260 a year. If your team converts conversations to closed-won at 6% and your ACV is $18,000, that is roughly $280,000 in annualized pipeline value evaporated per rep, before you count the sender reputation damage that suppresses the other 272 emails.
The reputation compounding is the part people miss. Mailbox providers score you on bounce rate. Cross a threshold and your delivered mail starts landing in spam, which drags the reply rate on your good contacts down too. So a data problem quietly becomes a email deliverability problem, which gets diagnosed as a copywriting problem, which gets fixed with a new subject line template. Nothing improves.
The fix is unglamorous: verify before you send, re-verify quarterly, and treat any list older than 90 days as suspect. B2B contact data decays at roughly 22–30% annually because people change jobs. A list you bought in January is materially different in October whether you touched it or not.
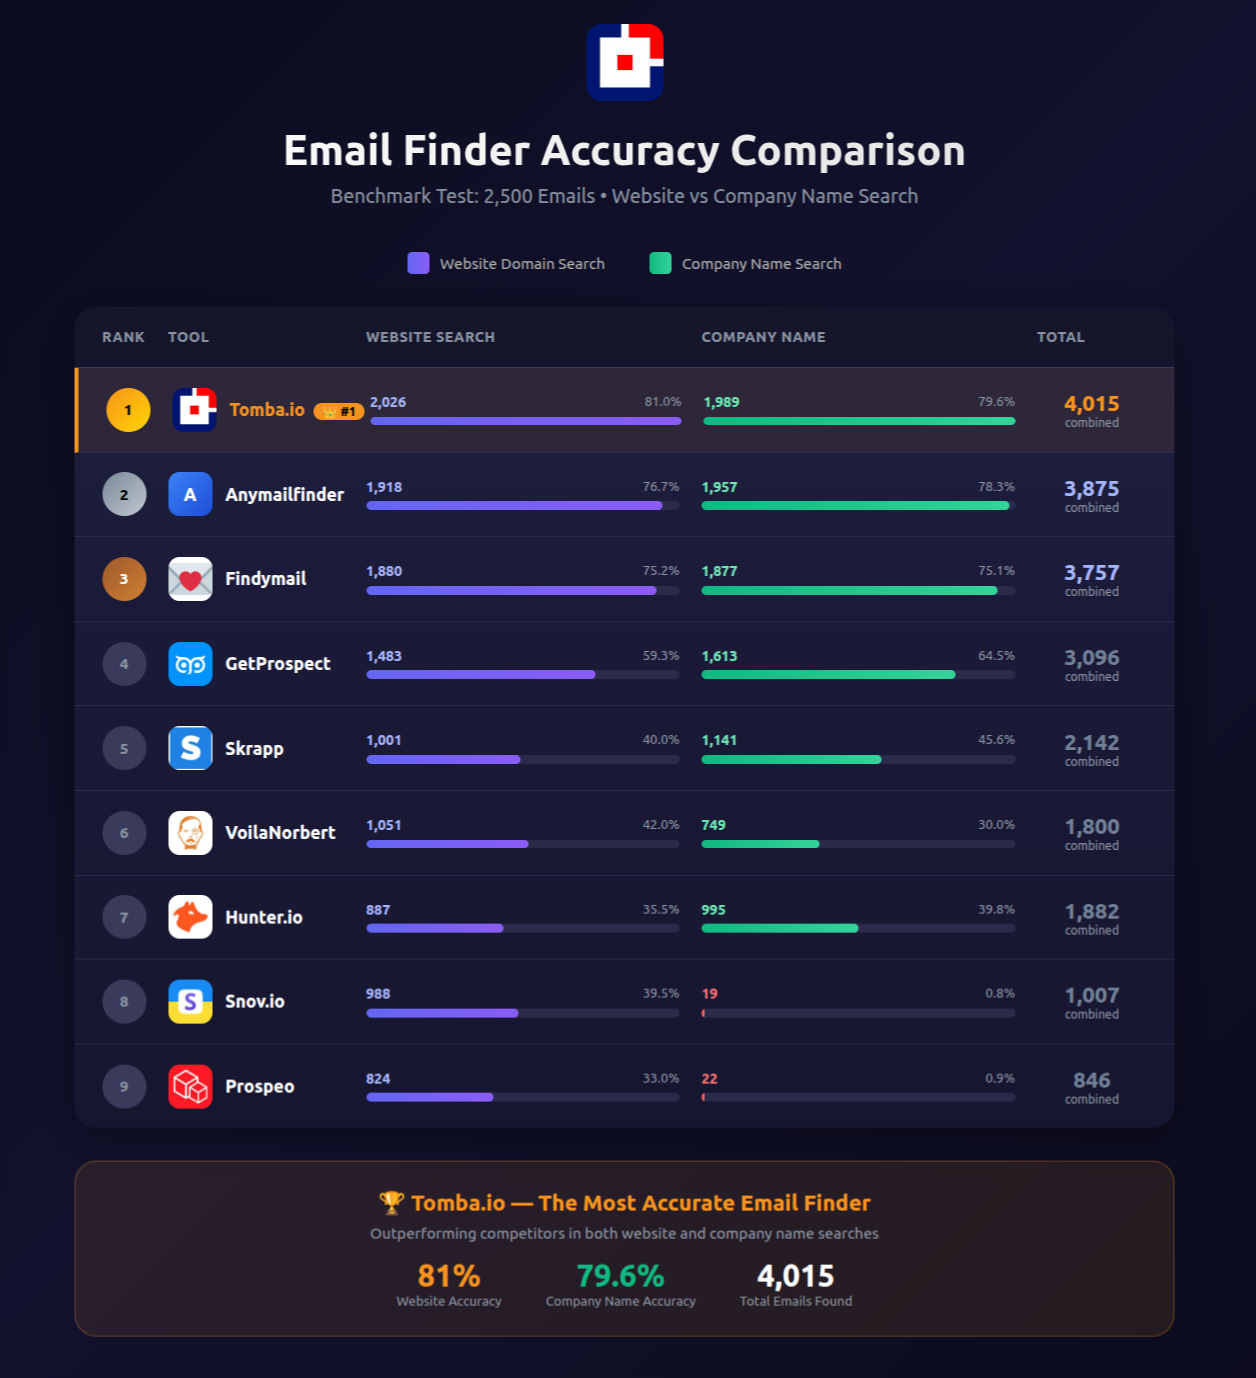
If you are running lists at scale, an email verifier in the pipeline before the sequencer is a five-minute integration that removes an entire class of downstream diagnosis. For domains that accept everything, a catch-all verifier is the difference between "unknown" and "usable."
Which Factors Are Controllable vs. Environmental?#
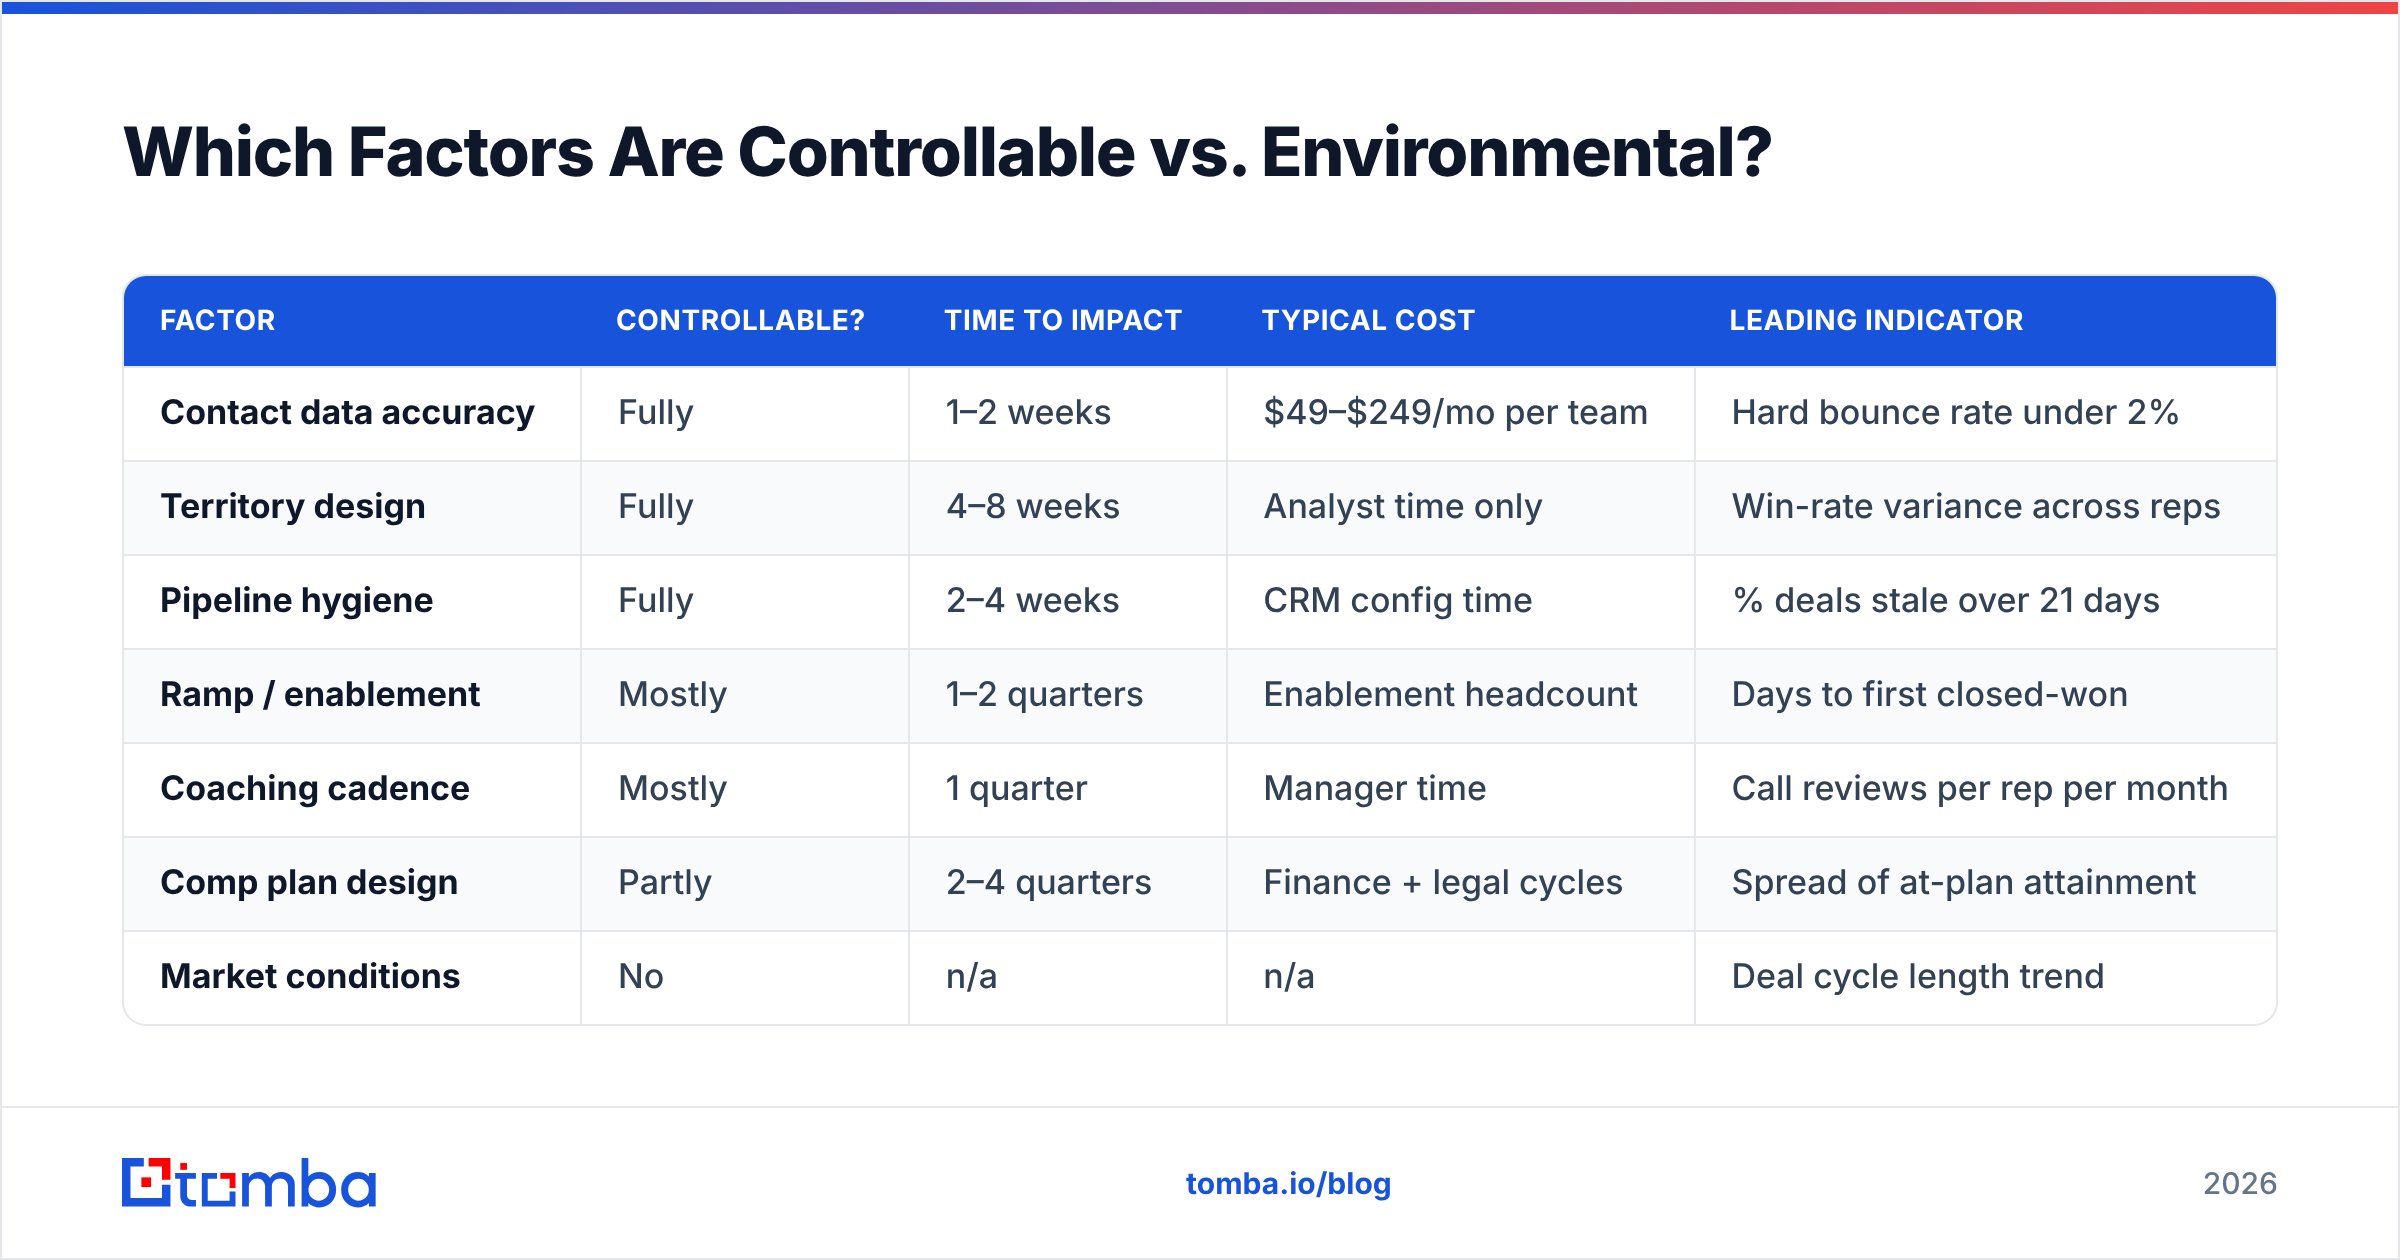
Split them honestly, because you cannot fix what you do not own.
| Factor | Controllable? | Time to impact | Typical cost | Leading indicator |
|---|---|---|---|---|
| Contact data accuracy | Fully | 1–2 weeks | $49–$249/mo per team | Hard bounce rate under 2% |
| Territory design | Fully | 4–8 weeks | Analyst time only | Win-rate variance across reps |
| Pipeline hygiene | Fully | 2–4 weeks | CRM config time | % deals stale over 21 days |
| Ramp / enablement | Mostly | 1–2 quarters | Enablement headcount | Days to first closed-won |
| Coaching cadence | Mostly | 1 quarter | Manager time | Call reviews per rep per month |
| Comp plan design | Partly | 2–4 quarters | Finance + legal cycles | Spread of at-plan attainment |
| Market conditions | No | n/a | n/a | Deal cycle length trend |
| Buyer committee size | No | n/a | n/a | Contacts per closed deal |
The two uncontrollable rows still matter, but only as context for the targets you set. If your average buying committee has grown from 5 people to 8 — which Gartner's B2B buying research has tracked for years — your multithreading requirement went up and your per-deal contact discovery cost went up with it. That is not a rep-performance problem. That is a target-setting problem, and punishing reps for it destroys the coaching relationship you need for the factors you can fix.
How Do You Diagnose Which Factor Is Actually Broken?#
Work bottom-up through five questions in order. Stop at the first "no."
1. Is the data real? Pull last quarter's outbound. Check hard bounce rate, invalid-number rate, and the percentage of emails that reached a person who had left the company. If bounce rate is above 3% or job-change staleness is above 20%, stop here. Fix this first. Nothing you measure above this layer is trustworthy until you do.
2. Are you targeting the right accounts? Compare closed-won account attributes against your ICP definition. If your best deals cluster in a segment your territories do not prioritize, your reps are being paid to work the wrong list well.
3. Is activity volume sufficient and is the mix right? Not "are reps busy." Are they touching enough distinct qualified accounts with enough channels per account? A rep sending 500 emails to 500 accounts is doing worse work than one sending 500 touches across 120 accounts on three channels.
4. Where does conversion break? Map stage-to-stage conversion and compare against your own trailing four quarters, not against a blog benchmark. The interesting number is the stage where your rate moved most, not the stage with the lowest absolute rate.
5. Is it a ramp or a tenure problem? Segment attainment by rep tenure. If reps at 12+ months hit quota and reps under 9 months do not, you have an enablement problem, not a performance problem, and firing the under-9-month cohort resets your clock.
This sequence takes about a week with CRM access. It is faster than a comp redesign and it tells you whether the comp redesign was ever the answer.
Which Metrics Should You Instrument for Each Factor?#
Every factor above needs a number attached or the conversation degrades into opinion within two weeks. Here is the minimum instrumentation set:
- Data health: hard bounce rate, catch-all percentage of list, connect rate on dials, contact records with no activity in 180 days.
- Targeting: win rate by segment, ACV by segment, sales cycle length by segment, percentage of pipeline inside declared ICP.
- Activity quality: distinct accounts touched per rep per week, touches per account, multithread depth (contacts engaged per open opportunity).
- Conversion: stage-to-stage rates, response rate on first touch, meeting-held rate vs. meeting-booked rate.
- Ramp: days to first meeting, days to first closed-won, percentage of quota at day 90 / 180 / 270.
- Coaching: documented call reviews per rep per month, 1:1 completion rate, percentage of deals inspected before forecast submission.
The meeting-held vs. meeting-booked gap deserves special mention. A 40% no-show rate on booked meetings is a data and qualification signal, not a calendaring problem, and it is invisible if you only report bookings.
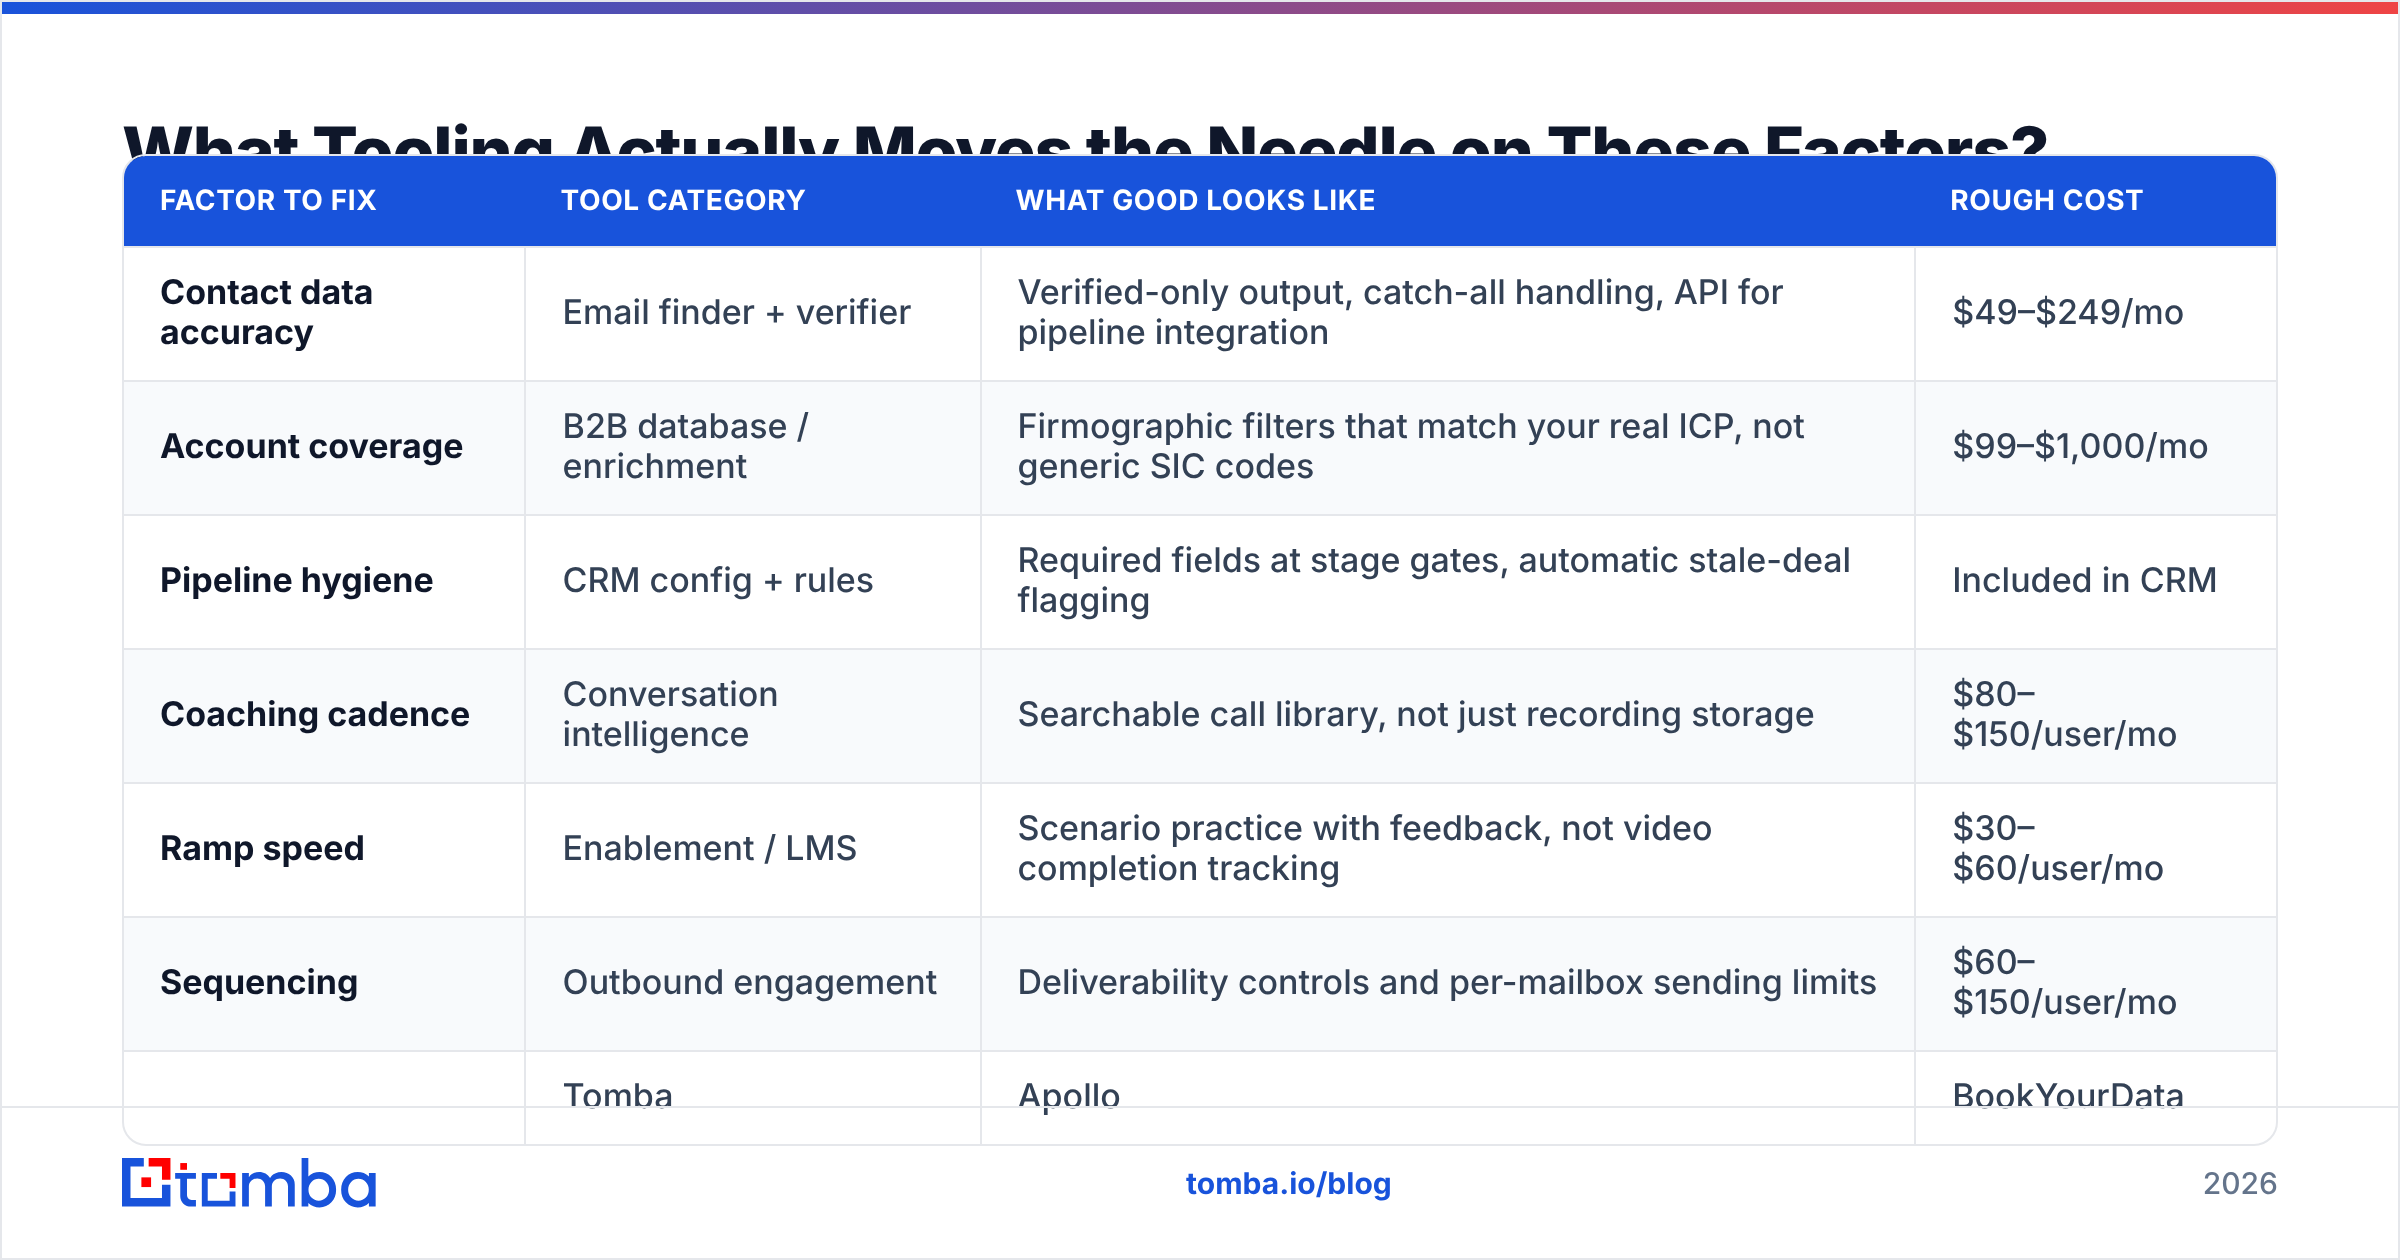
What Tooling Actually Moves the Needle on These Factors?#
The tooling map is narrower than the market makes it look. Different factors need different categories, and buying a platform that claims all of them usually means buying one good module and five mediocre ones.
| Factor to fix | Tool category | What good looks like | Rough cost |
|---|---|---|---|
| Contact data accuracy | Email finder + verifier | Verified-only output, catch-all handling, API for pipeline integration | $49–$249/mo |
| Account coverage | B2B database / enrichment | Firmographic filters that match your real ICP, not generic SIC codes | $99–$1,000/mo |
| Pipeline hygiene | CRM config + rules | Required fields at stage gates, automatic stale-deal flagging | Included in CRM |
| Coaching cadence | Conversation intelligence | Searchable call library, not just recording storage | $80–$150/user/mo |
| Ramp speed | Enablement / LMS | Scenario practice with feedback, not video completion tracking | $30–$60/user/mo |
| Sequencing | Outbound engagement | Deliverability controls and per-mailbox sending limits | $60–$150/user/mo |
On the data layer specifically, the honest comparison across the main options looks like this:
| Tomba | Apollo | BookYourData | |
|---|---|---|---|
| Free tier | 25 searches/mo | Limited credits | Sample list |
| Entry paid plan | $49/mo | ~$49/user/mo | Pay-as-you-go packs |
| Primary strength | Verified email discovery + verification in one API | All-in-one prospecting and sequencing | Pre-built, human-verified list purchase |
| Verification included | Yes, native | Yes | Yes, pre-verified at delivery |
| Best fit | Teams building their own lists and pipelines | Teams wanting database plus outreach in one seat | Teams that want a ready list without building one |
| API access | Yes, all paid plans | Yes | Export-based |
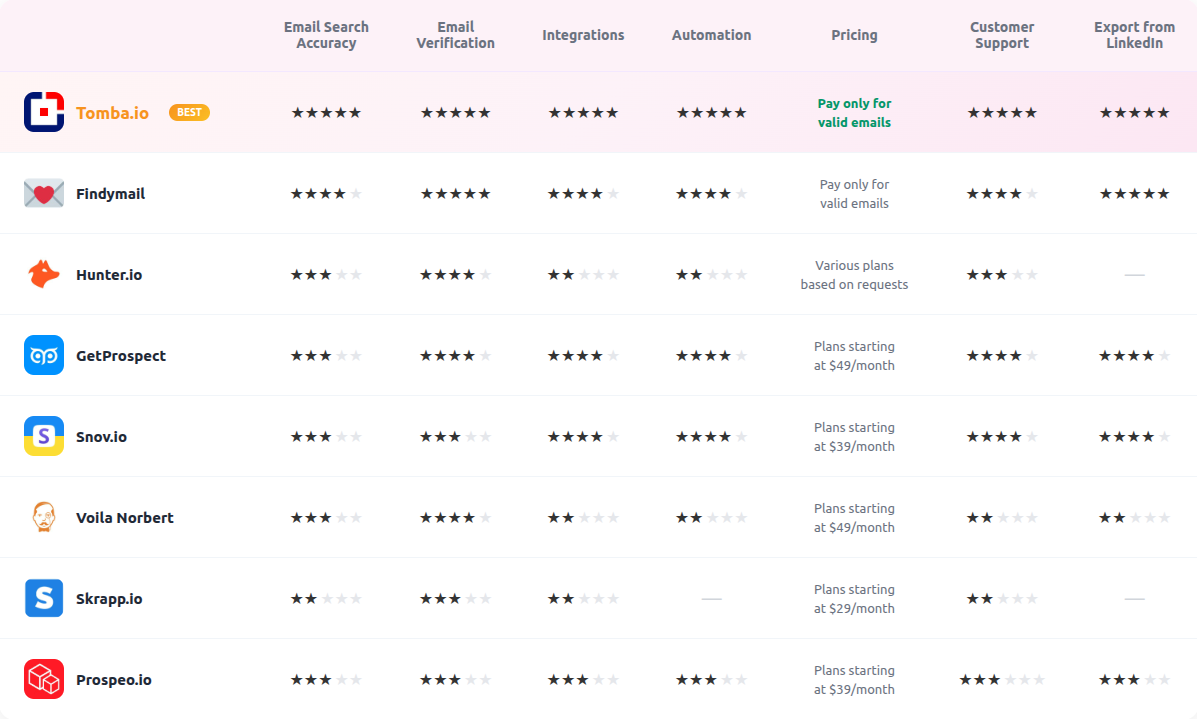
These are genuinely different purchases. BookYourData suits a team that wants a curated list delivered and does not want to run discovery infrastructure — a legitimate and often faster path for a first campaign. Apollo suits a team consolidating database and sequencing into one seat. Tomba suits a team that wants discovery and verification as an API layer feeding its own stack, with Tomba pricing starting at $49/mo and a free tier for testing accuracy before committing. Compare accuracy on your own domains before you compare price lists — vendor-published match rates are measured on vendor-chosen samples, and reviews on G2 are more useful for support quality than for data accuracy.
How Do Manager Behaviors Change Sales Performance?#
Coaching cadence moves the middle of the distribution, and the middle is where your revenue is.
Top reps improve with autonomy. Bottom reps usually have a fit or ramp problem that coaching will not solve fast. But the 60% in the middle respond directly to structured inspection. The mechanism is not motivation — it is that inspected deals get qualified properly, and properly qualified deals convert.
Three manager behaviors with measurable effect:
- Deal inspection before forecast submission. Forces the rep to articulate the next step and the buying process. Deals that cannot survive this question were never real.
- Call review with a specific rubric. Two calls per rep per month, scored on the same four dimensions every time. Consistency beats volume here; five unstructured reviews teach less than two structured ones.
- Territory rebalancing on a fixed schedule. Quarterly, not annually, and based on measured account potential rather than tenure or seniority.
HubSpot's sales research has consistently found that coaching frequency correlates with attainment more strongly than most enablement content investments — which tracks with what the middle-of-distribution mechanism would predict.
What Should You Fix First This Quarter?#
Pick the factor with the shortest time-to-impact that you have not measured in 90 days. For almost every team reading this, that is contact data.
It takes a week. Pull your active list, verify it, quantify the decay, and re-baseline your outbound metrics against the clean list. You will usually discover one of two things: either your reply rates were fine and the list was killing them, or the list was fine and you have a genuine messaging or targeting problem. Either answer is worth a week, because it eliminates a whole branch of the diagnostic tree.
Then move up the stack. Targeting, then activity quality, then conversion, then ramp. Leave comp for last — not because it does not matter, but because a comp plan built on top of broken data optimizes reps toward the wrong behavior with more precision.
The teams that improve sales performance consistently are not the ones with the best reps. They are the ones who know, at any moment, which of the seven factors is currently the binding constraint, and who resist the urge to fix the visible symptom instead of the actual leak.
Start at the data layer. If your outbound is running on a list you have not verified this quarter, that is your binding constraint, and it is the cheapest one you will ever fix. The Tomba Email Finder gives you verified professional email addresses by domain, name, or company, with 25 free searches a month to benchmark accuracy against your current source before you pay for anything. Run both lists side by side for a week and let the bounce rate settle the argument.
Related guides#
Ready to find emails that actually work?
Join 150,000+ professionals who stopped guessing and started sending. Free credits on signup — no credit card required.
Get the Tomba newsletter
Practical outbound tactics and product updates — once every two weeks.
About the author