Fintech Customer Acquisition Cost: The 2026 Benchmark Guide
Most fintech teams calculate CAC wrong, then optimize the wrong lever. Here are real 2026 benchmarks by segment, the payback math investors actually check, and the four costs teams forget to include.
TL;DR
- Fintech customer acquisition cost in 2026 ranges from roughly $8–$40 for consumer neobank signups to $1,200–$8,000+ for B2B payments and lending products sold to mid-market and enterprise buyers.
- Most teams under-report CAC by 30–60% because they exclude sales salaries, compliance/KYC costs, incentives, and data tooling from the numerator.
- The metric investors actually underwrite is CAC payback period (months of gross margin to repay CAC), not CAC alone. Under 12 months is healthy for B2B fintech; under 6 for consumer.
- Blended CAC hides everything. Segment by channel, by product, and by fully-loaded vs. paid-only before you make a single budget decision.
- The cheapest durable lever in B2B fintech isn't ad spend — it's contact data quality. Bad emails inflate CAC silently by wasting reps' most expensive hours.
What is fintech customer acquisition cost, exactly?#
Fintech customer acquisition cost is the total sales and marketing spend required to convert one new paying customer, divided by the number of customers acquired in that period. The formula is trivially simple:
CAC = (Sales spend + Marketing spend) / New customers acquiredThe formula is not the problem. The numerator is.
Think of CAC like the true cost of a road trip. Everyone remembers the gas. Almost nobody counts the tolls, the oil change the trip caused, the hotel because you misjudged the distance, or the speeding ticket. Your dashboard says $60. Your bank account says $340.
In fintech specifically, the "hidden tolls" are unusually large because acquisition is entangled with regulation and risk. A neobank pays for the ad, the signup incentive, the identity verification call, the fraud screen on the funded account, and the support ticket when KYC fails — before the customer generates a cent of interchange. A B2B payments platform pays an SDR to book the meeting, an AE to run six calls, a solutions engineer to scope integration, and a compliance analyst to underwrite the merchant.
If your CAC number only contains ad platform spend, it is not CAC. It's cost per click with extra steps.
What should be inside your CAC numerator?#
Here's the split most fintech finance teams eventually land on after their first serious board conversation.
- Always include — paid media. Search, social, affiliate, retargeting, sponsorships, review-site placements on G2 and Capterra.
- Always include — fully-loaded sales headcount. SDR, AE, and sales-leadership salary, commission, benefits, and payroll tax. This is usually the single largest line in B2B fintech and the most commonly omitted.
- Always include — marketing headcount and contractors. Content, demand gen, design, agency retainers.
- Always include — acquisition-attributable tooling. CRM seats, sequencing platform, intent data, contact data, call recording, attribution.
- Fintech-specific — signup incentives and referral bounties. The $50 "fund your account" bonus is acquisition cost, not a marketing gift.
- Fintech-specific — onboarding compliance cost. KYC/KYB checks, sanctions screening, document review labor, and the fraud losses you eat on accounts that never activate.
What stays out: customer success for existing accounts, product engineering, and brand spend you genuinely cannot tie to a cohort (though most teams hide too much here — be honest).

What are realistic fintech CAC benchmarks in 2026?#
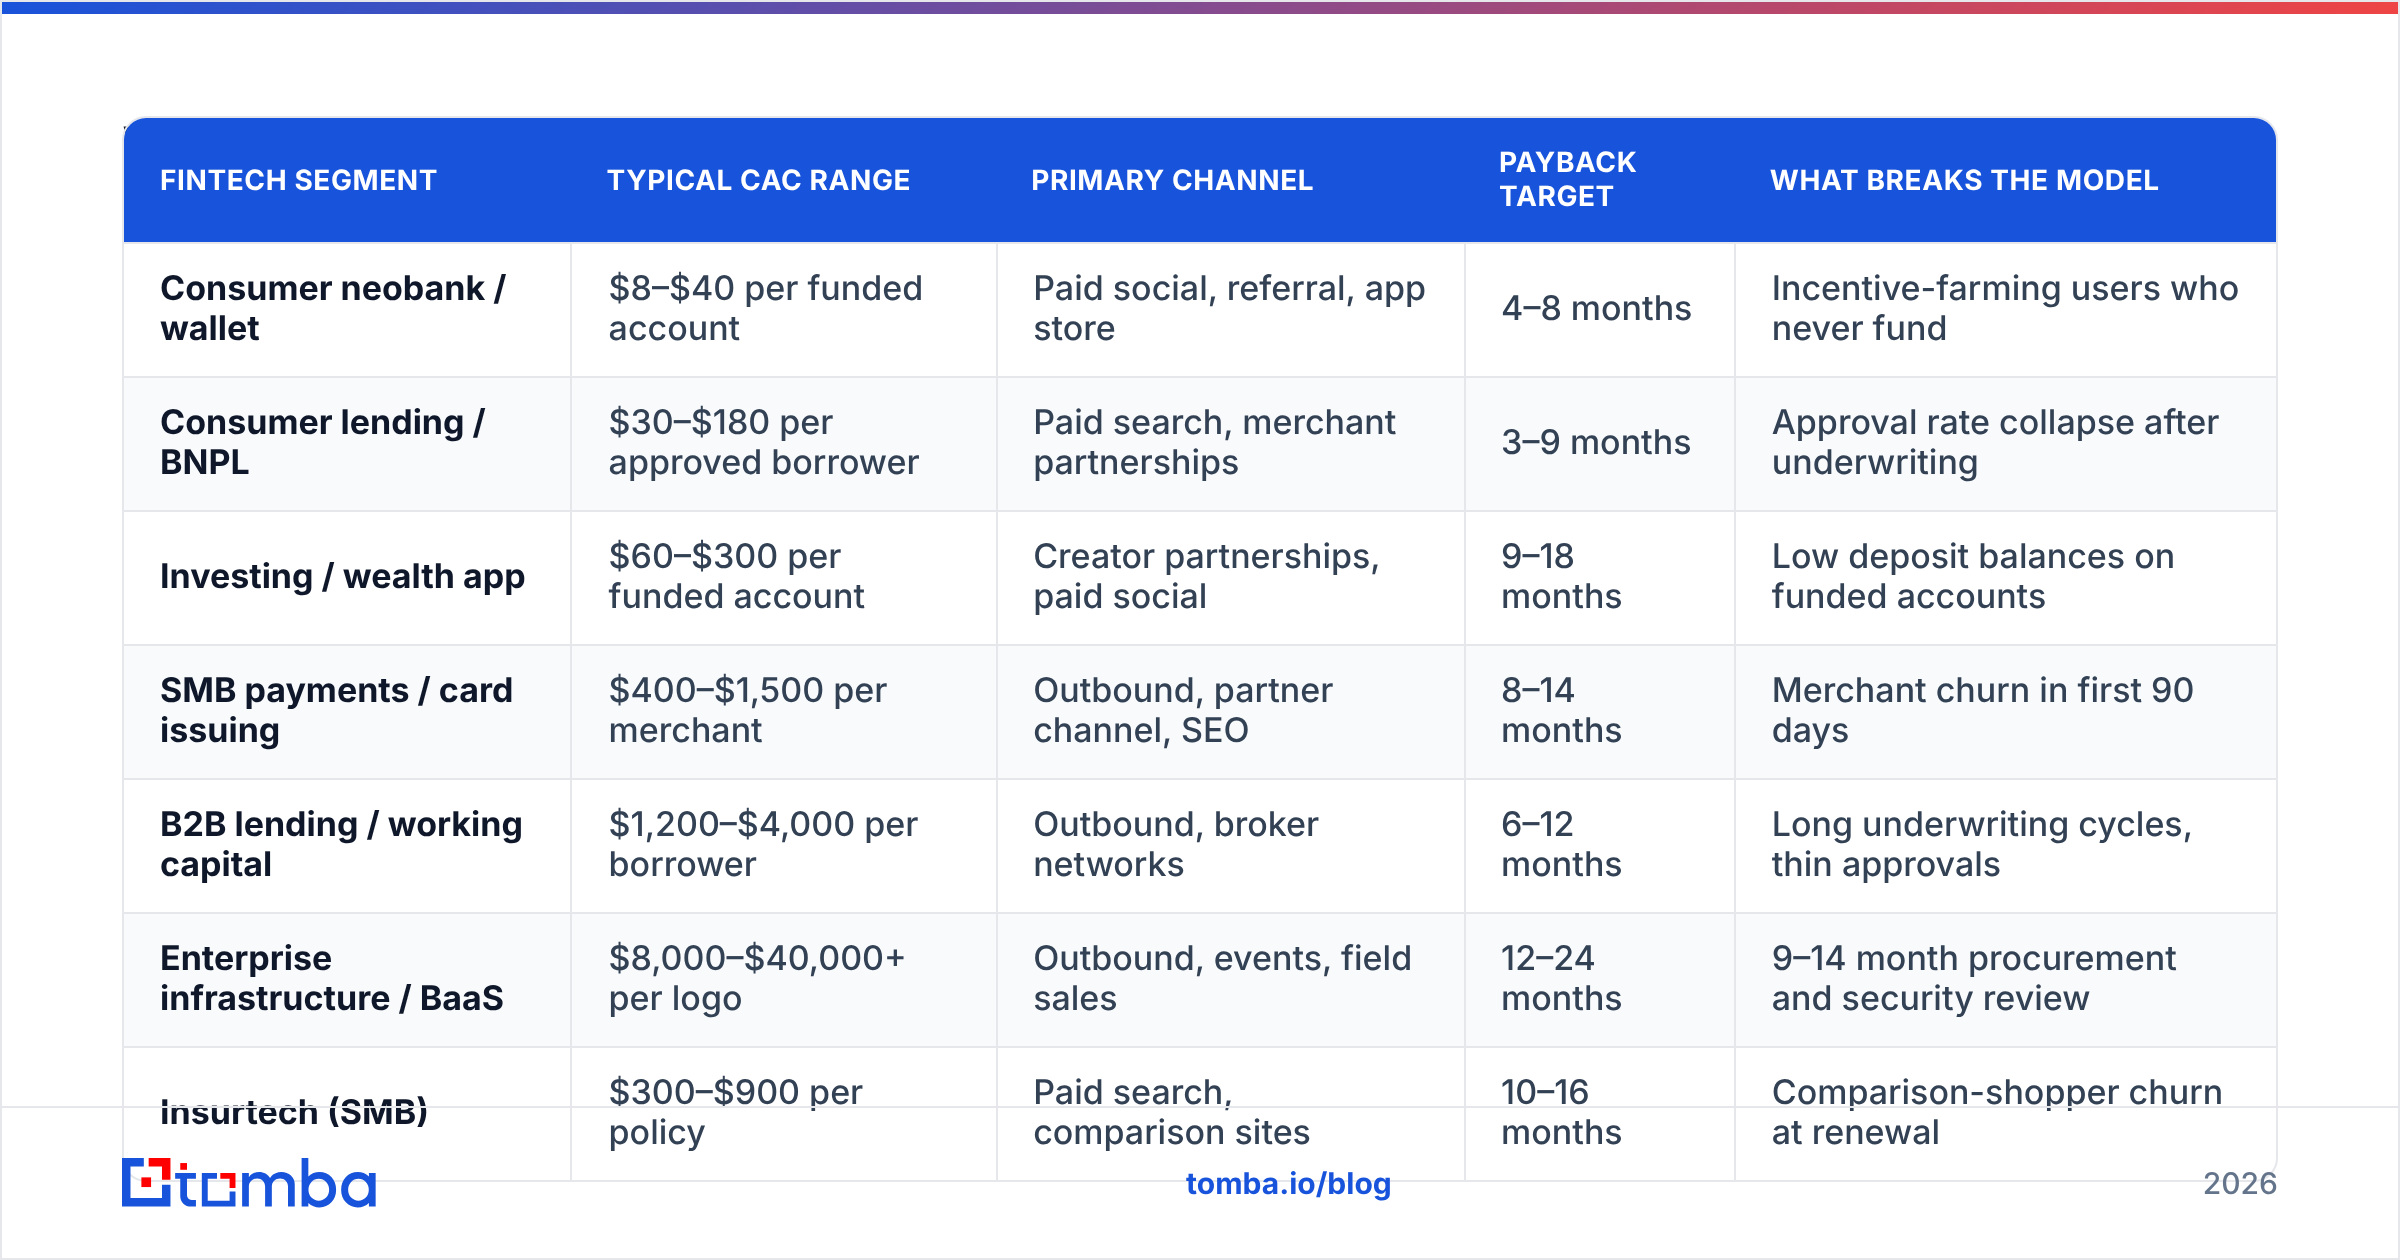
Benchmarks are directional, not gospel — your geography, license type, and product complexity move these numbers a lot. But teams consistently misjudge which order of magnitude they should even be in, so here's the shape of the market.
| Fintech segment | Typical CAC range | Primary channel | Payback target | What breaks the model |
|---|---|---|---|---|
| Consumer neobank / wallet | $8–$40 per funded account | Paid social, referral, app store | 4–8 months | Incentive-farming users who never fund |
| Consumer lending / BNPL | $30–$180 per approved borrower | Paid search, merchant partnerships | 3–9 months | Approval rate collapse after underwriting |
| Investing / wealth app | $60–$300 per funded account | Creator partnerships, paid social | 9–18 months | Low deposit balances on funded accounts |
| SMB payments / card issuing | $400–$1,500 per merchant | Outbound, partner channel, SEO | 8–14 months | Merchant churn in first 90 days |
| B2B lending / working capital | $1,200–$4,000 per borrower | Outbound, broker networks | 6–12 months | Long underwriting cycles, thin approvals |
| Enterprise infrastructure / BaaS | $8,000–$40,000+ per logo | Outbound, events, field sales | 12–24 months | 9–14 month procurement and security review |
| Insurtech (SMB) | $300–$900 per policy | Paid search, comparison sites | 10–16 months | Comparison-shopper churn at renewal |
Two observations from these ranges.
First, consumer fintech CAC looks tiny and is deceptively brutal. A $22 CAC on a neobank signup means nothing if only 31% of signups fund the account and the average funded account generates $3.10/month in net revenue. Your real CAC per revenue-generating customer is $71, and your payback is 23 months on a product where users churn at 5% monthly.
Second, B2B fintech CAC looks scary and is often the healthier business. A $3,200 CAC on a working-capital product with $14,000 in year-one gross profit pays back in under three months. The number is big because the contract is big.
Never compare CAC across segments. Compare CAC-to-payback and CAC-to-LTV within your own segment.
Why is CAC payback period the number that actually matters?#
CAC payback is how many months of gross profit it takes to earn back what you spent acquiring the customer.
CAC payback (months) = CAC / (Monthly revenue per customer × Gross margin)This matters more than CAC or even LTV:CAC ratio for one reason: it's the metric that governs how fast you burn cash. LTV:CAC of 4:1 sounds excellent until you learn the LTV accrues over seven years. You will run out of money in year two proving it.
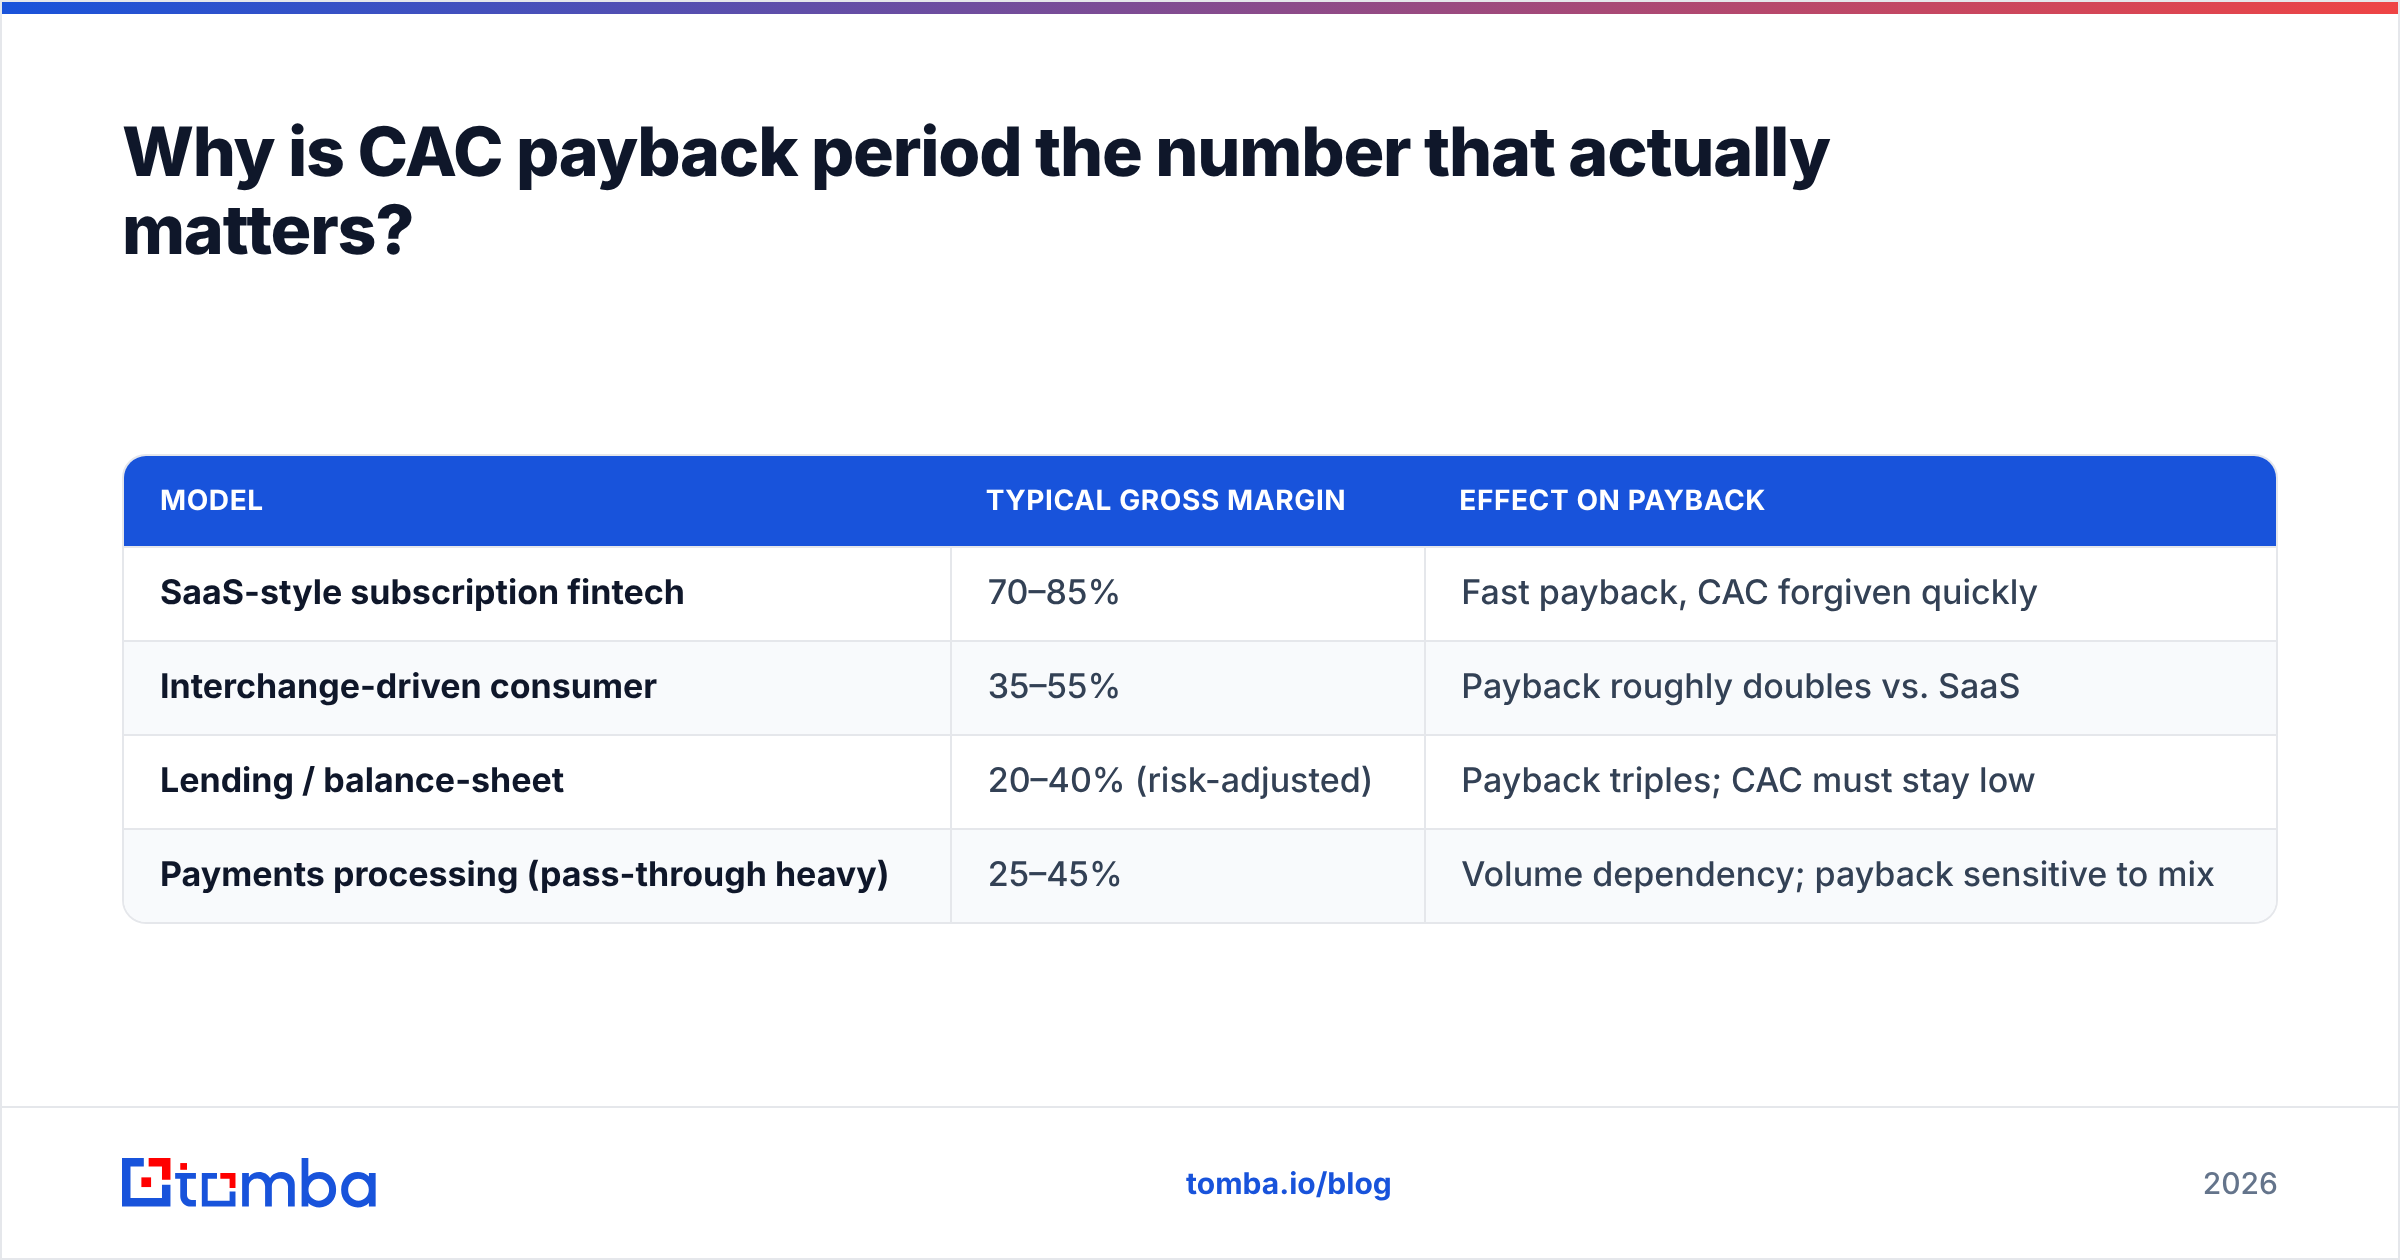
Fintech gross margins vary wildly, which makes payback the great equalizer:
| Model | Typical gross margin | Effect on payback |
|---|---|---|
| SaaS-style subscription fintech | 70–85% | Fast payback, CAC forgiven quickly |
| Interchange-driven consumer | 35–55% | Payback roughly doubles vs. SaaS |
| Lending / balance-sheet | 20–40% (risk-adjusted) | Payback triples; CAC must stay low |
| Payments processing (pass-through heavy) | 25–45% | Volume dependency; payback sensitive to mix |
A $900 CAC in a subscription fintech with 80% margin and $150 MRR pays back in 7.5 months. The same $900 CAC in a lending product with 30% risk-adjusted margin and the same $150 monthly revenue takes 20 months. Same CAC. Completely different company.
Benchmarks worth reading alongside your own: Bessemer's cloud metrics work and vertical reports from Gartner are the ones most fintech CFOs cite when defending a number in a board deck.
What quietly inflates fintech CAC — and what fixes it?#
Four leaks account for most of the gap between "our CAC" and "our real CAC."
Leak 1: Rep hours burned on bad contact data. In B2B fintech, an AE costs $120k–$180k fully loaded. If a rep spends 22% of the week hunting for contact details, correcting bounced addresses, and re-researching accounts that were never reachable, you are paying roughly $30k/year per rep for manual data work. Across a ten-person team that's $300k of pure CAC inflation. This is the leak nobody puts on a slide because it never appears as a line item — it appears as "we need more headcount."
Leak 2: Deliverability decay. A bounce rate above 3% starts degrading domain reputation, which lowers inbox placement, which drops reply rates, which raises the number of contacts needed per meeting, which raises CAC. It compounds quietly. Running lists through an email verifier before send, and checking email deliverability fundamentals like SPF and DMARC alignment, is the cheapest CAC reduction available to most teams.
Leak 3: Incentive arbitrage in consumer fintech. Signup bonuses attract a population that optimizes for bonuses. If you're not measuring CAC per retained, funded, active-at-90-days customer, your reported CAC is fiction. Segment cohorts by acquisition offer and watch the 90-day survival curves diverge.
Leak 4: Unattributed compliance drag. Every failed KYB, every manual document review, every merchant declined after four hours of analyst time — those are acquisition costs for customers you never acquired. Divide them across the customers you did acquire, because that's who paid for them.

How do you lower fintech CAC without shrinking pipeline?#
The instinct is to cut ad spend. That lowers CAC on a spreadsheet and lowers revenue in reality. Better levers, ranked by durability:
- Fix data quality first. Verified contacts, correct titles, current companies. A 15% lift in connect rate lowers CAC more than a 15% cut in ad budget, and it doesn't shrink the funnel. Start by auditing where your contact data comes from and what its real accuracy is — vendors differ by 20+ points on the same list.
- Tighten ICP before tightening budget. Fintech buyers are not homogeneous. A 40-person e-commerce merchant and a 400-person logistics firm buy payments differently, close at different rates, and churn at different rates. Pull the segment with the worst payback out of the funnel entirely.
- Shift outbound targeting from volume to precision. Fewer, better-researched accounts with verified decision-maker contacts beat 10x volume with 40% bounce. Use domain search to map every reachable contact at a target account, then prioritize by role rather than blasting the list.
- Build a compounding organic base. SEO and product-led loops have near-zero marginal CAC after the build cost. This is why fintech companies with strong content and free tools consistently report blended CAC 30–50% below paid-heavy competitors after year two.
- Instrument channel-level CAC monthly, not quarterly. Channels decay. A partner referral source at $600 CAC can drift to $1,900 in a quarter without anyone noticing if you only look at blended numbers.
- Cut the time-to-first-value. In fintech, activation is acquisition. A merchant who integrates in two days costs less to acquire than one who takes three weeks of solutions-engineering support — even if the ad spend was identical.
How should you build a CAC model your CFO will trust?#
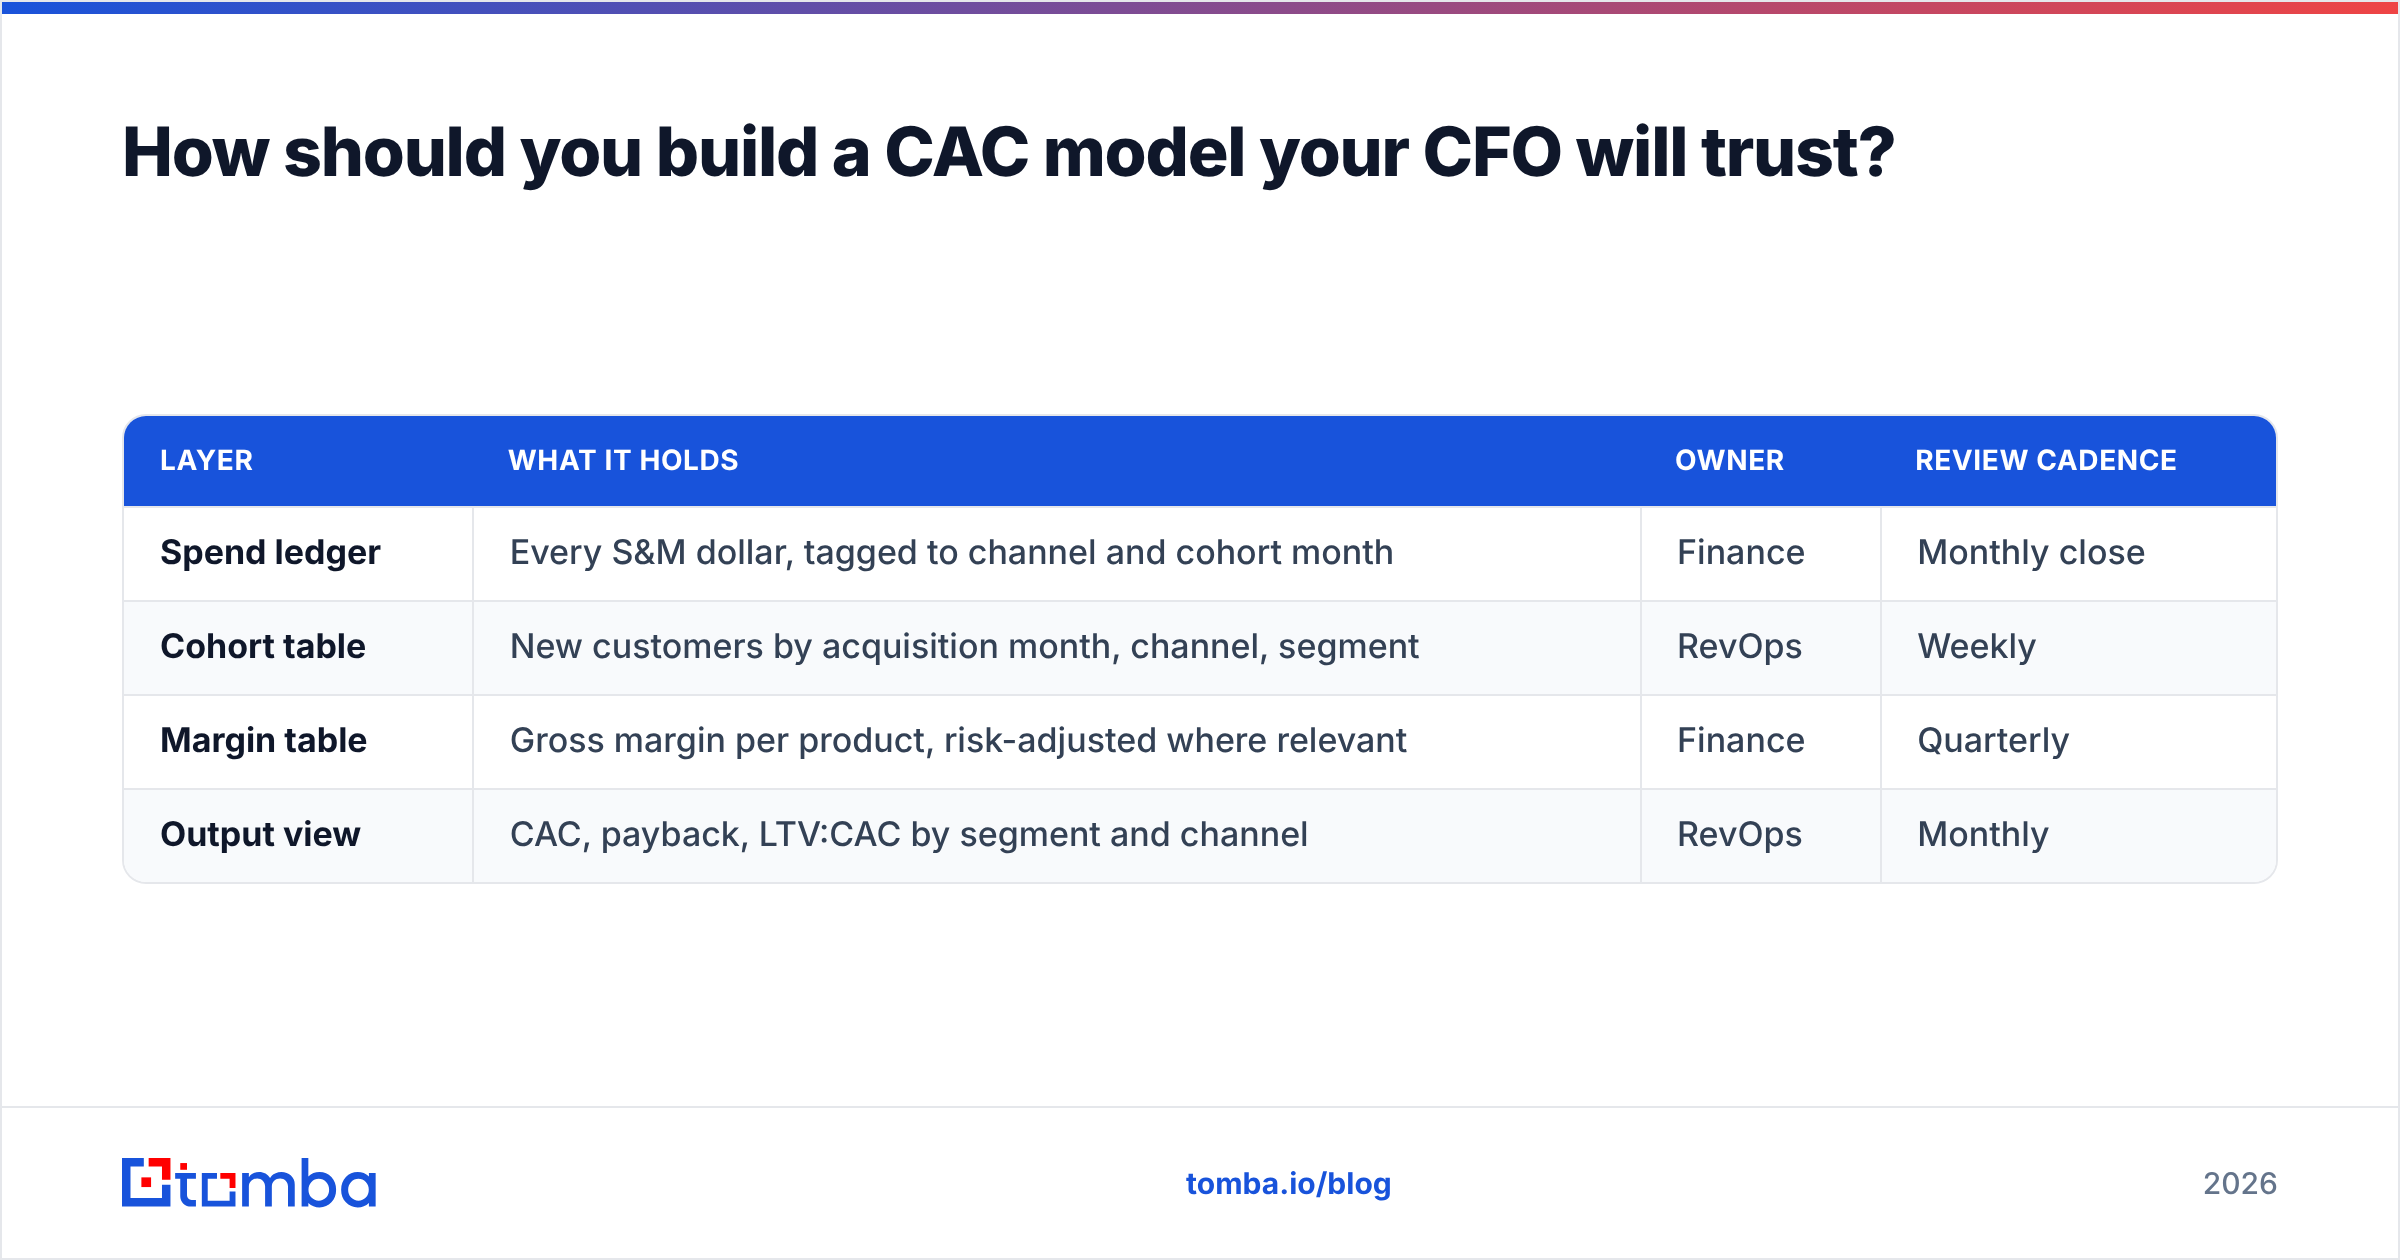
Keep it boring and auditable. A workable model has four layers:
| Layer | What it holds | Owner | Review cadence |
|---|---|---|---|
| Spend ledger | Every S&M dollar, tagged to channel and cohort month | Finance | Monthly close |
| Cohort table | New customers by acquisition month, channel, segment | RevOps | Weekly |
| Margin table | Gross margin per product, risk-adjusted where relevant | Finance | Quarterly |
| Output view | CAC, payback, LTV:CAC by segment and channel | RevOps | Monthly |
Two rules keep it honest. First, cohort your spend to the month it was spent, not the month the customer closed — otherwise long-cycle B2B fintech deals make CAC look artificially cheap in growth quarters. Second, publish both fully-loaded CAC and paid-only CAC side by side. Executives will argue about which is "real." Let them see both rather than picking the flattering one.
Good revenue operations practice here is less about the tooling and more about refusing to let the definition drift between quarters. A CAC number that changes definition is a CAC number nobody can act on.
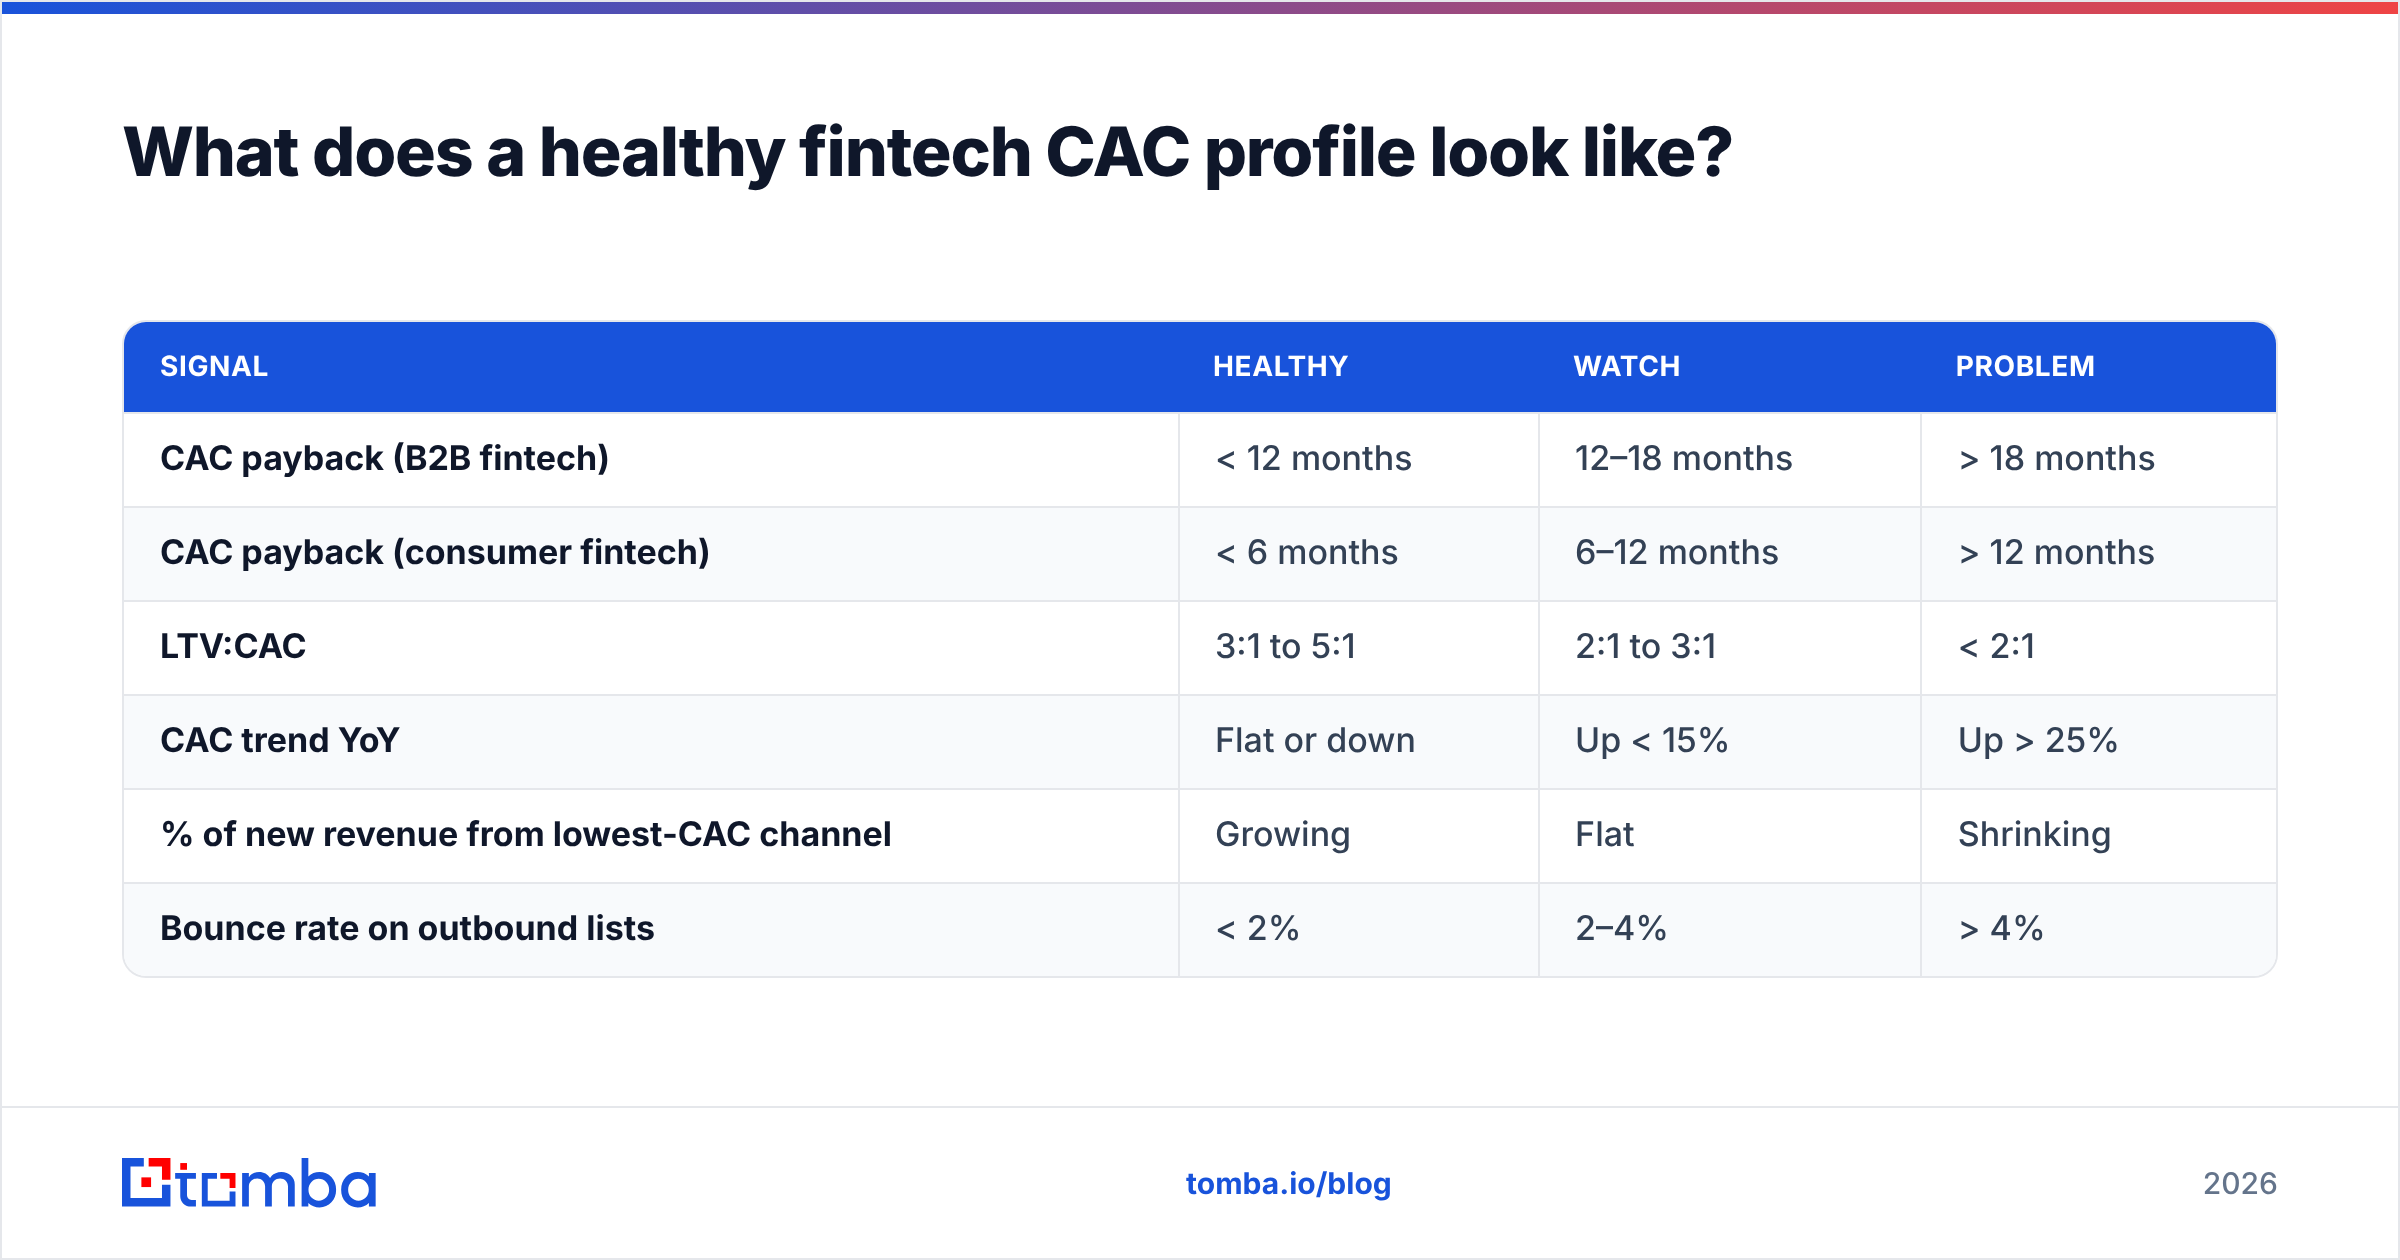
What does a healthy fintech CAC profile look like?#
Use these as pass/fail gates rather than targets to optimize:
| Signal | Healthy | Watch | Problem |
|---|---|---|---|
| CAC payback (B2B fintech) | < 12 months | 12–18 months | > 18 months |
| CAC payback (consumer fintech) | < 6 months | 6–12 months | > 12 months |
| LTV:CAC | 3:1 to 5:1 | 2:1 to 3:1 | < 2:1 |
| CAC trend YoY | Flat or down | Up < 15% | Up > 25% |
| % of new revenue from lowest-CAC channel | Growing | Flat | Shrinking |
| Bounce rate on outbound lists | < 2% | 2–4% | > 4% |
An LTV:CAC above 6:1 is not a victory lap — it usually means you're underinvesting in growth and leaving market share to a competitor who'll spend past you.
Where should you start this quarter?#
Pick one number and make it real. Most fintech teams get more value from a correct fully-loaded CAC for a single segment than from an elaborate model that averages six businesses into one misleading figure. Rebuild the numerator honestly, cohort it properly, then divide.
Then attack the leak that costs the most and shows up the least: contact data. If your reps are spending hours a week finding and correcting email addresses, that time is CAC — it's just wearing a payroll costume.
Tomba's email finder gives outbound and partnership teams verified, deliverable contacts at target accounts so reps spend their hours selling rather than researching. Start on the free tier (25 searches/month) to test accuracy against your current source, then scale on Tomba pricing from $49/mo Starter to $99/mo Growth as your outbound motion grows. Lower bounce, higher connect rate, lower CAC — without touching your ad budget.
Related guides#
Ready to find emails that actually work?
Join 150,000+ professionals who stopped guessing and started sending. Free credits on signup — no credit card required.
Get the Tomba newsletter
Practical outbound tactics and product updates — once every two weeks.
About the author