Firmographic Filters: How to Build B2B Lists That Convert
Most B2B lists fail because the filters were wrong, not the copy. Here is how firmographic filters actually work in 2026, which ones predict revenue, and how to stack them without shrinking your list to nothing.
TL;DR
- Firmographic filters describe the company — industry, headcount, revenue, location, ownership, growth stage. They are the load-bearing layer of every B2B target list.
- Most teams over-filter. Stacking six firmographic filters at once can cut a 40,000-company universe to 200 records, and 150 of them will be stale.
- The filters that actually predict deal size are headcount band, revenue band, and tech/ownership signals. Industry codes (SIC/NAICS) are the weakest predictor and the most commonly mis-tagged.
- Firmographics tell you who to talk to. They do not tell you when. Pair them with technographic and intent layers or you are just mailing a directory.
- Build the list wide with firmographics, then narrow with contact-level verification — not the other way around.
What are firmographic filters?#
Firmographic filters are the company-level attributes you use to slice a B2B database down to accounts worth contacting. Think of them as the demographics of a business: where demographics ask a person's age, income, and location, firmographics ask a company's size, sector, revenue, and geography.
The term dates back to industrial marketing research in the 1980s and has survived because it maps cleanly onto how B2B buying works. A 40-person agency in Lisbon and a 12,000-person insurer in Ohio may both technically "need CRM software," but they buy through completely different motions, at completely different price points, on completely different timelines. Firmographics are how you stop treating them as the same lead.
The standard firmographic set breaks into six categories:
- Industry / vertical — SIC, NAICS, or a vendor's proprietary taxonomy. Answers "what business are they in?"
- Company size — headcount bands (1-10, 11-50, 51-200, 201-1000, 1001+). The single most reliable segmentation axis in B2B.
- Revenue — annual revenue bands. Strong for enterprise targeting, weak and often estimated for private SMBs.
- Location — HQ country, region, metro, plus office footprint. Drives compliance, language, and timezone routing.
- Structure & ownership — public, private, PE-backed, VC-funded, subsidiary, franchise. Predicts budget cycles better than almost anything else.
- Growth stage & trajectory — funding round, headcount growth rate, new office openings. The closest firmographics get to a timing signal.
Get these six right and your list is directionally correct before a single email is written. Get them wrong and no amount of clever subject-line testing rescues the campaign.
Why do most firmographic filters fail?#
Because teams treat filters as a purity test instead of a probability adjustment.
Here is the pattern I see constantly. A rep opens a database, selects "SaaS," then "51-200 employees," then "$10M-$50M revenue," then "United States," then "Series B," then "uses HubSpot." Six filters, each individually reasonable. The result: 173 companies. The rep declares the ICP "too narrow" and blames the tool.
The math is unforgiving. If each filter independently retains 30-50% of the universe, six stacked filters retain roughly 0.1-1.5% of it. And that assumes every filter is accurately populated — which it never is.
Three specific failure modes cause most of the damage:
Coverage collapse on optional fields. Revenue is populated for maybe 30-60% of private companies in a typical B2B database, and much of that is modeled rather than reported. When you filter on revenue, you are not filtering out companies that fail the criterion — you are filtering out every company where the vendor simply had no data. Your "$10M-$50M" segment silently excludes half the qualified market.
Industry taxonomy drift. A company that sells scheduling software to dental practices might be tagged "Software," "Healthcare," "Information Technology," or "Professional Services," depending on which data source won the merge. Filtering on a single industry code routinely drops 40% of the actual vertical. Use industry as a broad sieve, never as a precision instrument.
Stale headcount. Headcount data derived from LinkedIn scrapes lags reality by 3-9 months. A company that laid off 40% of staff last quarter still shows as 201-500. A company that just raised and doubled still shows as 51-200. You filtered on a photograph, not a live feed.
The fix is ordering, not more filters. Start with the two or three attributes you actually trust, build a wide list, then qualify down at the contact level with a email verifier pass and manual spot-checks. Precision belongs at the end of the funnel, not the beginning.
Which firmographic filters actually predict revenue?#
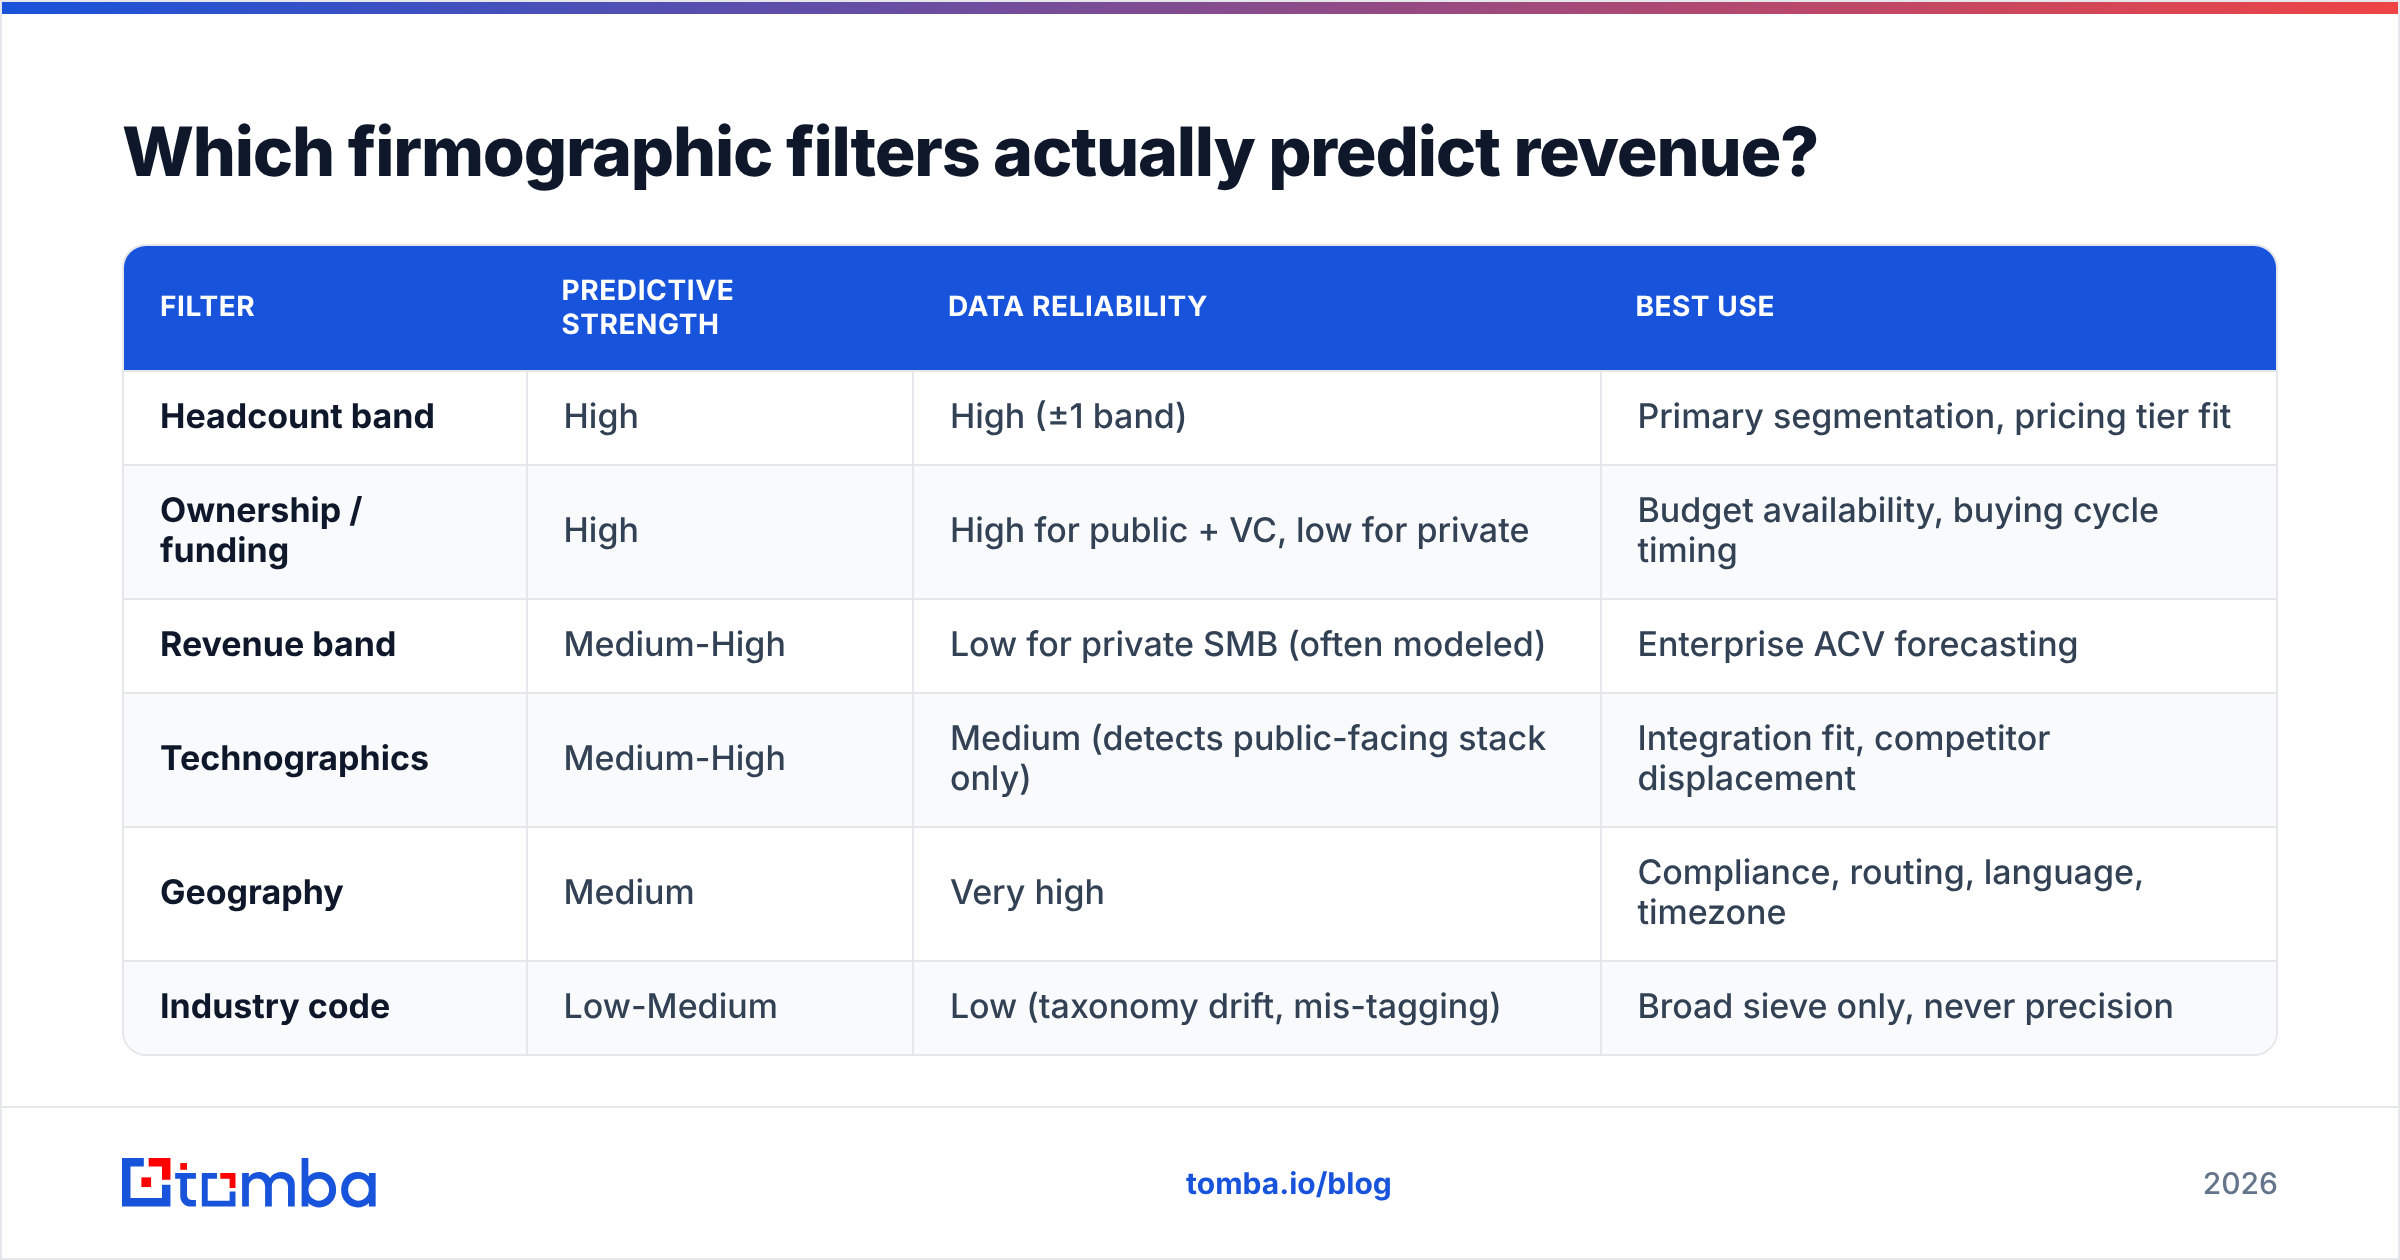
Not all six categories carry equal weight. Ranked by how well they correlate with closed-won deals in typical B2B motions:
| Filter | Predictive strength | Data reliability | Best use |
|---|---|---|---|
| Headcount band | High | High (±1 band) | Primary segmentation, pricing tier fit |
| Ownership / funding | High | High for public + VC, low for private | Budget availability, buying cycle timing |
| Revenue band | Medium-High | Low for private SMB (often modeled) | Enterprise ACV forecasting |
| Technographics | Medium-High | Medium (detects public-facing stack only) | Integration fit, competitor displacement |
| Geography | Medium | Very high | Compliance, routing, language, timezone |
| Industry code | Low-Medium | Low (taxonomy drift, mis-tagging) | Broad sieve only, never precision |
Headcount is the workhorse. It correlates with budget, org complexity, number of stakeholders, and procurement friction all at once. It is also the field most databases populate most completely. If you only get one filter, take this one.
Ownership structure is the underrated one. A PE-backed portfolio company two years into a hold period behaves nothing like a bootstrapped founder-run business of identical headcount. The first has a mandated efficiency agenda and a CFO who signs things quarterly; the second has one decision-maker who will take nine months to feel ready. Same firmographic size band, opposite sales motion.
Industry codes deserve suspicion. The NAICS system was designed for government statistical reporting, not sales targeting, and the official NAICS classification is revised only every five years. Software categories that matter commercially in 2026 barely exist in it. Treat industry as "exclude obvious non-fits," not "select exact ICP."
How do firmographics differ from technographics and intent data?#
They answer different questions, and conflating them is the most common list-building error.
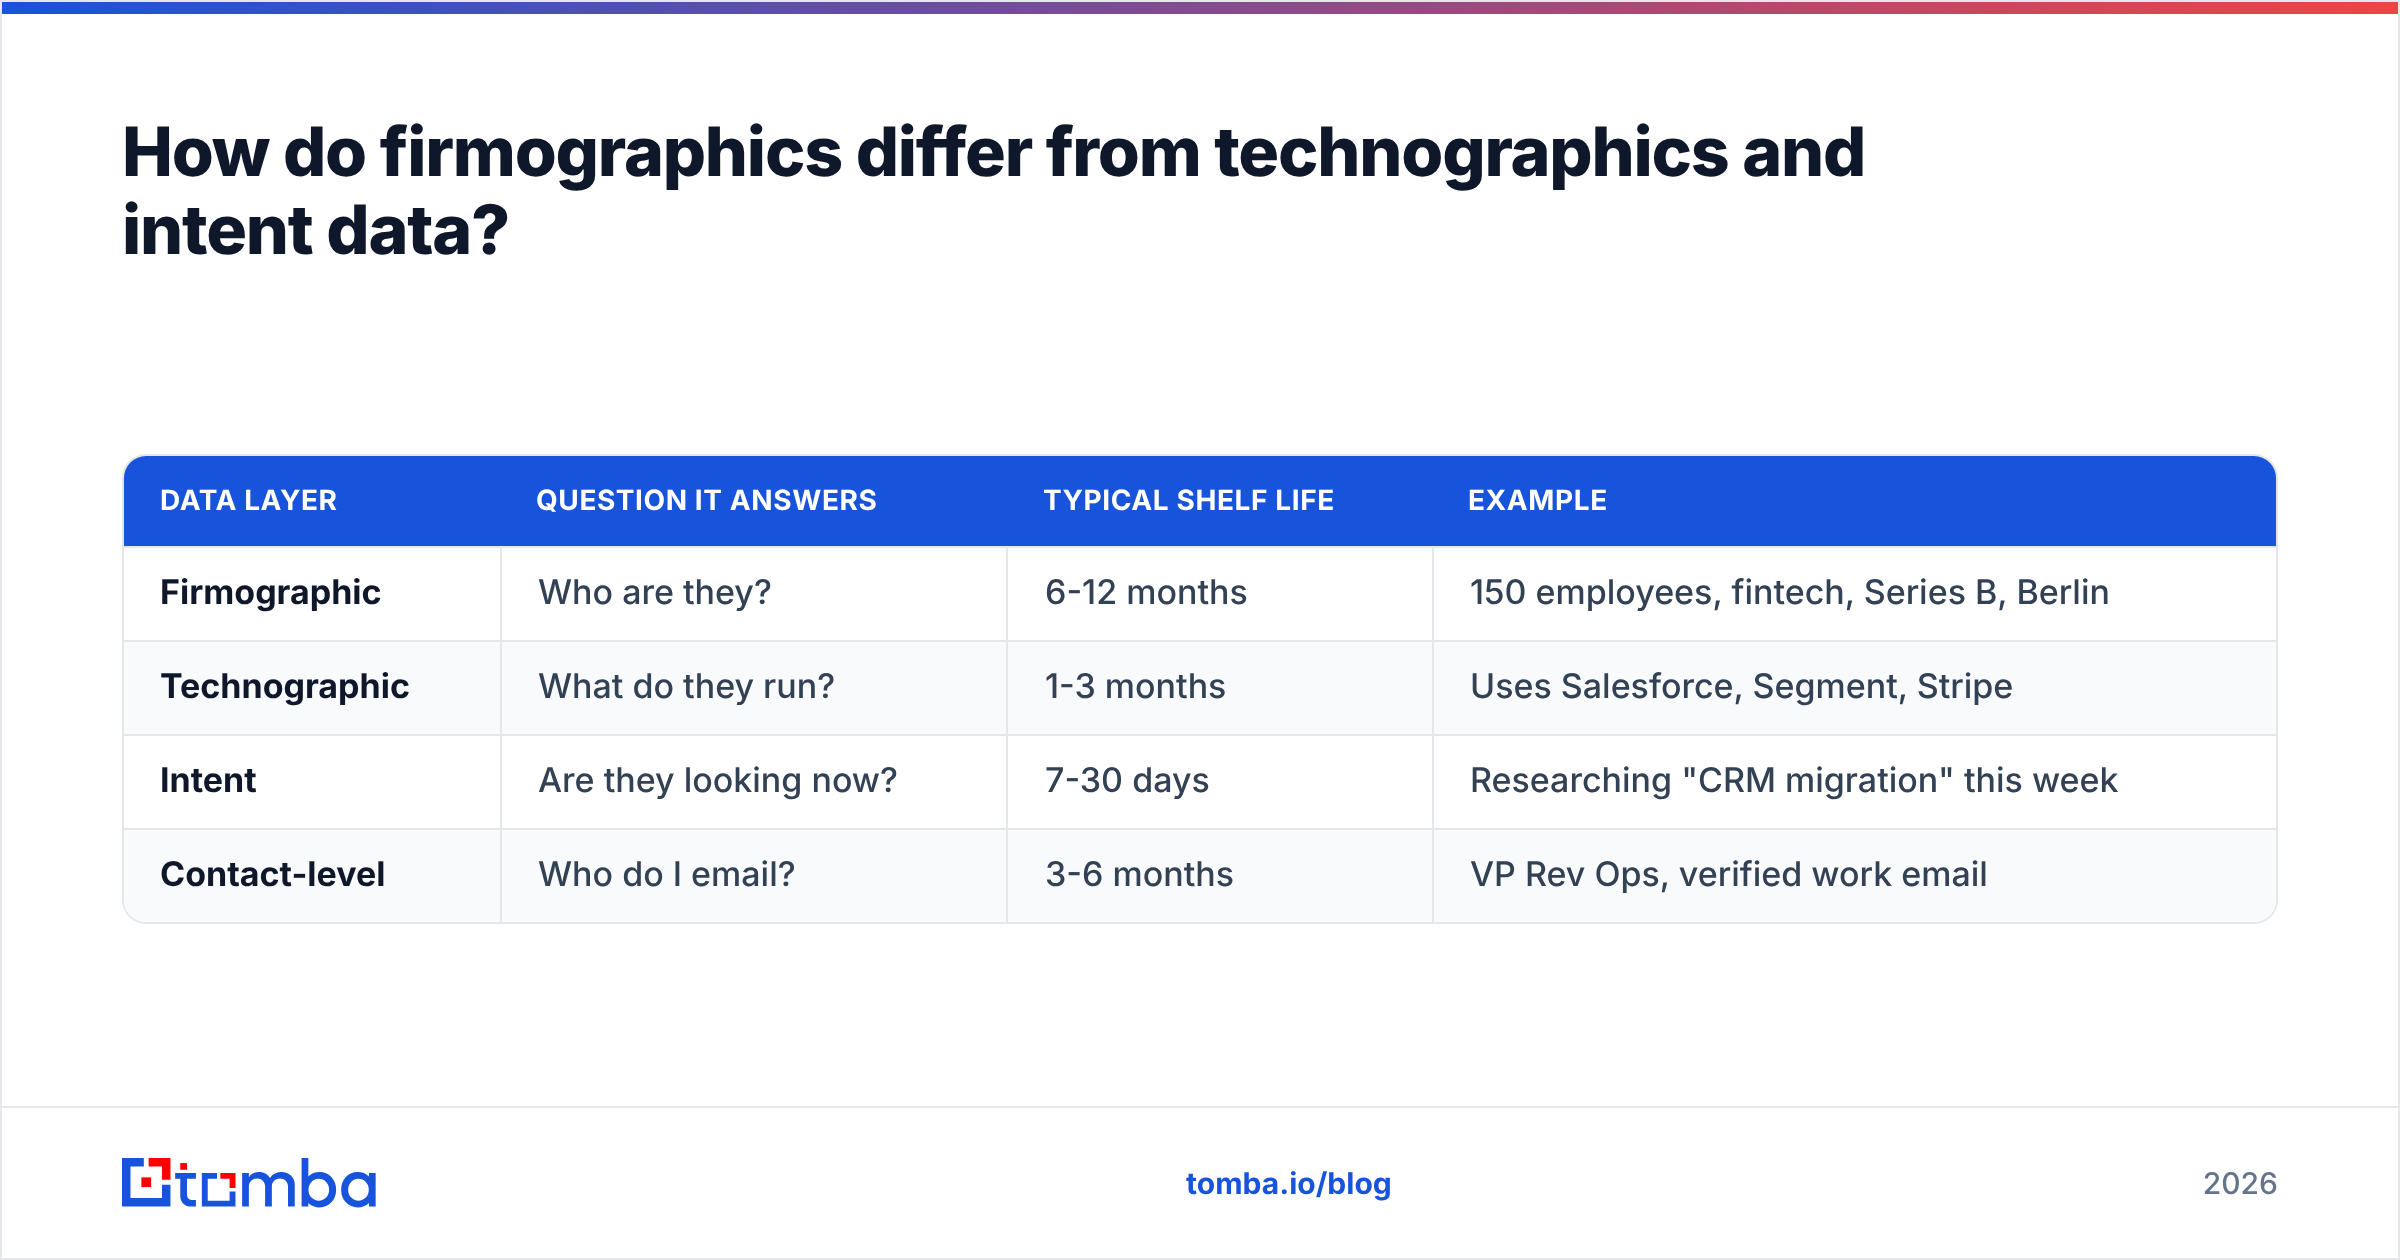
| Data layer | Question it answers | Typical shelf life | Example |
|---|---|---|---|
| Firmographic | Who are they? | 6-12 months | 150 employees, fintech, Series B, Berlin |
| Technographic | What do they run? | 1-3 months | Uses Salesforce, Segment, Stripe |
| Intent | Are they looking now? | 7-30 days | Researching "CRM migration" this week |
| Contact-level | Who do I email? | 3-6 months | VP Rev Ops, verified work email |
Firmographics are the slowest-moving and most stable layer. That is a feature: you can build a target account list in January and it is still 85% accurate in June. It is also the limitation — a stable attribute cannot tell you that a company started shopping last Tuesday.
The working model most mature GTM teams converge on:
- Firmographics define the universe. This is your total addressable market, sliced into tiers.
- Technographics rank within it. Companies running a competitor or a complementary tool jump the queue.
- Intent triggers the timing. A hiring signal, a funding round, or a research spike moves an account from "someday" to "this week."
- Contact data executes. You cannot email a firmographic. You need a verified person, which is where a domain search across the matched company list turns accounts into actual outreach targets.
Skipping straight to intent data without a firmographic foundation is how teams end up chasing enthusiastic prospects who could never afford them. Skipping intent and relying on firmographics alone is how teams end up with perfect-fit accounts who ignore them for a year.
How do you actually stack firmographic filters without killing your list?#
Use a tiered approach rather than a single query. Three tiers, evaluated in order.
Tier 1 — Hard exclusions (2-3 filters max). These are non-negotiable. Geography where you cannot legally or practically sell. Headcount floors below which your pricing makes no sense. Industries you are contractually barred from. Apply these as a filter and never look back. Expect to retain 15-40% of the raw universe.
Tier 2 — Scoring attributes (4-8 signals). Do not filter on these. Score on them. Revenue band, funding stage, tech stack, growth rate, ownership type — each contributes points rather than gating inclusion. A company missing revenue data simply scores zero on that dimension instead of vanishing from the list. This single change typically recovers 2-4x more qualified accounts than hard-filtering does.
Tier 3 — Contact-level qualification. Once you have your scored account list, the question shifts from "is this company a fit?" to "can I reach the right person here?" This is where verification matters. An account with a perfect firmographic score and no reachable decision-maker is worth less than a B-tier account with a verified VP email. Run the list through a bulk email finder pass and let deliverability be the final gate.
A practical worked example for a mid-market sales tool:
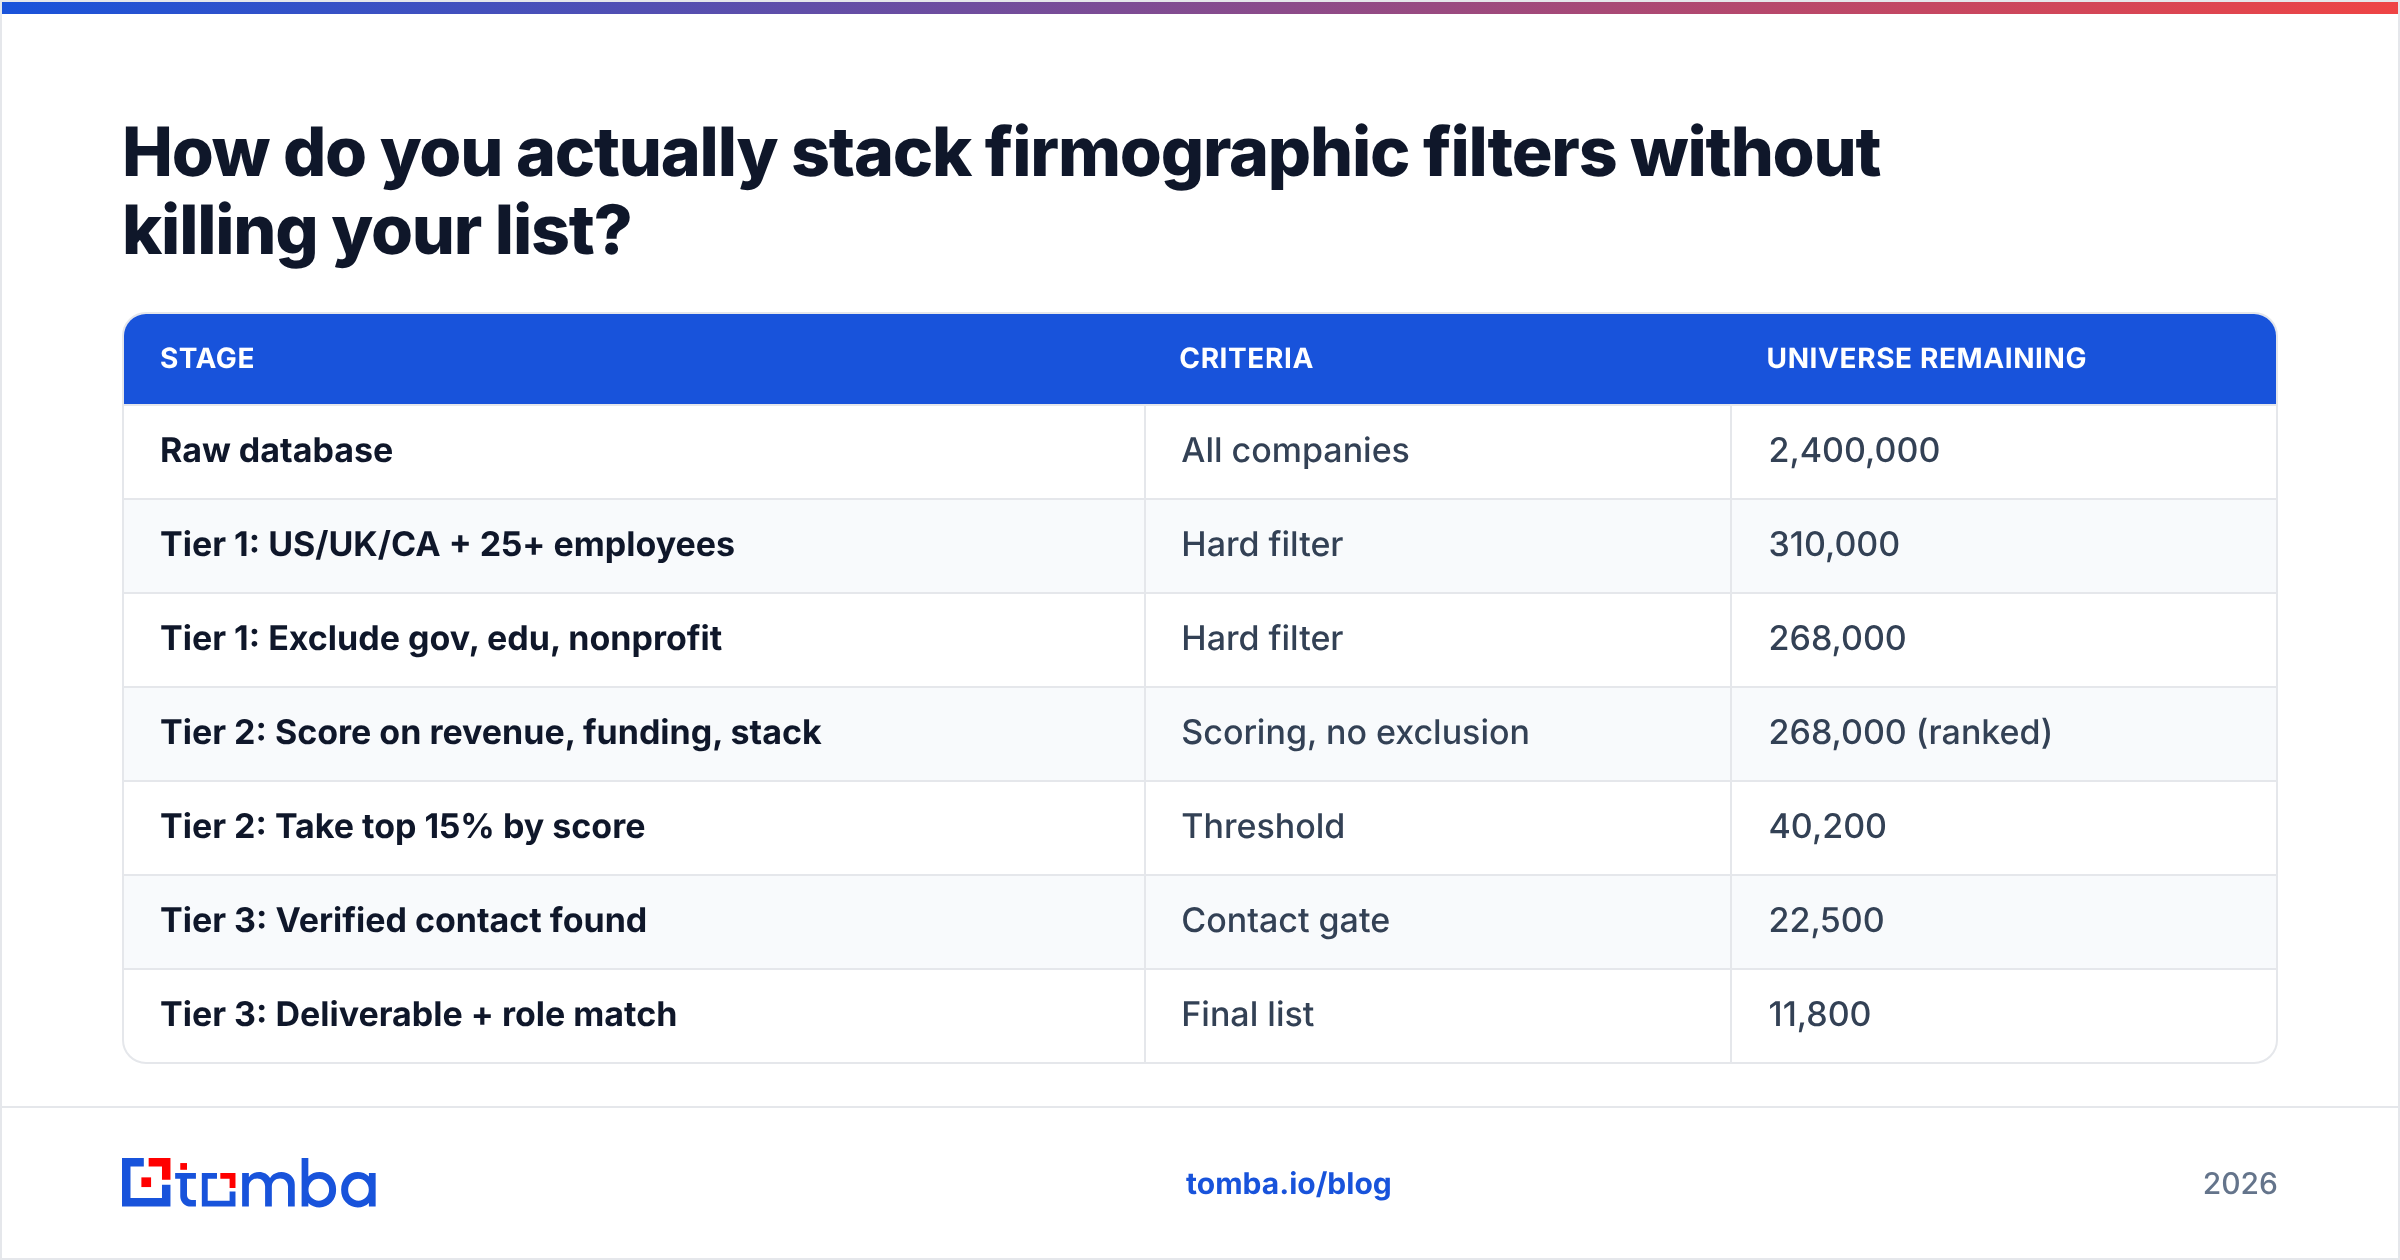
| Stage | Criteria | Universe remaining |
|---|---|---|
| Raw database | All companies | 2,400,000 |
| Tier 1: US/UK/CA + 25+ employees | Hard filter | 310,000 |
| Tier 1: Exclude gov, edu, nonprofit | Hard filter | 268,000 |
| Tier 2: Score on revenue, funding, stack | Scoring, no exclusion | 268,000 (ranked) |
| Tier 2: Take top 15% by score | Threshold | 40,200 |
| Tier 3: Verified contact found | Contact gate | 22,500 |
| Tier 3: Deliverable + role match | Final list | 11,800 |
Note what happened: the list narrowed by 99.5%, but almost none of that narrowing came from stacking firmographic filters. It came from scoring and contact-level reality. That is the correct shape.
What tools give you the best firmographic filtering in 2026?#
The market splits into three rough categories, and most teams end up using two of them.
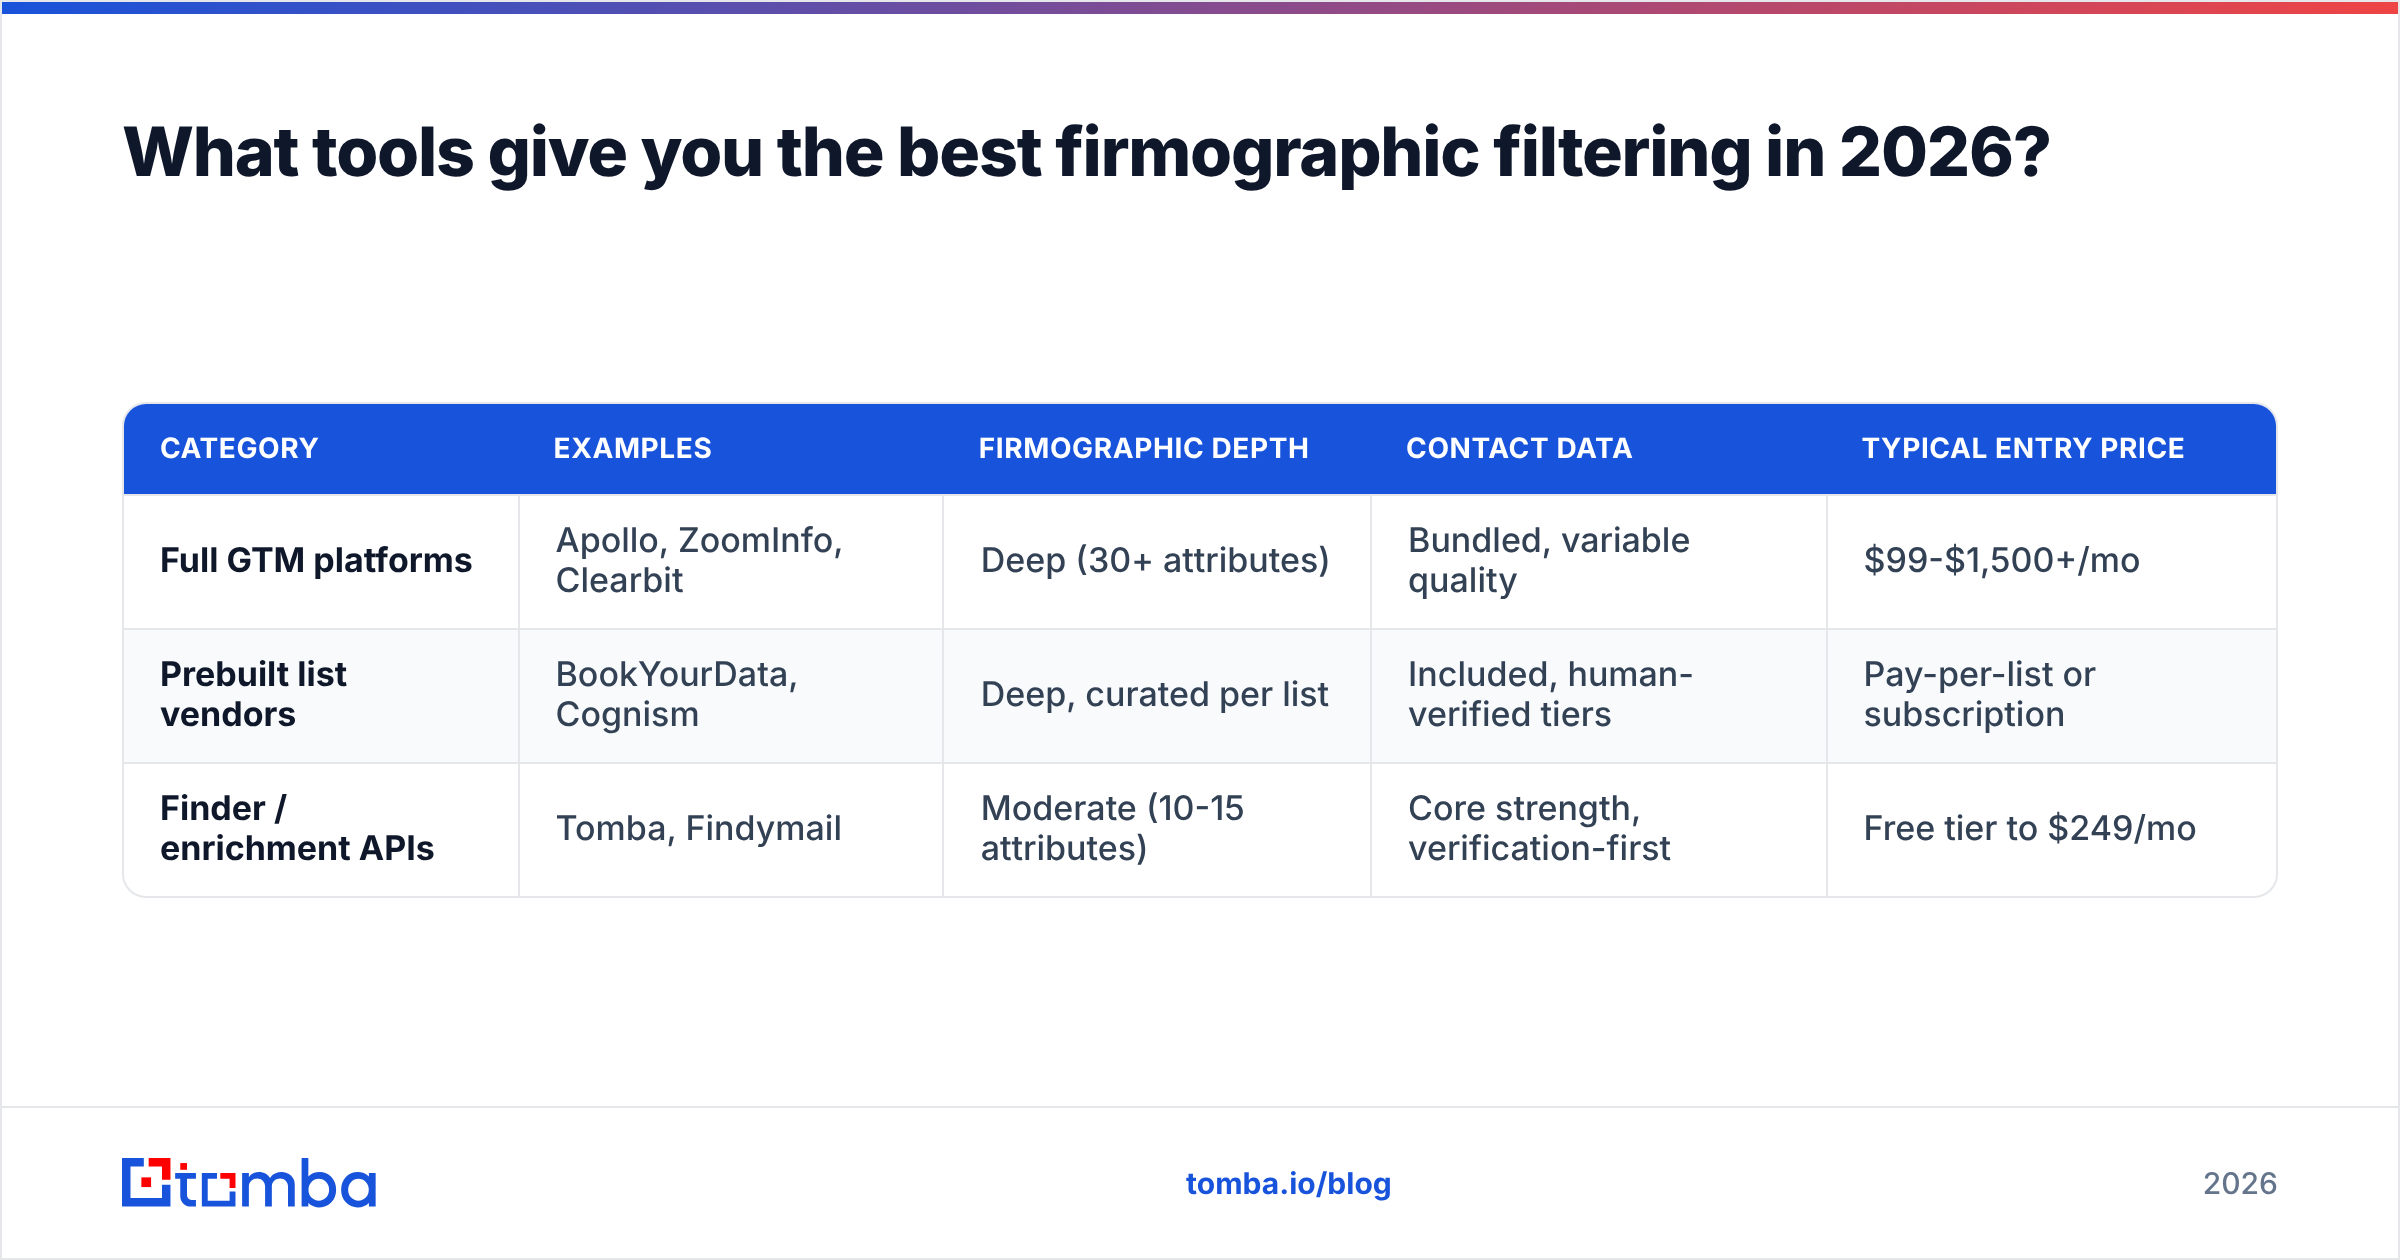
| Category | Examples | Firmographic depth | Contact data | Typical entry price |
|---|---|---|---|---|
| Full GTM platforms | Apollo, ZoomInfo, Clearbit | Deep (30+ attributes) | Bundled, variable quality | $99-$1,500+/mo |
| Prebuilt list vendors | BookYourData, Cognism | Deep, curated per list | Included, human-verified tiers | Pay-per-list or subscription |
| Finder / enrichment APIs | Tomba, Findymail | Moderate (10-15 attributes) | Core strength, verification-first | Free tier to $249/mo |
Full platforms win on filter breadth. If you need to segment by "PE-backed, 500-1000 employees, uses Workday, opened an office in EMEA in the last 12 months," a platform like Apollo or ZoomInfo will get you there. You pay for it — both in list price and in credits burned on records that turn out to be stale.
Prebuilt list vendors win on curation. BookYourData and similar providers do the firmographic work upfront and sell you a cleaned segment, which suits teams that run a few large campaigns a year rather than continuous prospecting. The trade-off is flexibility: you get the segment they built, not the one you would have built.
Finder and enrichment APIs win on the last mile. They generally offer fewer firmographic filters but far better contact discovery and verification per dollar. This is the layer where Tomba sits — you bring the account list (from a platform, a vendor, a conference roster, or a scrape) and it resolves companies to verified, deliverable contacts. Tomba's Tomba pricing starts with a free tier at 25 searches/month, Starter at $49/mo, Growth at $99/mo, and Pro at $249/mo, which makes it viable as a verification layer alongside a platform rather than a replacement for one.
The stack most efficient teams run: platform or vendor for firmographic universe building, finder API for contact resolution and verification, sequencer for execution. Trying to make one tool do all three is where budget goes to die. G2's category comparisons are a reasonable starting point for the platform layer, though be aware that review volume correlates with marketing spend more than with data quality.
How do you validate that your firmographic filters are working?#
Measure the filters, not just the campaign. Four checks, run monthly:
Coverage rate per filter. For every firmographic attribute you use, calculate what percentage of your matched universe actually has that field populated. Anything under 70% should be a scoring signal, not a hard filter. This one check prevents most over-filtering damage.
Segment reply-rate spread. Break replies down by headcount band, by industry, by ownership type. If your 51-200 band replies at 4.1% and your 201-500 band replies at 1.2%, you have found a real firmographic boundary. If every segment sits within half a point of the average, your firmographics are not doing any work and you should look at messaging instead.
Bounce rate by segment. High bounce concentrated in one firmographic slice usually signals stale data for that segment, not bad email guessing. Companies in high-churn industries (agencies, early-stage startups) go stale faster. Adjust refresh frequency per segment rather than globally.
Closed-won firmographic profile vs. targeted profile. Pull your last 50 closed-won accounts and chart their actual firmographics. Compare to what you have been targeting. The gap between the two is your ICP correction. Most teams discover they are targeting one band above where they actually win.
That last check is the highest-value exercise in this entire article and almost nobody runs it. Your CRM already contains the answer to what your ICP is. The filters should be derived from closed-won reality, not from a whiteboard session held eighteen months ago.
What are the most common firmographic filtering mistakes?#
- Filtering on revenue for SMB targets. Coverage is too thin and the numbers are modeled. Use headcount as the proxy.
- Treating one industry code as the vertical. Always select adjacent codes and manually review the edges.
- Ignoring subsidiary structure. Filtering to "1000+ employees" catches the parent but misses the 80-person subsidiary that is your actual buyer — and vice versa.
- Never refreshing. Firmographic data decays roughly 25-30% per year through moves, growth, layoffs, and M&A. A list built in 2024 and used in 2026 is half fiction.
- Filtering before verifying. Every filter you apply before contact verification is a filter applied to records that may not be reachable anyway. Verify first on a sample, then decide how tight to filter.
- Confusing narrow with targeted. A 200-company list is not more targeted than a 12,000-company list if the 200 came from stacking unreliable fields. Narrow is an output, not a strategy.
Build the list wide, then verify hard#
Firmographic filters are a probability tool, not a gate. Use two or three you genuinely trust to define the universe, score on everything else, and let contact-level verification do the real narrowing. That order — wide, scored, verified — consistently produces more pipeline than the tight-query approach, because it stops discarding qualified accounts over missing data fields.
Once you have your scored account list, the bottleneck moves from "which companies?" to "which people, and will the email land?" That is where Tomba Email Finder fits: point it at your matched domains, get verified professional emails back, and run the deliverability check before you spend a single sequence slot. Start on the free tier at 25 searches a month to test your list quality, then scale to Starter at $49/mo when the firmographics prove out.
Related guides#
Ready to find emails that actually work?
Join 150,000+ professionals who stopped guessing and started sending. Free credits on signup — no credit card required.
Get the Tomba newsletter
Practical outbound tactics and product updates — once every two weeks.
About the author