Firmographic Segmentation Definition: A 2026 B2B Guide
Firmographic segmentation sorts companies by industry, size, revenue, location, and structure. Here's the working definition, the eight variables that matter, and how to build segments your reps actually use.
TL;DR
- Firmographic segmentation is the practice of grouping companies (not people) by shared organizational attributes: industry, headcount, revenue, location, ownership, growth stage, and structure.
- It is the B2B equivalent of demographic segmentation. Demographics describe a person; firmographics describe an account.
- Eight variables cover roughly 90% of real-world use: industry/SIC-NAICS, employee count, revenue, geography, ownership type, growth signals, org structure, and customer type (B2B vs B2C).
- Firmographics alone are blunt. Layering technographic and intent data on top is what separates a usable segment from a spreadsheet filter.
- Segments only pay off when they change something downstream — routing, pricing, messaging, or SLA. If nothing changes, you built a report, not a segment.
What is the firmographic segmentation definition?#
Firmographic segmentation is the process of dividing a B2B market into groups of companies that share measurable organizational characteristics — industry, size, revenue, location, ownership, and structure — so you can target, price, and message each group differently.
The everyday analogy: a clothing retailer segments shoppers by age, income, and city. A B2B vendor cannot do that, because the buyer is not a person — it is a company with a budget, a procurement process, and a headcount. Firmographics are the age, income, and city of a company.
Technically, the term traces back to marketing research in the 1980s, when analysts needed a word for "demographics, but for organizations." The Wikipedia entry on firmographics still frames it that way: observable, externally verifiable attributes of a business entity.
Three things fall inside the definition:
- Attributes must describe the organization, not an individual. "VP of Engineering" is a persona attribute. "310 employees" is a firmographic.
- Attributes must be observable or inferable from public/commercial data. Revenue bands, NAICS codes, funding rounds, HQ country — all firmographic. "How much they hate their current vendor" is not.
- Attributes must be stable enough to act on. Headcount moves quarterly. Industry rarely moves. Segment on the slow-moving variables; use the fast-moving ones as triggers.
Which firmographic variables actually matter?#
Most teams over-collect and under-use. These eight carry the weight:
- Industry / vertical — NAICS, SIC, or your own taxonomy. Drives compliance requirements, buying cycle length, and vocabulary. A fintech and a logistics firm with identical headcount buy nothing alike.
- Employee count — the single most predictive size proxy in B2B SaaS, because seat-based pricing keys off it. Use bands (1–10, 11–50, 51–200, 201–1000, 1000+), not exact numbers.
- Annual revenue — better than headcount for services, manufacturing, and anything where output does not scale with people.
- Geography — HQ country, operating regions, and time zone. Determines data-residency requirements, language, and whether your AE can actually take the call.
- Ownership and funding stage — bootstrapped, VC-backed Series B, PE portfolio, public. Budget behavior differs wildly. A Series B company buys for growth; a PE portfolio company buys for margin.
- Growth signals — headcount delta over 6–12 months, new office openings, recent funding. This is where firmographics start behaving like intent data.
- Organizational structure — centralized vs. distributed buying, number of subsidiaries, whether IT is global or per-region. Predicts deal complexity more than size does.
- Customer type — does the account sell B2B, B2C, B2G, or a mix? A B2C ecommerce brand and a B2B wholesaler with the same revenue have different data volumes and different pain.

How do firmographics compare to other B2B segmentation models?#
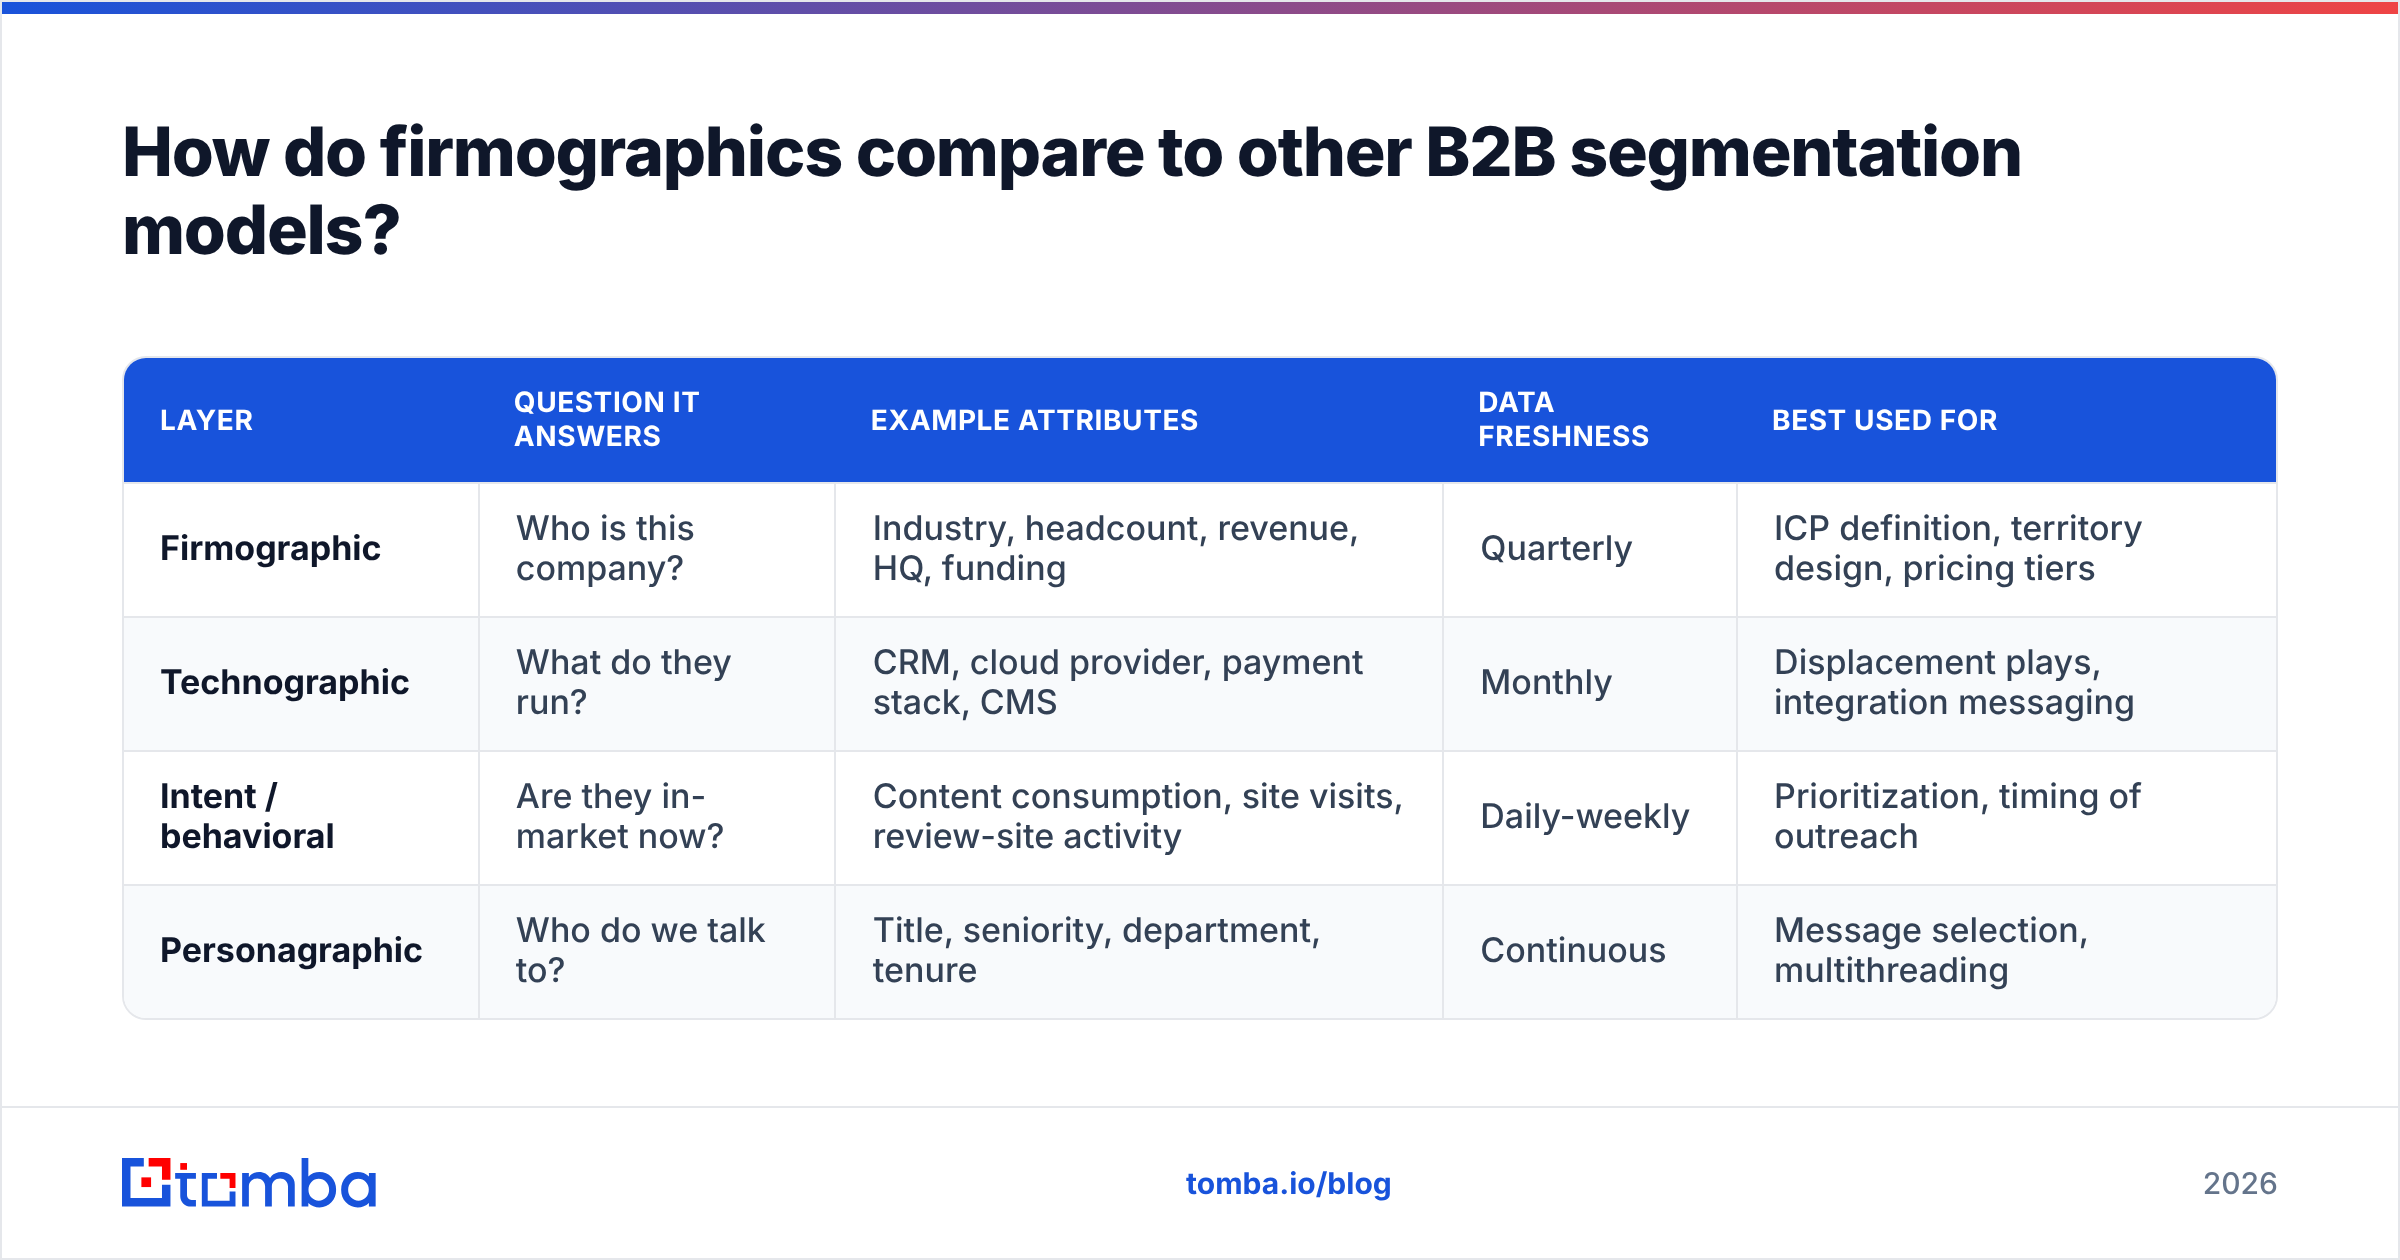
Firmographics are one of four common layers. Each answers a different question, and mature GTM teams stack them.
| Layer | Question it answers | Example attributes | Data freshness | Best used for |
|---|---|---|---|---|
| Firmographic | Who is this company? | Industry, headcount, revenue, HQ, funding | Quarterly | ICP definition, territory design, pricing tiers |
| Technographic | What do they run? | CRM, cloud provider, payment stack, CMS | Monthly | Displacement plays, integration messaging |
| Intent / behavioral | Are they in-market now? | Content consumption, site visits, review-site activity | Daily-weekly | Prioritization, timing of outreach |
| Personagraphic | Who do we talk to? | Title, seniority, department, tenure | Continuous | Message selection, multithreading |
The failure mode is treating firmographics as the whole strategy. A list of every 51–200 employee SaaS company in North America is not a segment; it is a universe. It becomes a segment when you add a reason to believe those companies convert better, close faster, or churn less than the average account.
Gartner's B2B buying research makes the point sharply: buying groups now average six to ten stakeholders, and deal complexity tracks organizational structure more than headline company size. Firmographics tell you the shape of the buying group. They do not tell you when it wakes up.
How do you build a firmographic segment that reps actually use?#
Work backwards from the action, not forwards from the data.
Step 1 — Mine your own closed-won data first. Pull the last 12–24 months of closed-won and closed-lost accounts. Tag each with industry, employee band, revenue band, region, and ownership. Look for bands where win rate exceeds your baseline by 1.5x or more. This is empirical ICP, not aspirational ICP.
Step 2 — Check the negative signal too. Segments that churn or discount heavily matter as much as segments that convert. If sub-20-employee accounts close fast but churn at 4x the rate, they are a disqualification segment.
Step 3 — Cap the count. Three to five primary segments is the ceiling for most teams. Beyond that, enablement collapses and no rep remembers which playbook applies.
Step 4 — Attach a decision to each segment. Every segment must change at least one of: routing rules, pricing tier, sequence copy, SLA, or discovery questions. A segment with no downstream change is a slide.
Step 5 — Make the data collectable at scale. A segment defined on attributes you cannot append to 10,000 records is unusable. Employee band, industry, and country are appendable. "Has a modern data culture" is not.
Step 6 — Re-cut it quarterly. Headcount bands drift. Companies get acquired. Set a recurring review or your segments silently rot.
Where does the data for firmographic segmentation come from?#
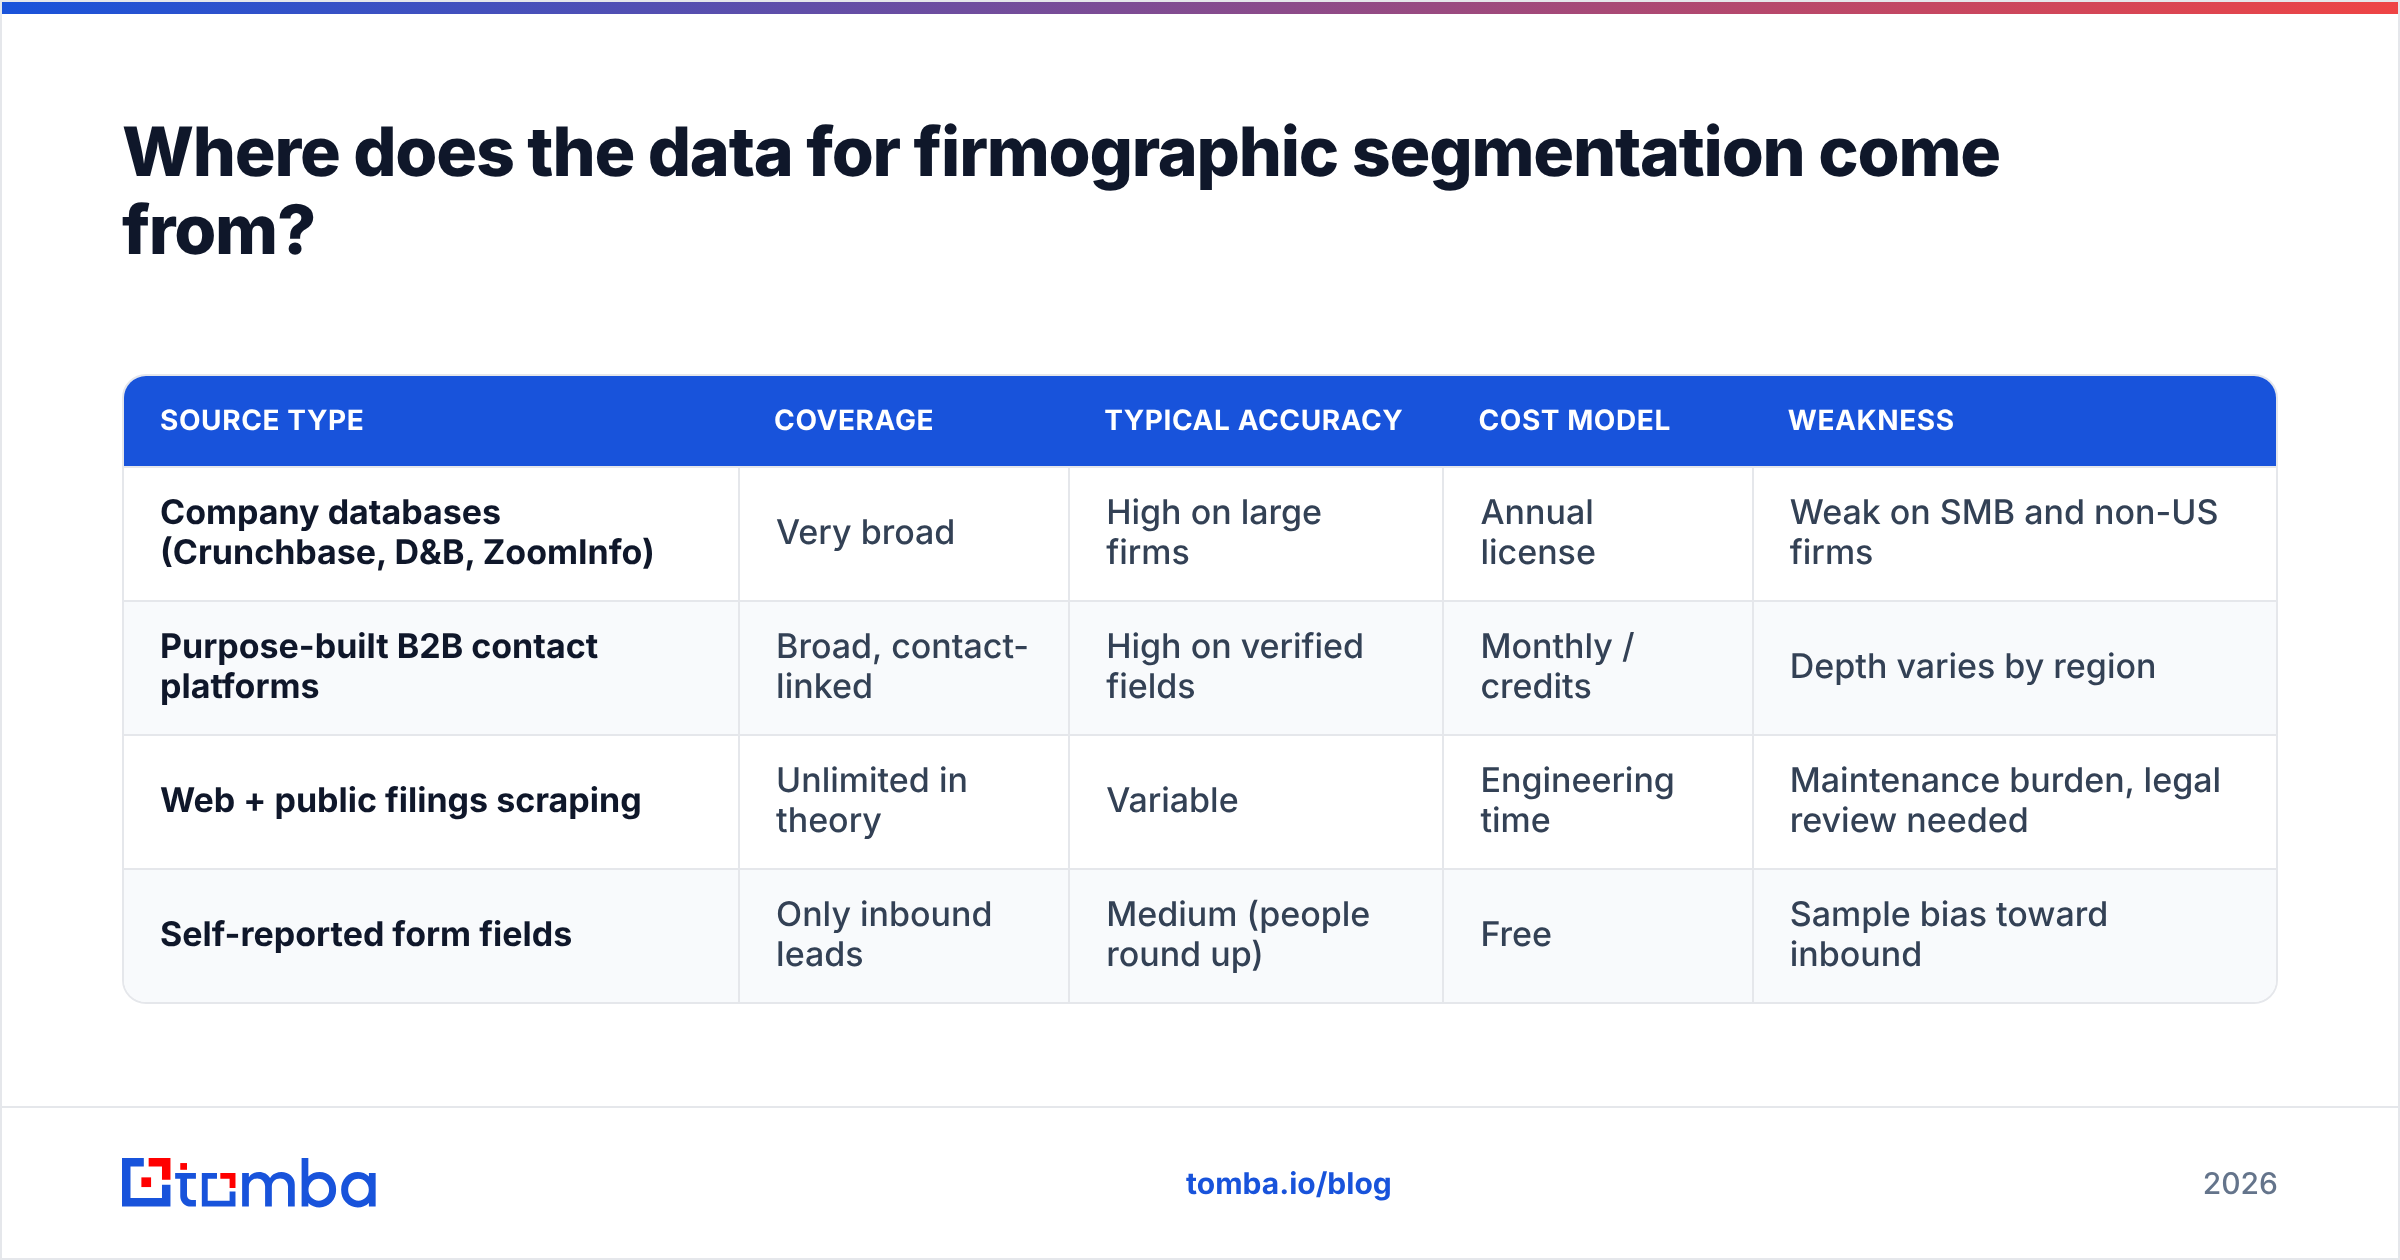
Four sources, with different cost and accuracy profiles.
| Source type | Coverage | Typical accuracy | Cost model | Weakness |
|---|---|---|---|---|
| Company databases (Crunchbase, D&B, ZoomInfo) | Very broad | High on large firms | Annual license | Weak on SMB and non-US firms |
| Purpose-built B2B contact platforms | Broad, contact-linked | High on verified fields | Monthly / credits | Depth varies by region |
| Web + public filings scraping | Unlimited in theory | Variable | Engineering time | Maintenance burden, legal review needed |
| Self-reported form fields | Only inbound leads | Medium (people round up) | Free | Sample bias toward inbound |
In practice most teams blend two: a licensed database for the account universe, and an enrichment layer that fills gaps and attaches contactable people to each account. That second job is where an email finder and a data enrichment API earn their keep — a firmographic segment with no reachable contacts is an academic exercise.
A practical sequencing that works: define the segment, pull the domain list, run domain search to map who works there by department, then verify before any send. Tomba's data sources page is worth reading before you commit to any vendor — coverage claims vary enormously by region, and every provider is stronger somewhere and weaker elsewhere.

What are the most common firmographic segmentation mistakes?#
Segmenting on what is easy to collect rather than what predicts revenue. Employee count is easy. It is also a weak predictor in services businesses where a 40-person consultancy can out-spend a 400-person retailer.
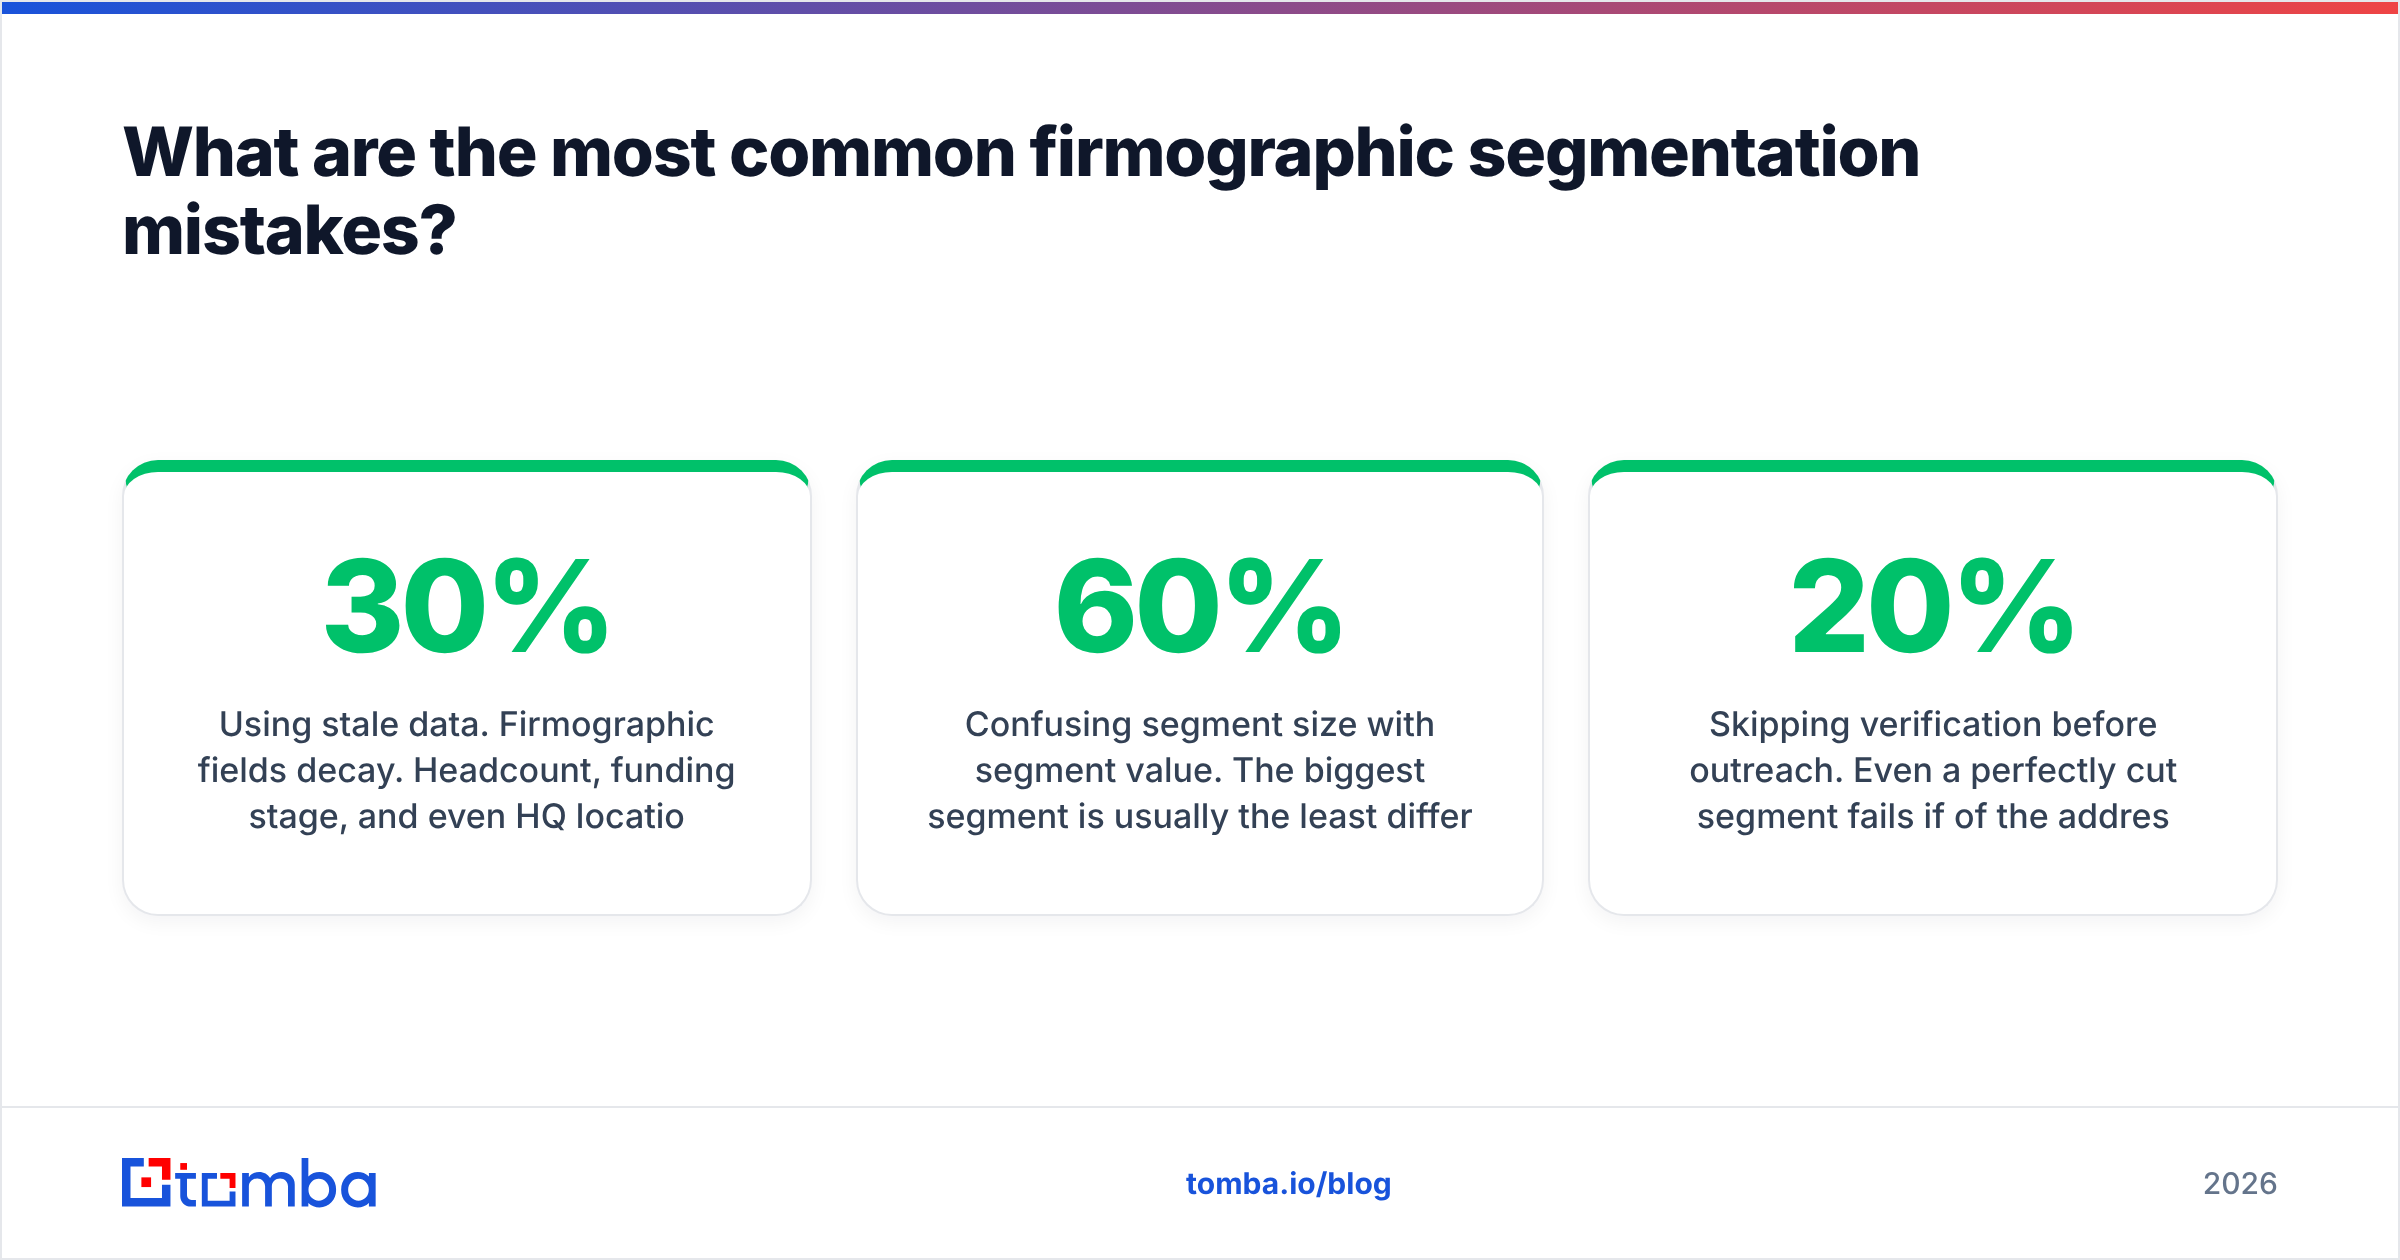
Using stale data. Firmographic fields decay. Headcount, funding stage, and even HQ location shift constantly, and B2B contact data degrades roughly 25–30% per year according to most industry estimates — HubSpot's research on database decay lands in the same range. A segment built on two-year-old records is targeting companies that no longer exist in that shape.
Confusing segment size with segment value. The biggest segment is usually the least differentiated. If 60% of your TAM falls into one bucket, that bucket is not a segment — it is the default.
Ignoring the mid-market gap. Many ICPs are defined at the extremes: SMB self-serve and enterprise land-and-expand. The 200–800 employee band frequently gets no owned playbook and quietly becomes the highest-CAC cohort.
Never validating with reps. If your AEs cannot describe a segment in one sentence and name three accounts in it, the segment does not exist operationally.
Skipping verification before outreach. Even a perfectly cut segment fails if 20% of the addresses bounce. Run an email verifier pass on any list before it enters a sequence, and treat catch-all domains as a separate handling bucket, not as valid.
How do you measure whether your segmentation is working?#
Track four numbers per segment, compared against your all-accounts baseline:
- Win rate — the primary signal. A segment that does not beat baseline win rate by a meaningful margin is not carrying its weight.
- Average contract value — reveals whether the segment is worth the enablement cost.
- Sales cycle length — enterprise-heavy segments will run longer; the question is whether the ACV premium covers the extra weeks.
- Net revenue retention — the honest measure. Segments that close well and churn fast are the most expensive mistake in B2B.
Add a fifth if you can measure it: cost per closed-won opportunity by segment. It is the number that ends most arguments about where to spend next quarter's budget.
Review these quarterly against the same cohort definition. Changing both the segment definition and the measurement window at once makes the data uninterpretable, and that is how segmentation programs get quietly abandoned.
Is firmographic segmentation still relevant in 2026?#
Yes — but as a foundation layer rather than the whole building.
What changed is that intent and technographic data are now cheap enough that no one needs to guess at timing anymore. What did not change is that you still need a defensible account universe before intent signals mean anything. Firing intent alerts across a badly defined TAM just produces faster noise.
The 2026 version of the practice looks like this: firmographics define who is eligible, technographics define what to lead with, intent defines when to move, and personagraphics define who to write to. Skip the first layer and the other three have nothing to filter.
There is also a data-quality dividend. Clean firmographic fields make every downstream system better — territory assignment, lead scoring, forecast segmentation, and revenue operations reporting all inherit the quality of your account-level attributes. Teams that invest in firmographic hygiene tend to discover the payoff shows up in three or four dashboards they were not even trying to fix.
Getting from segment definition to reachable contacts#
A firmographic segment is a hypothesis about which companies will buy. It only becomes revenue when someone at those companies opens an email.
Once you have your target domain list, the Tomba Email Finder turns it into named, verified contacts — search by domain or by person, filter by department and seniority, and verify before you send. The free tier gives you 25 searches a month to sanity-check coverage on your specific segment before you commit; paid plans start at $49/mo on Starter, with Growth at $99/mo and Pro at $249/mo. See the full Tomba pricing breakdown for credit allocations per tier.
Define the segment properly, then make it contactable. In that order.
Related guides#
Ready to find emails that actually work?
Join 150,000+ professionals who stopped guessing and started sending. Free credits on signup — no credit card required.
Get the Tomba newsletter
Practical outbound tactics and product updates — once every two weeks.
About the author