Firmographic Segmentation Example: How to Build B2B Segments
A real firmographic segmentation example, built segment by segment: the five core fields, a scoring model, worked SaaS and agency scenarios, and the data sources that keep it accurate.
TL;DR
- Firmographic segmentation splits your B2B market by company attributes — industry, size, revenue, location, ownership, and tech stack — instead of by individual buyer traits.
- A usable firmographic segmentation example is not a list of fields. It is a scored matrix that outputs three tiers: build, target, ignore.
- The five core fields carry ~80% of the signal: industry (NAICS/SIC), employee count, revenue band, HQ geography, and growth stage.
- Segmentation dies at the data layer. Roughly 25–30% of B2B contact and company records decay each year, so segment definitions need a refresh cadence, not a one-time build.
- Work through the two full scenarios below (a $12k-ACV SaaS and a 9-person agency) and you can rebuild the whole model on your own account list in an afternoon.
What is firmographic segmentation, in plain terms?#
Firmographics are to companies what demographics are to people. Demographics ask "how old is this person, where do they live, what do they earn." Firmographics ask "how big is this company, what industry is it in, where is its HQ, how fast is it growing."
That is the whole concept. The complexity comes from what you do with the answers.
Firmographic segmentation is the practice of grouping accounts in your total addressable market into clusters that behave similarly — similar buying committees, similar budget cycles, similar objections, similar deal sizes — so you can build one message and one motion per cluster instead of one per account.
The standard field set:
- Industry — usually captured as NAICS or SIC code, sometimes as a free-text vertical label. The most predictive single field for most B2B products, and the messiest one in practice.
- Company size — headcount is the workhorse. It proxies budget, org complexity, and buying-committee size better than revenue does, because headcount is more reliably observable.
- Revenue — annual revenue band. Strong for pricing tiers and for qualifying enterprise motion, weak for private companies where the number is estimated.
- Location — HQ country/state, plus office footprint. Drives territory assignment, compliance requirements (GDPR, CCPA, data-residency), and language.
- Ownership and stage — private, public, PE-backed, VC-backed, bootstrapped, non-profit, government. A Series B startup and a 40-year-old family manufacturer with identical headcount buy nothing alike.
- Technographics — the tools they already run. Technically an adjacent discipline, but everyone folds it into firmographics now because it is the single best "are they ready for us" signal.

Why does firmographic segmentation matter more in 2026?#
Because outbound volume stopped working. Inbox providers tightened bulk-sender rules, buyers got faster at pattern-matching generic sequences, and the cost of a wrong-fit email went from "ignored" to "reputation damage." Segmentation is now the cheapest lever you have for raising response rate without adding headcount.
Three concrete payoffs:
Message specificity without message sprawl. Ten segments means ten sequences, not four thousand personalized emails. That is a workload a two-person team can actually maintain.
Honest forecasting. When your pipeline is tagged by segment, win rates become comparable. You stop asking "why is our win rate 18%" and start asking "why is our mid-market manufacturing win rate 31% and our enterprise fintech win rate 6%." One of those questions has an action attached.
Spend allocation. Paid, events, content, and SDR hours all get pointed at the segments with proven win rate, instead of getting spread evenly across a TAM you invented in a spreadsheet.
Research from Gartner on B2B buying has consistently shown that buying groups now involve six to ten stakeholders — and the shape of that group varies enormously by company size and industry. You cannot design a buying-committee strategy without first knowing which committee you are walking into. That is a firmographic question.
What does a real firmographic segmentation example look like?#
Here is the worked example. The company: a mid-market SaaS product for workforce scheduling, $12,000 average contract value, sold to operations leaders, 40% of revenue from healthcare and hospitality.
Step 1 — Pull the raw attributes. Export closed-won and closed-lost from the last 18 months. Minimum fields: domain, industry, headcount, revenue band, HQ country, funding stage, deal outcome, ACV, sales-cycle length.
Step 2 — Find where the wins cluster. Do not theorize. Sort by win rate and look at what the top decile share.
Step 3 — Name the clusters. Turn statistical clusters into segments a rep can recognize on a call.
Step 4 — Score and tier them. Assign weights, add them up, cut into tiers.
Step 5 — Attach a motion to each tier. A segment without an assigned play is trivia.
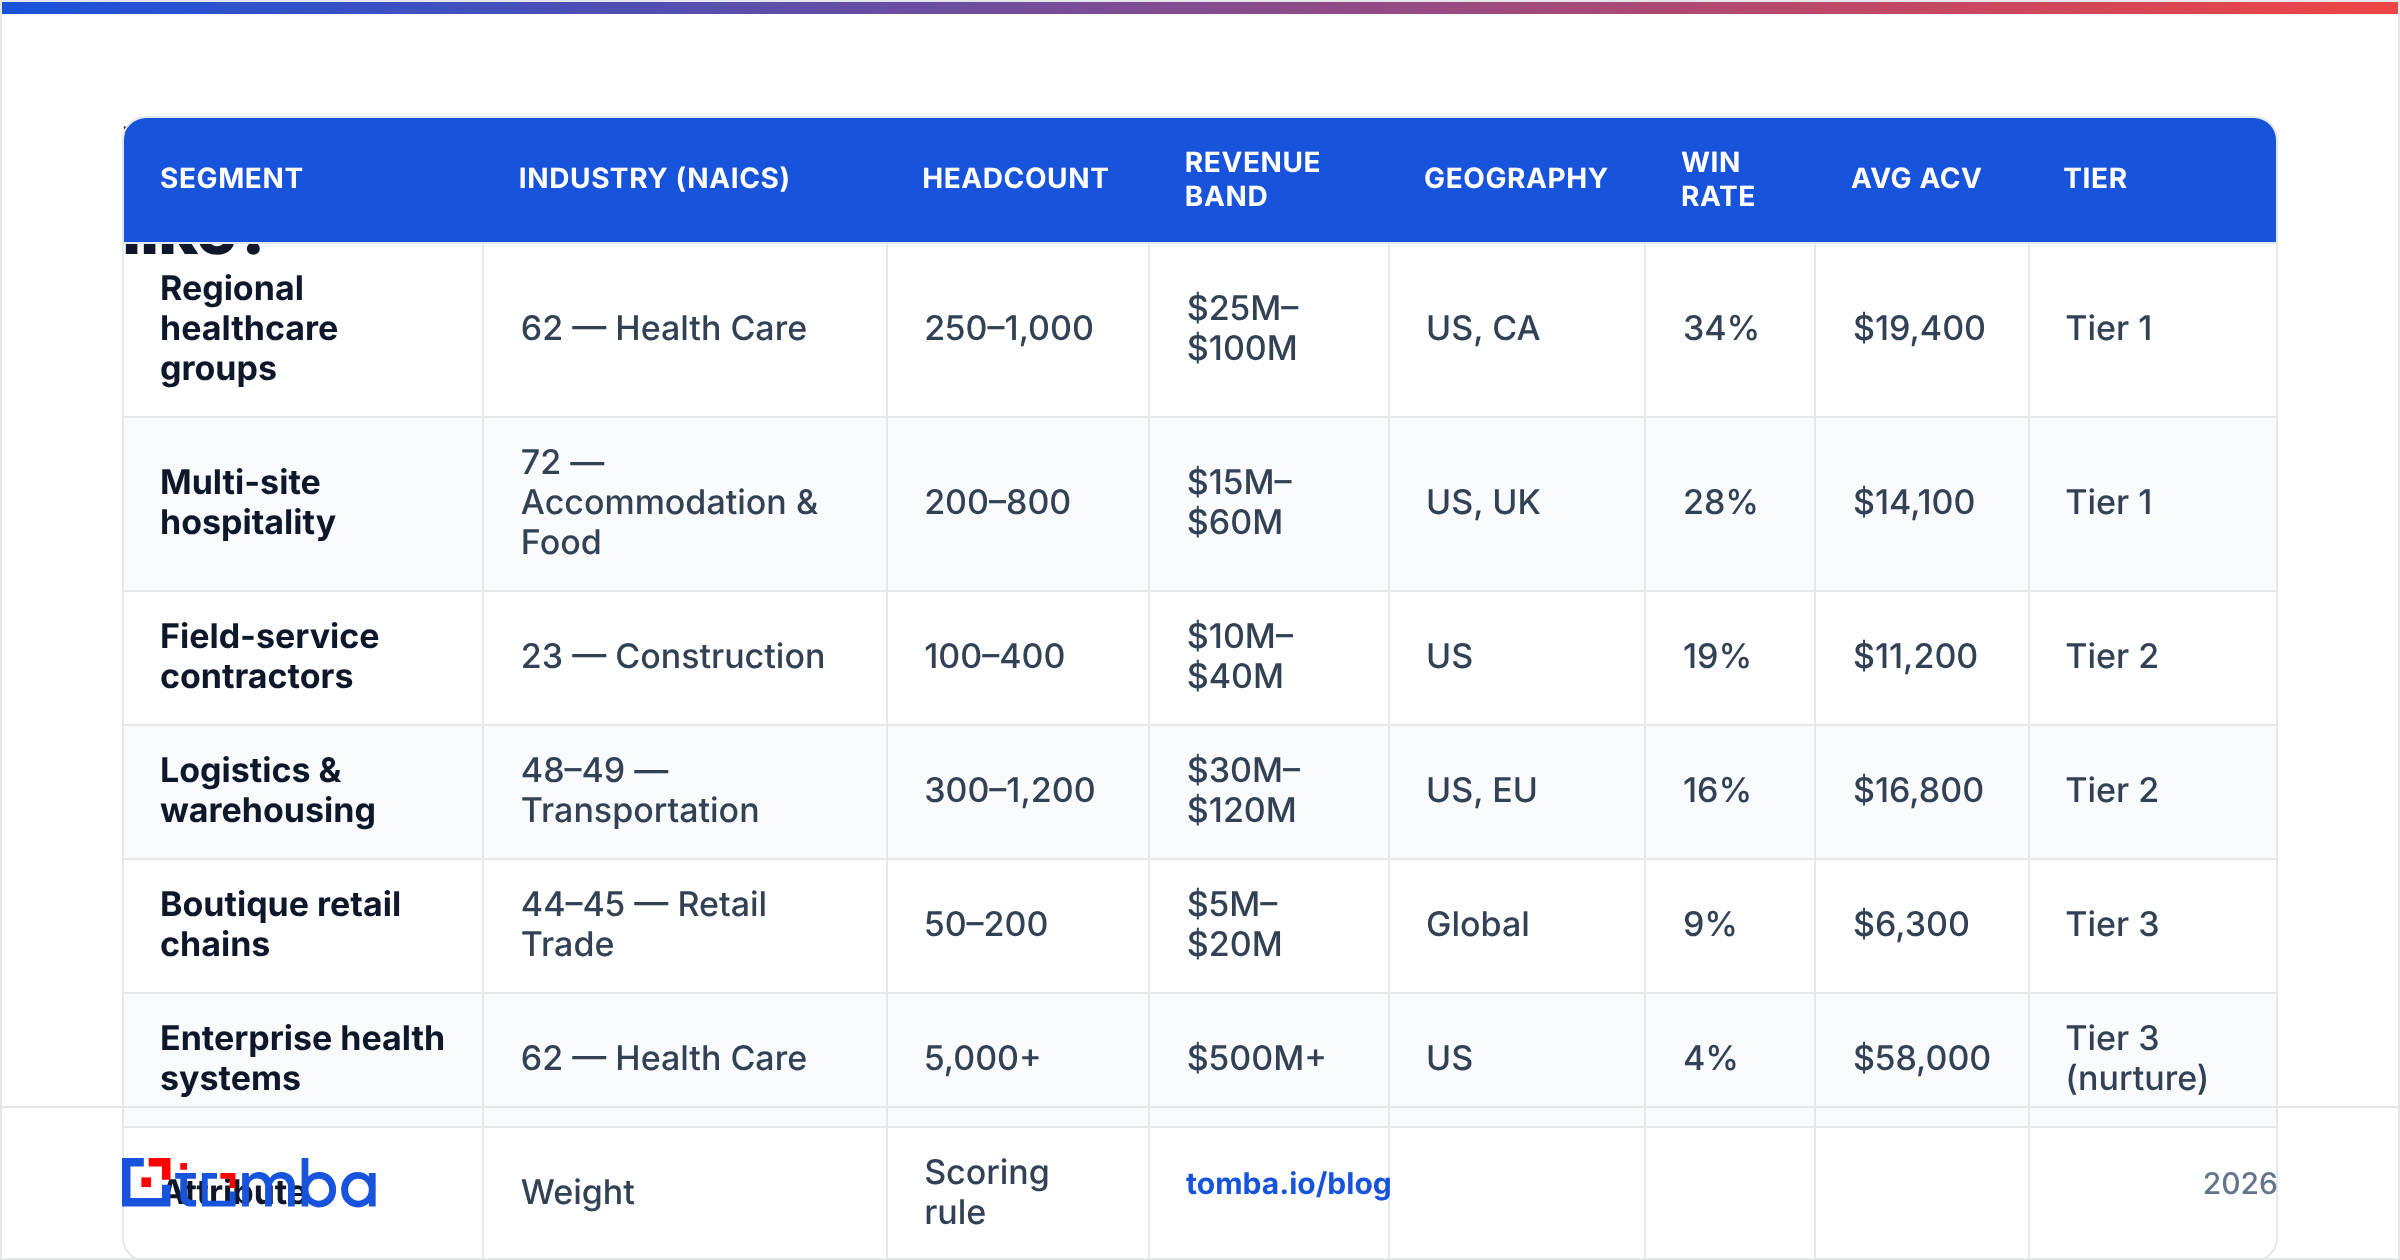
Here is what steps 3 and 4 produced:
| Segment | Industry (NAICS) | Headcount | Revenue band | Geography | Win rate | Avg ACV | Tier |
|---|---|---|---|---|---|---|---|
| Regional healthcare groups | 62 — Health Care | 250–1,000 | $25M–$100M | US, CA | 34% | $19,400 | Tier 1 |
| Multi-site hospitality | 72 — Accommodation & Food | 200–800 | $15M–$60M | US, UK | 28% | $14,100 | Tier 1 |
| Field-service contractors | 23 — Construction | 100–400 | $10M–$40M | US | 19% | $11,200 | Tier 2 |
| Logistics & warehousing | 48–49 — Transportation | 300–1,200 | $30M–$120M | US, EU | 16% | $16,800 | Tier 2 |
| Boutique retail chains | 44–45 — Retail Trade | 50–200 | $5M–$20M | Global | 9% | $6,300 | Tier 3 |
| Enterprise health systems | 62 — Health Care | 5,000+ | $500M+ | US | 4% | $58,000 | Tier 3 (nurture) |
Read the last row carefully, because it is the row people get wrong. Enterprise health systems have the highest ACV on the sheet and a 4% win rate with a 14-month cycle. For a nine-rep team, that is a losing allocation of hours — so it gets a nurture motion (content, events, executive relationships) rather than SDR sequencing. High contract value is not the same as high segment value.
The scoring model behind the tiers#
Weights should reflect what actually predicts revenue in your data, not what feels important. For this SaaS company:
| Attribute | Weight | Scoring rule |
|---|---|---|
| Industry match | 30 | 30 = healthcare/hospitality, 15 = construction/logistics, 0 = other |
| Headcount band | 25 | 25 = 200–1,000, 12 = 100–199 or 1,001–2,500, 0 = outside |
| Multi-site operations | 20 | 20 = 3+ physical locations, 10 = 2, 0 = single site |
| Geography | 15 | 15 = US/CA/UK, 8 = EU, 0 = rest of world |
| Shift-scheduling tech in stack | 10 | 10 = legacy competitor detected, 5 = spreadsheets, 0 = modern competitor |
Tier 1 = 75+. Tier 2 = 50–74. Tier 3 = below 50. That is the entire model, and it fits in a Google Sheet or a CRM formula field.
How is firmographic segmentation different from the other segmentation types?#
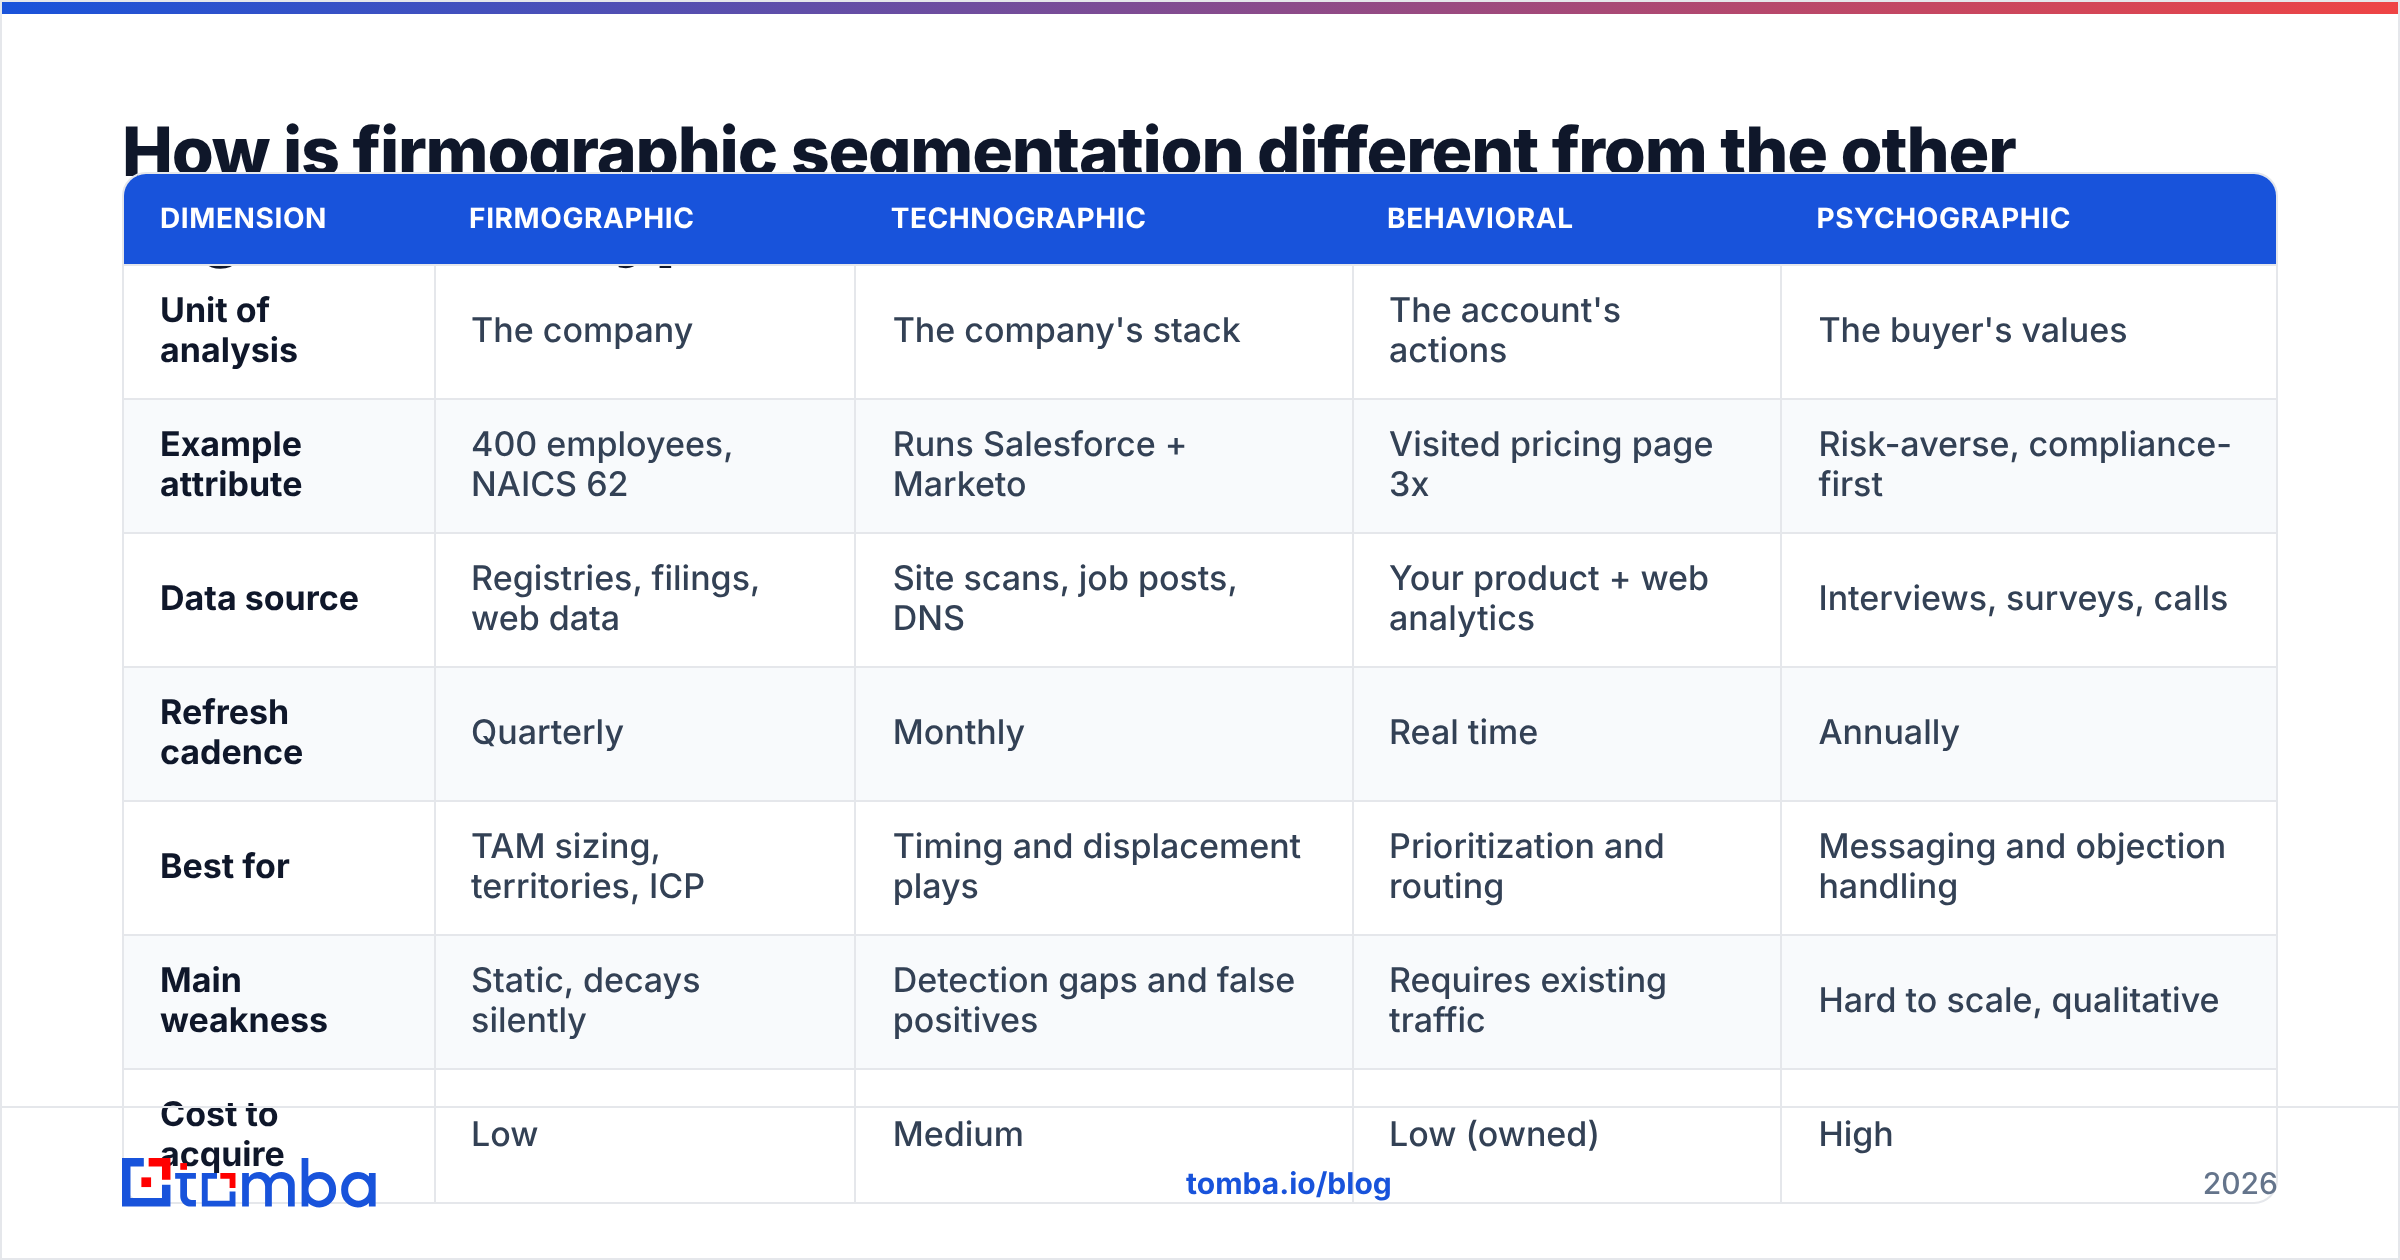
This is the comparison that clears up most confusion. Firmographics tell you which door to knock on. The other three tell you what to say once it opens.
| Dimension | Firmographic | Technographic | Behavioral | Psychographic |
|---|---|---|---|---|
| Unit of analysis | The company | The company's stack | The account's actions | The buyer's values |
| Example attribute | 400 employees, NAICS 62 | Runs Salesforce + Marketo | Visited pricing page 3x | Risk-averse, compliance-first |
| Data source | Registries, filings, web data | Site scans, job posts, DNS | Your product + web analytics | Interviews, surveys, calls |
| Refresh cadence | Quarterly | Monthly | Real time | Annually |
| Best for | TAM sizing, territories, ICP | Timing and displacement plays | Prioritization and routing | Messaging and objection handling |
| Main weakness | Static, decays silently | Detection gaps and false positives | Requires existing traffic | Hard to scale, qualitative |
| Cost to acquire | Low | Medium | Low (owned) | High |
The practical sequence: firmographics define the list, technographics rank it, behavior re-ranks it daily, psychographics writes the copy. Teams that skip straight to behavioral scoring end up beautifully prioritizing a list of accounts that were never going to buy.
How do you build your own firmographic segments from scratch?#
1. Start from closed-won, not from ambition. Pull your last 50–200 closed deals. If you have fewer than 30, use your best-fit customers plus your best-fit lost deals and accept that the model is a hypothesis, not a finding.
2. Enrich the list before you analyze it. Your CRM's industry field is almost certainly garbage — free-text entry, inconsistent labels, 40% blank. Run the domain list through an enrichment pass so every account has a consistent industry code, headcount, and location. Tomba's data enrichment and domain search will fill company-level attributes and surface the contacts attached to them in one pass.
3. Cut on one variable at a time. Win rate by headcount band. Then by industry. Then by geography. You are looking for a band where win rate is 2x your average. Single-variable cuts first, combinations second — combinations on small samples produce noise that looks like insight.
4. Cap it at five to eight segments. More than eight and no rep will remember them, no marketer will build for them, and the model rots within a quarter. Fewer than three and you have not actually segmented anything.
5. Write a one-line definition per segment that a rep can apply on a discovery call. "US healthcare group, 250–1,000 employees, three or more sites, currently scheduling in spreadsheets or a legacy tool." If it takes a paragraph, it is not a segment — it is a persona essay.
6. Assign a motion and a budget to each tier. Tier 1 gets multi-channel sequences and SDR hours. Tier 2 gets email-only plus retargeting. Tier 3 gets newsletter and nothing else. Write the allocation down, because the default behavior is for reps to drift back to whatever is easiest to reach.

What is the second worked example — small team, no data science?#
The SaaS example assumes 200 deals of history. Most teams do not have that. Second scenario: a nine-person B2B design agency, $40k average project, 26 closed projects total.
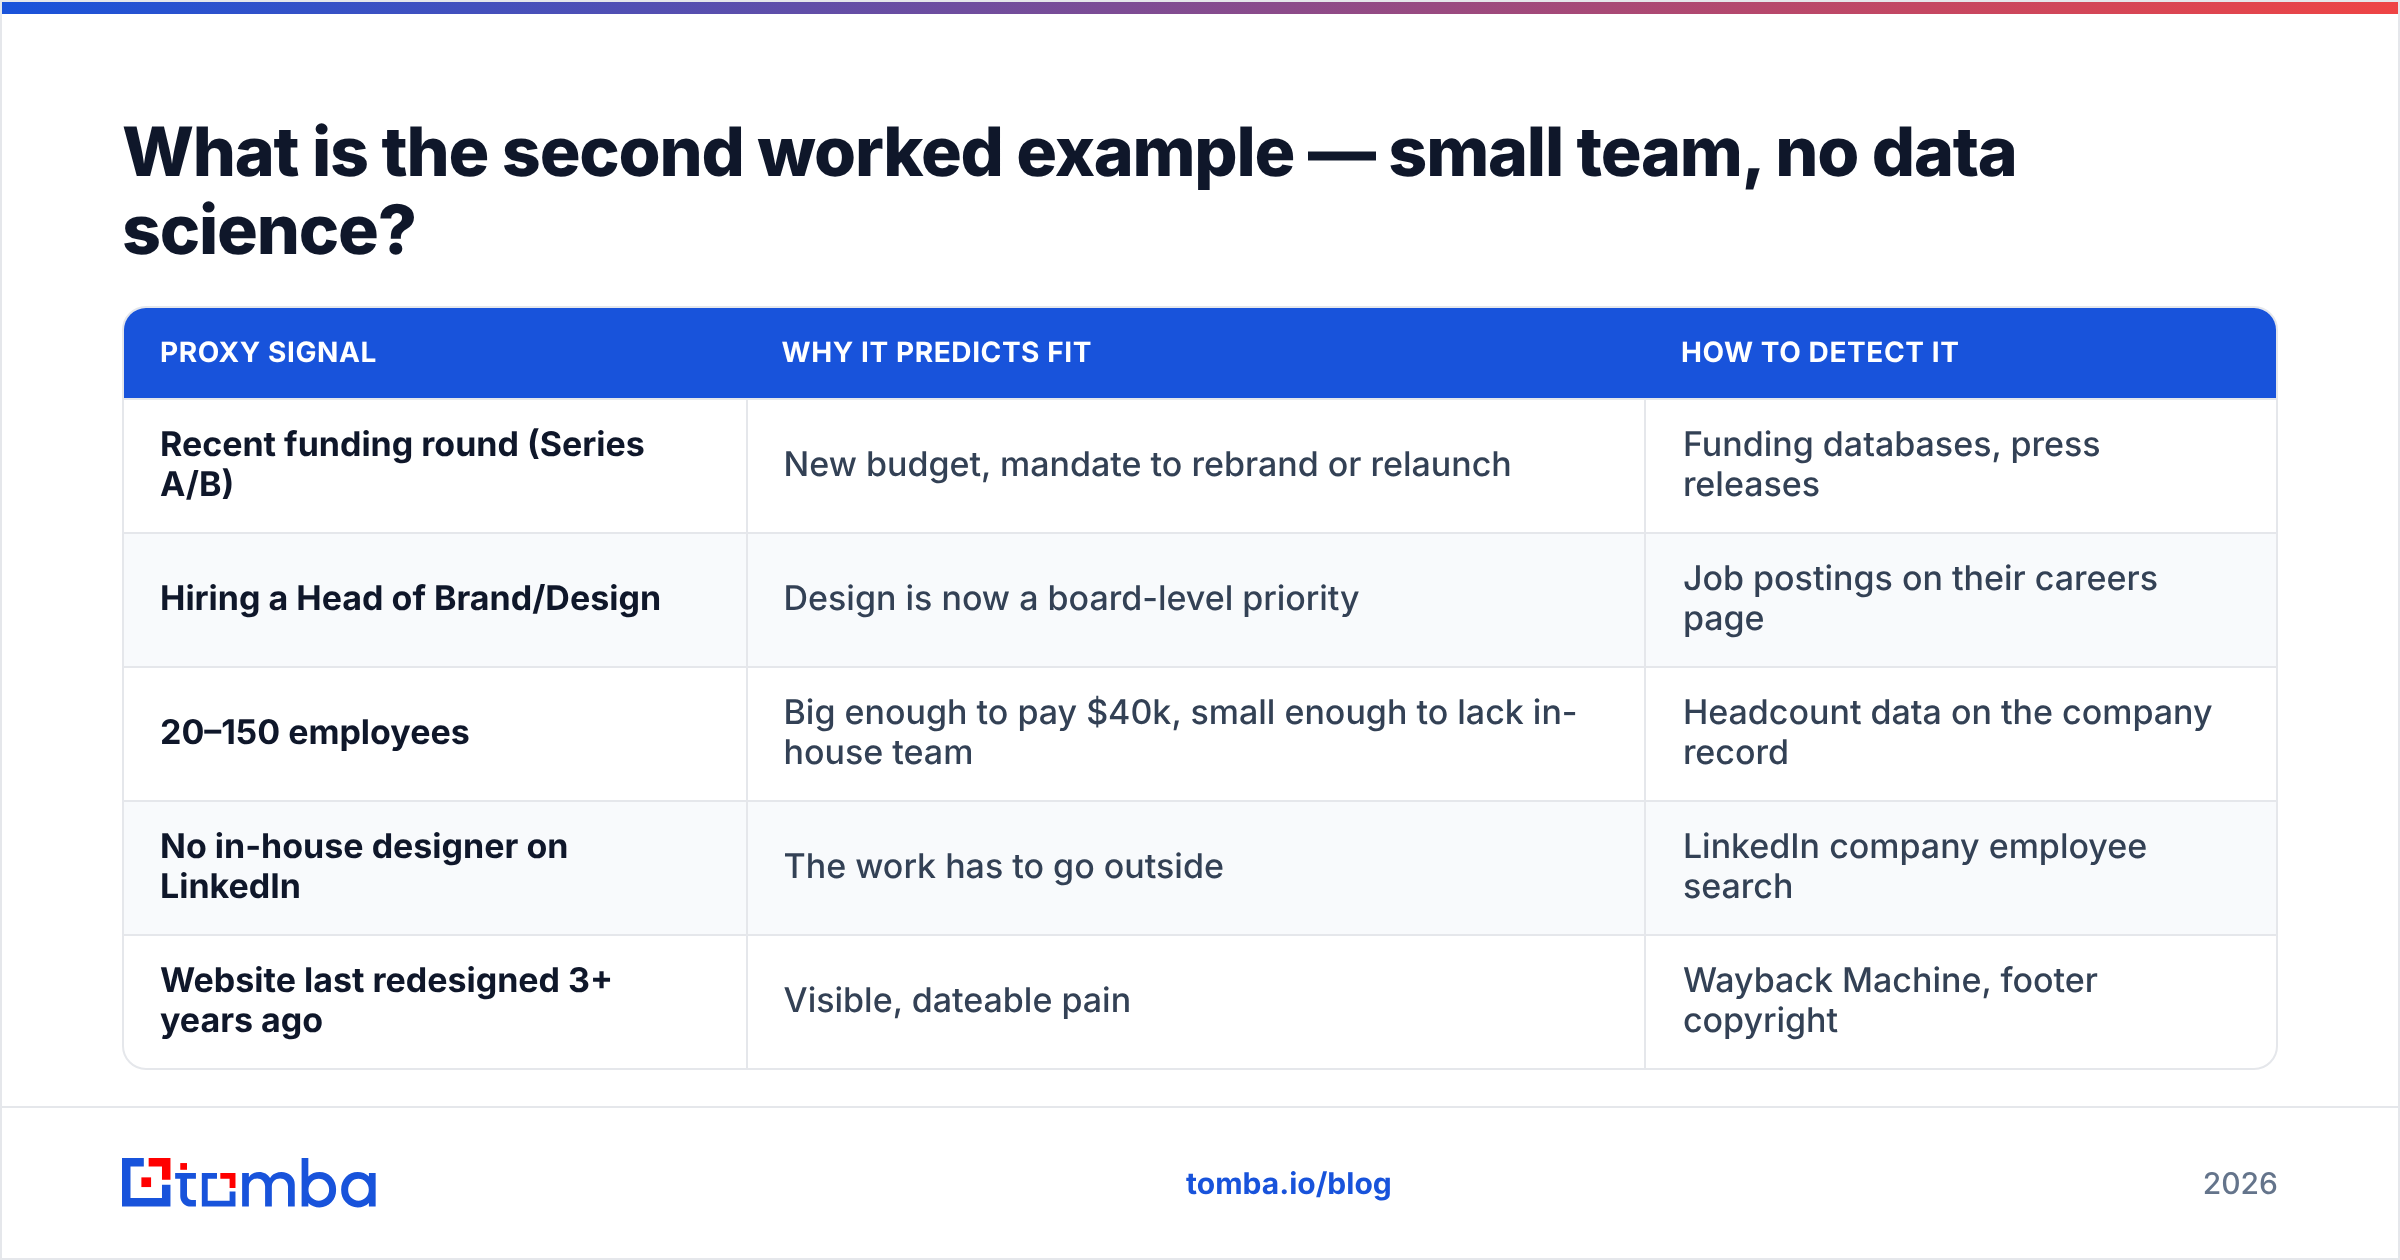
With 26 data points, statistical clustering is meaningless. So invert the process — segment by observable proxy, then validate.
| Proxy signal | Why it predicts fit | How to detect it |
|---|---|---|
| Recent funding round (Series A/B) | New budget, mandate to rebrand or relaunch | Funding databases, press releases |
| Hiring a Head of Brand/Design | Design is now a board-level priority | Job postings on their careers page |
| 20–150 employees | Big enough to pay $40k, small enough to lack in-house team | Headcount data on the company record |
| No in-house designer on LinkedIn | The work has to go outside | LinkedIn company employee search |
| Website last redesigned 3+ years ago | Visible, dateable pain | Wayback Machine, footer copyright |
Three of five signals present means it goes on the target list. That is the whole model. It took an afternoon, it uses zero machine learning, and it outperforms "companies that look like our favorite client."
The agency's segment definitions ended up as: Post-Series-A B2B software, 20–150 people, US or Western Europe, no in-house design lead, site older than three years. One sentence. Every person on the team can apply it.
For validation, they tracked reply rate by proxy count. Accounts with 4–5 signals replied at roughly triple the rate of accounts with exactly 3. That result is what turns a guess into a segment.
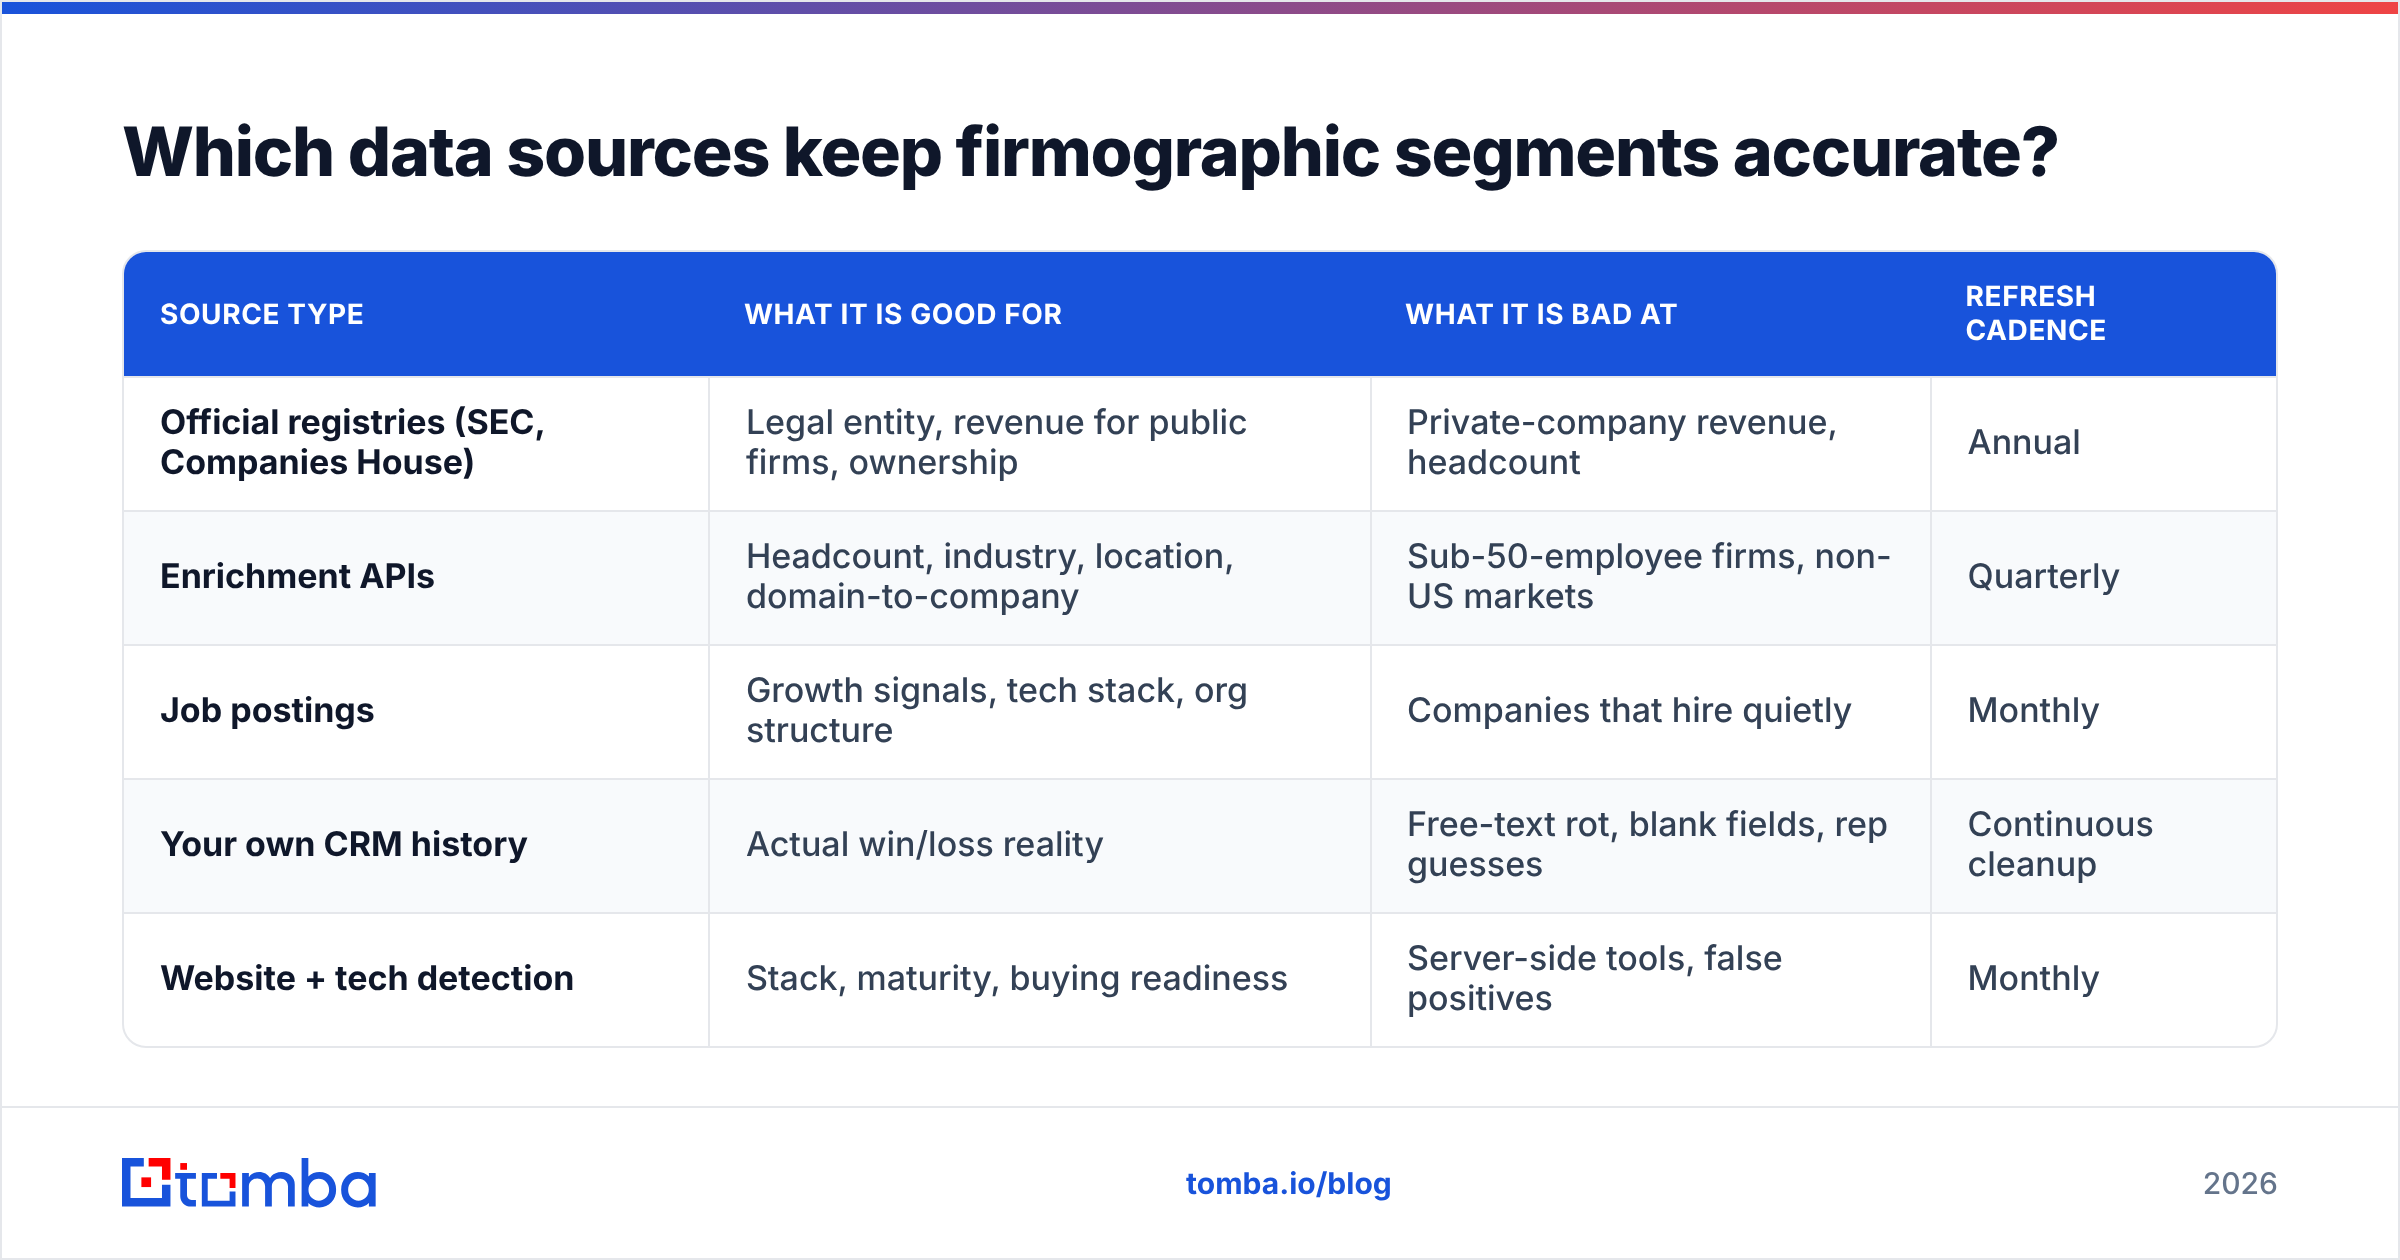
Which data sources keep firmographic segments accurate?#
Segmentation is a data problem wearing a strategy costume. The model is easy. Keeping the underlying fields true is the hard part.
Company data decays continuously — companies get acquired, rebrand, relocate, lay off 30% of staff, or change their entire domain. G2 reviews of account-intelligence tools are full of the same complaint: the enrichment was accurate at purchase and stale by renewal. Industry estimates commonly put B2B database decay in the 25–30% per year range, and contact-level decay is worse than company-level decay.
Practical countermeasures:
| Source type | What it is good for | What it is bad at | Refresh cadence |
|---|---|---|---|
| Official registries (SEC, Companies House) | Legal entity, revenue for public firms, ownership | Private-company revenue, headcount | Annual |
| Enrichment APIs | Headcount, industry, location, domain-to-company | Sub-50-employee firms, non-US markets | Quarterly |
| Job postings | Growth signals, tech stack, org structure | Companies that hire quietly | Monthly |
| Your own CRM history | Actual win/loss reality | Free-text rot, blank fields, rep guesses | Continuous cleanup |
| Website + tech detection | Stack, maturity, buying readiness | Server-side tools, false positives | Monthly |
Two habits keep this from collapsing:
Never let reps free-text a segment field. Picklists only, sourced from enrichment. The moment "Healthcare," "healthcare," "Health Care," and "HC" coexist in one column, your segment reporting is fiction.
Re-enrich Tier 1 quarterly, Tier 2 and 3 semi-annually. Bulk operations make this cheap — running a whole account list through a bulk email finder and re-verifying contacts costs less than one wasted SDR week. Pair it with an email verifier pass so the contacts attached to each segment stay deliverable, not just the company attributes.
If your segments are correct but your contact data is dead, you have built a beautiful map to an empty building.
What are the most common firmographic segmentation mistakes?#
Segmenting by what you can measure instead of what predicts revenue. Headcount is easy to pull, so people build the entire model on headcount. If your product's real cut-line is "companies with a distributed field workforce," headcount is at best a weak proxy for it.
Confusing segments with personas. A segment is a group of companies. A persona is a type of human inside them. "VP of Operations at a mid-market logistics firm" is both — and treating it as one object means you cannot size your TAM or route your territories.
Building segments no one operationalizes. If the segment does not appear as a field in the CRM, a filter in the sequencer, and a line in the pipeline report, it will be quietly abandoned within six weeks. Wire it into the systems the day you define it — most CRM platforms let you add a segment picklist and a scoring formula field in under an hour.
Freezing the model. Your best segment in 2024 may be saturated by 2026. Re-run the win-rate analysis every two quarters. The output is often "Tier 2 became Tier 1," and that reallocation is worth more than any new tactic.
Over-segmenting to look rigorous. Fourteen segments with four accounts each is not precision, it is decoration. Collapse until every segment has enough accounts to support a real campaign.
Ignoring negative segments. Write down who you do not sell to and enforce it. A defined disqualification list — wrong geography, under 20 employees, regulated industries you cannot support — saves more SDR hours than any positive segment creates.
How do you turn segments into actual outreach?#
Once the tiers exist, the workflow is mechanical:
- Filter your TAM by the Tier 1 definition — industry code, headcount band, geography. You now have a domain list.
- Find the right roles at each domain. Segment defines the company; role defines the human. Use a domain search to pull the operations, revenue, or IT contacts at each account depending on which committee that segment brings to the table.
- Verify before you send. Segment quality means nothing if 22% of the list bounces and your sending domain takes the hit.
- Write one sequence per segment, not per account. The segment definition already contains the pain hypothesis — "you run three or more sites and schedule in spreadsheets" is the first line of the email.
- Report reply and win rate by segment. This closes the loop and feeds the next quarterly re-scoring.
Tools worth knowing here: HubSpot handles the CRM-side segment fields and list logic well for mid-market teams, and peer data providers like BookYourData are a solid option when you need pre-built firmographic lists rather than enriching your own. Both slot cleanly next to a finder-and-verifier layer.
Ready to build segments on real data?#
A firmographic model is only as good as the company and contact records feeding it. Start by picking your Tier 1 definition, pulling the matching domains, and filling in the contacts — the Tomba Email Finder resolves names and roles to verified professional addresses across those accounts, with a free tier at 25 searches a month and paid plans from $49/mo on Tomba pricing when you are ready to run the whole list. Build the segment, enrich it, verify it, then send — in that order.
Related guides#
Ready to find emails that actually work?
Join 150,000+ professionals who stopped guessing and started sending. Free credits on signup — no credit card required.
Get the Tomba newsletter
Practical outbound tactics and product updates — once every two weeks.
About the author