Firmographic Targeting: How to Build B2B Lists That Convert
Firmographic targeting is the difference between a 2% reply rate and a 12% one. Here is how to pick the right attributes, source clean data, and build segments that your reps actually want to call.
TL;DR
- Firmographic targeting segments companies by observable business attributes — industry, employee count, revenue, location, ownership, growth stage — so you contact accounts that structurally resemble your best customers.
- The four attributes that predict win rate most reliably in B2B are employee count in the buying department, revenue band, tech stack fit, and growth signal — not the broad industry code most teams start with.
- Stale firmographics are the real killer. Employee counts and funding stages decay roughly 20–30% per year, so a list built in 2024 is materially wrong today.
- Firmographic filters get you the account. You still need contact-level data — verified emails, direct dials, role seniority — before anything happens.
- Build tiers, not one giant list: Tier 1 (perfect fit, high effort), Tier 2 (good fit, automated), Tier 3 (nurture only). Different tiers deserve different amounts of your rep's time.
Most outbound teams say they do firmographic targeting. What they actually do is pick two dropdown filters in a data tool — "Software" and "50–200 employees" — export 40,000 rows, and wonder why replies are flat. That is not targeting. That is a demographic guess with a CSV attached.
This guide covers what firmographic targeting actually is, which attributes matter, how to source and refresh the data, and how to turn segments into a list your reps will not quietly ignore.
What is firmographic targeting?#
Firmographic targeting is account selection based on the observable characteristics of a company, the same way demographic targeting works for consumers. If demographics describe a person (age, income, location), firmographics describe an organization.
The classic attribute set comes out of market segmentation research and has been stable for decades:
- Industry / vertical — what the company sells, usually captured as NAICS, SIC, or a vendor's proprietary taxonomy.
- Company size — headcount, and increasingly headcount within a specific function (how many engineers, how many AEs).
- Revenue — annual revenue band, or funding raised for private companies without disclosed revenue.
- Location — HQ country, region, or the set of countries where they actually operate.
- Ownership and structure — private, public, PE-backed, VC-backed, subsidiary, franchise.
- Growth stage and trajectory — headcount growth over 12 months, recent funding round, recent M&A.
Firmographics answer which companies. They do not answer which person or why now. That distinction matters, because most "our targeting is broken" complaints are actually contact-data problems or timing problems wearing a firmographic costume.

How firmographics differ from the other data types#
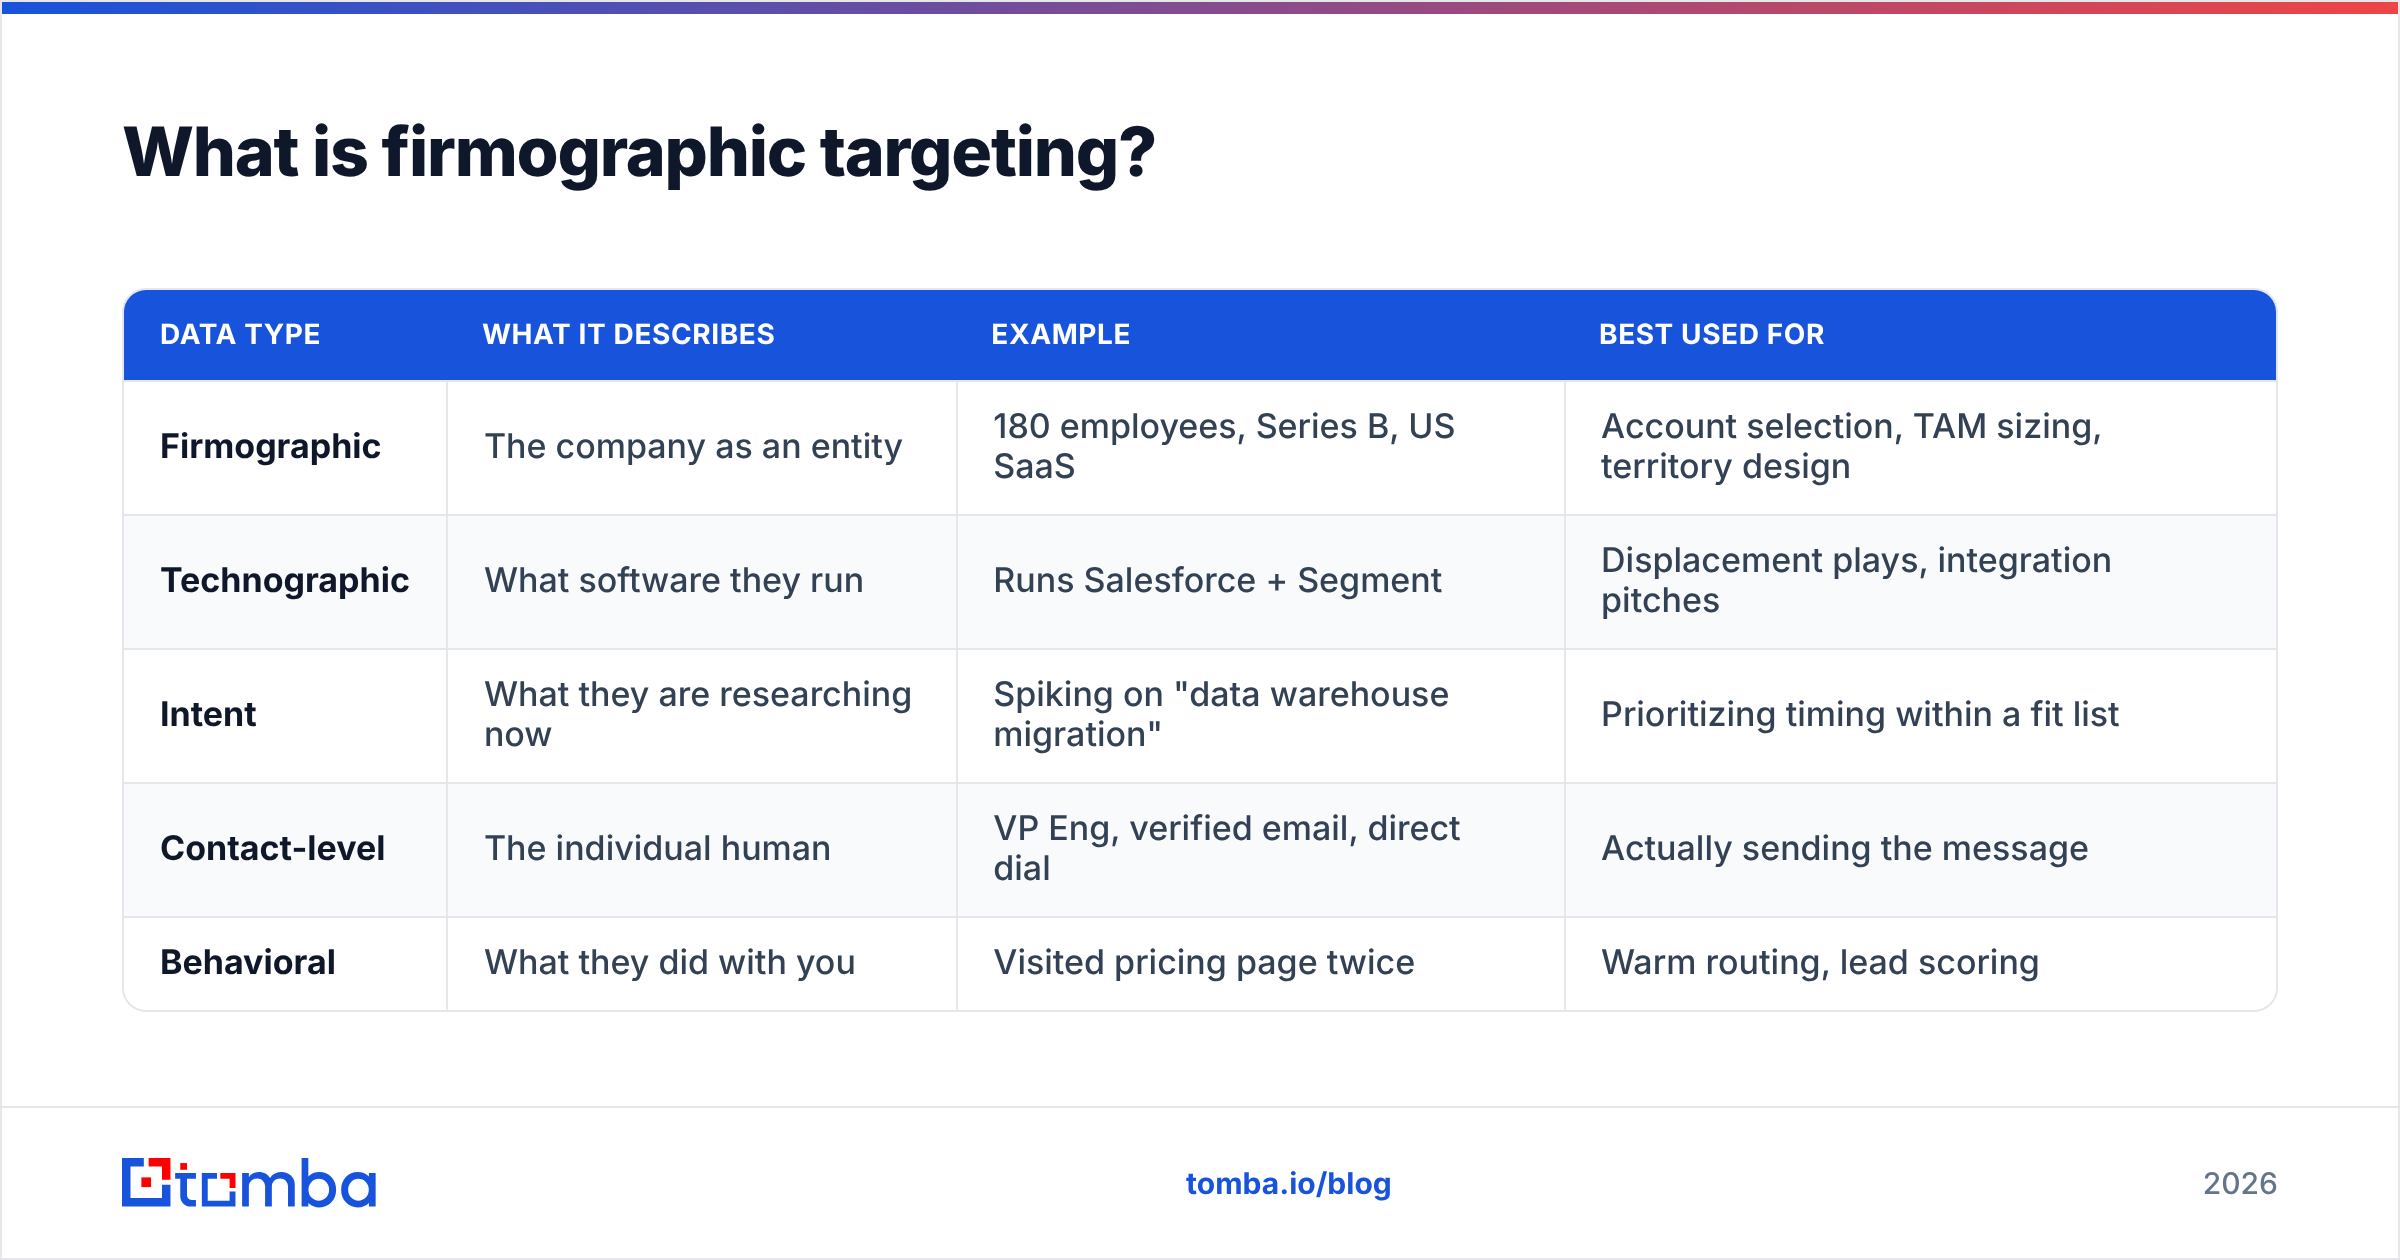
| Data type | What it describes | Example | Best used for |
|---|---|---|---|
| Firmographic | The company as an entity | 180 employees, Series B, US SaaS | Account selection, TAM sizing, territory design |
| Technographic | What software they run | Runs Salesforce + Segment | Displacement plays, integration pitches |
| Intent | What they are researching now | Spiking on "data warehouse migration" | Prioritizing timing within a fit list |
| Contact-level | The individual human | VP Eng, verified email, direct dial | Actually sending the message |
| Behavioral | What they did with you | Visited pricing page twice | Warm routing, lead scoring |
A functioning go-to-market motion uses all five. Firmographics are the foundation layer — cheapest to acquire, most stable, and the one that determines whether the other four are even worth buying for a given account.
Which firmographic attributes actually predict revenue?#
Here is where most ICP documents go wrong: they list every attribute the data vendor offers instead of the handful that correlate with closed-won.
Run this analysis on your own CRM before you touch a filter. Export closed-won deals from the last 18 months, export closed-lost, and compare attribute distributions. Attributes where won and lost look identical are decoration. Attributes where they diverge sharply are your real ICP.
In practice, four categories tend to separate winners from noise:
- Functional headcount, not total headcount. "200 employees" tells you almost nothing. "12 people in RevOps" tells you whether the pain you solve exists yet. A 3,000-person manufacturer with two marketers is a worse fit for a marketing tool than a 60-person agency with fifteen.
- Revenue per employee. This one is underused. It proxies for business model — a $400K/employee company is likely software or services with budget flexibility; a $90K/employee company is likely labor-heavy with tighter procurement. Your pricing tolerance maps to this number more cleanly than to industry.
- Growth trajectory over the last 12 months. Companies that grew headcount 30%+ buy new categories. Companies that shrank are consolidating vendors, not adding them. This single filter often doubles reply rates because it correlates with budget availability and organizational change.
- Technology adjacency. If your product integrates with or replaces something, presence of that something is a stronger predictor than industry. A company running the CRM you integrate with is a qualified account regardless of vertical.
Notice what is missing: broad industry code. NAICS and SIC classifications were designed for government statistical reporting in an era when companies did one thing. They break badly on modern businesses — a fintech that sells software is variously coded as finance, software, or business services depending on who classified it. Use industry as a coarse exclusion filter ("not government, not education"), not as your primary segmentation axis.
The attributes worth filtering on, ranked#
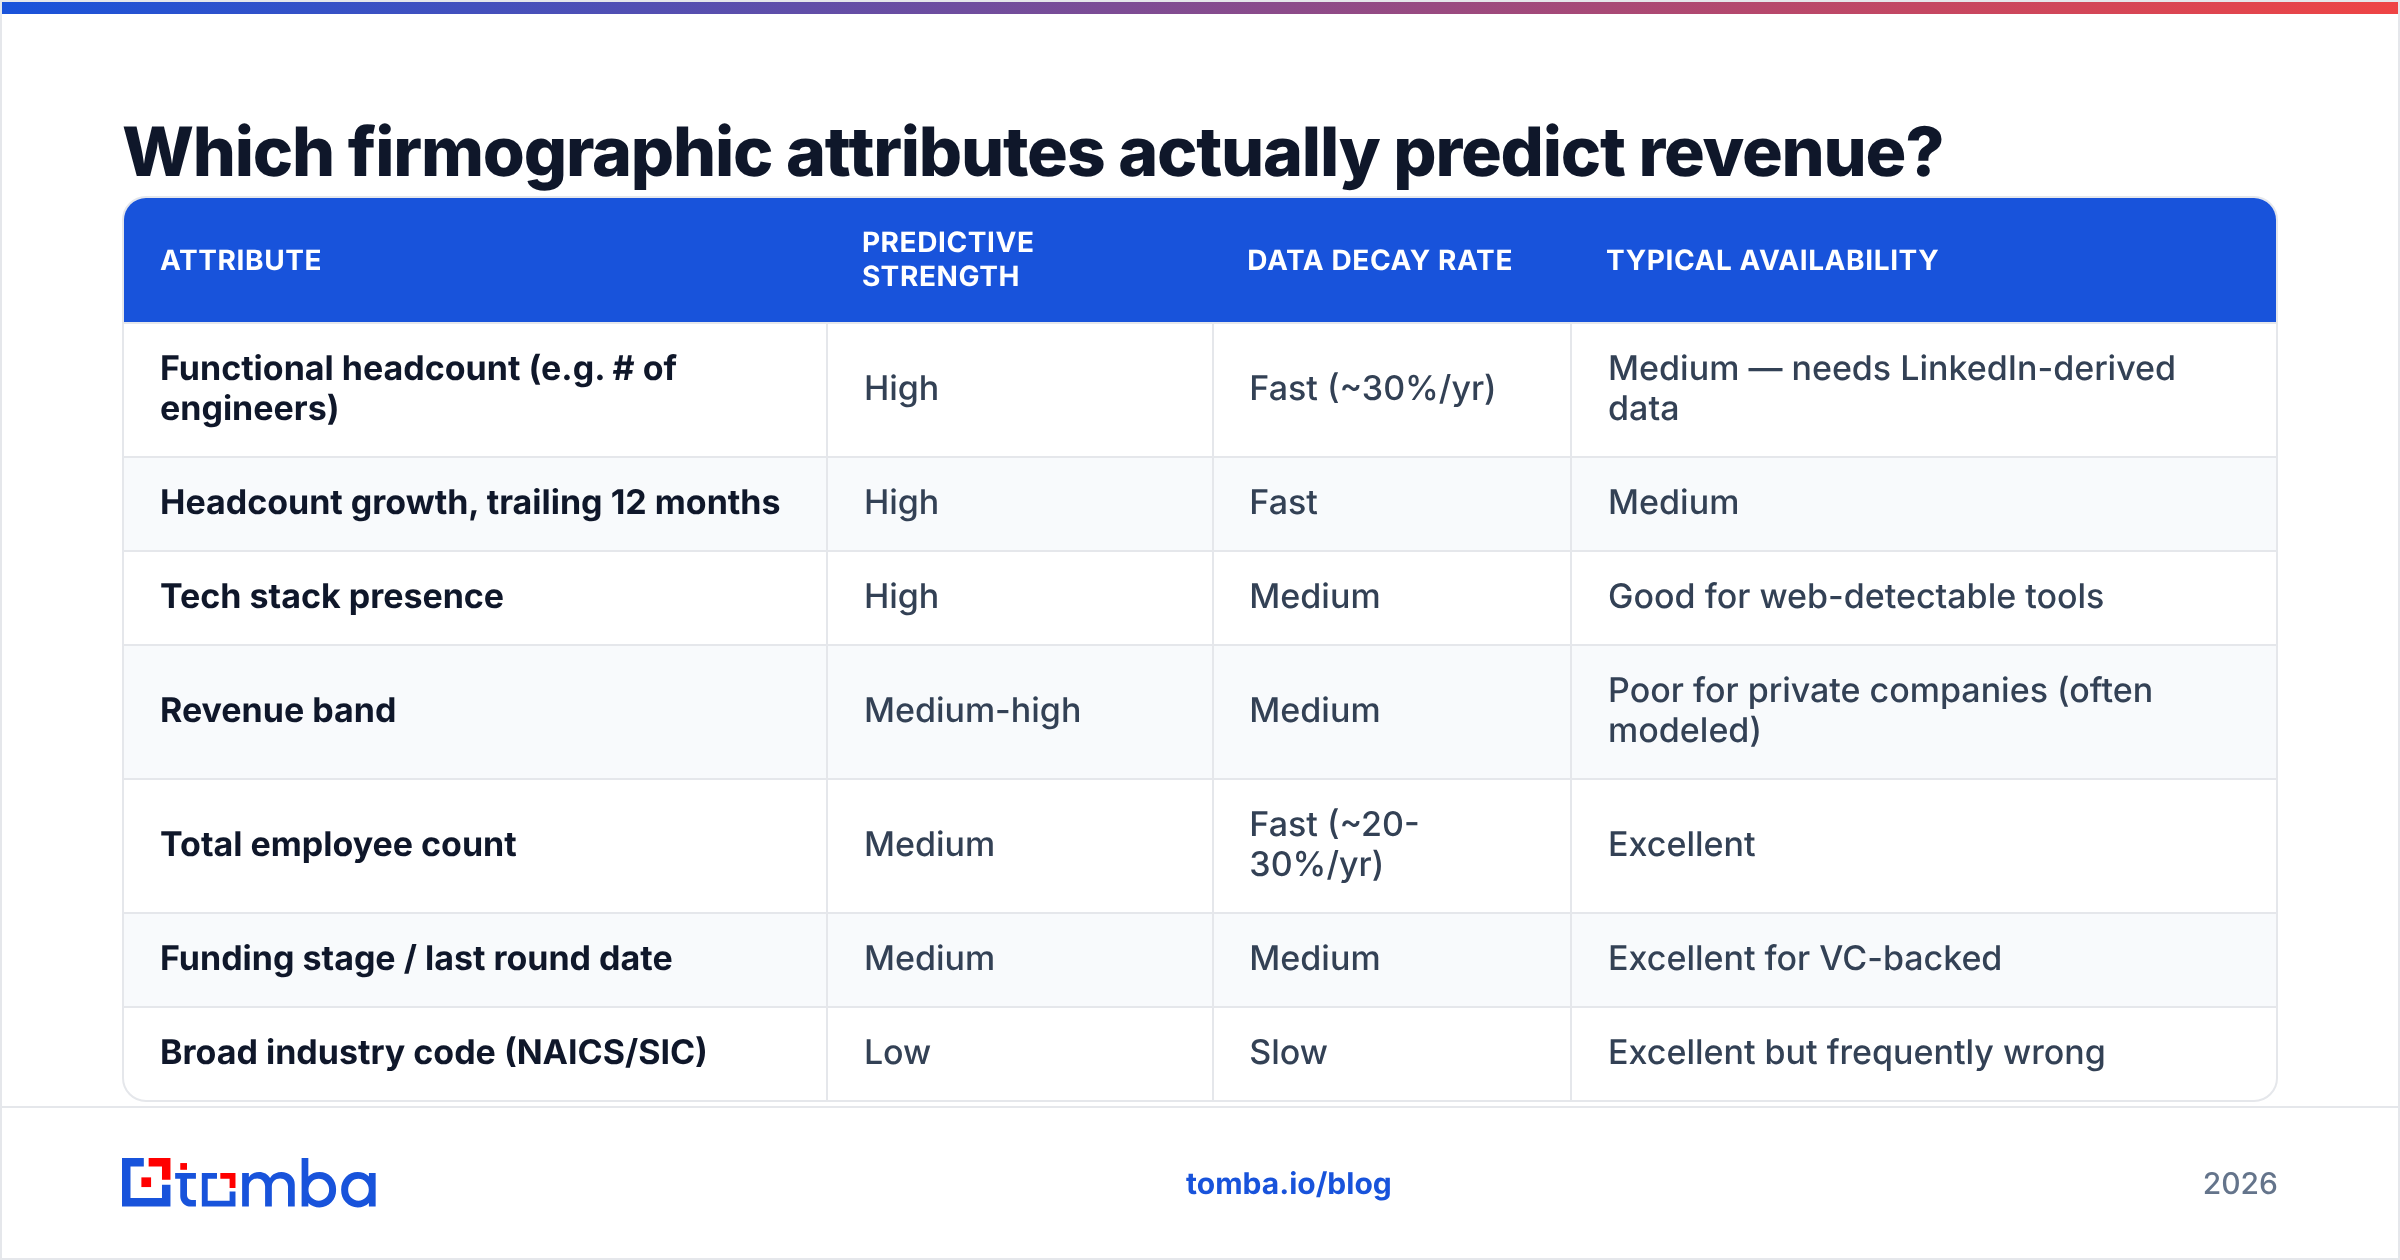
| Attribute | Predictive strength | Data decay rate | Typical availability |
|---|---|---|---|
| Functional headcount (e.g. # of engineers) | High | Fast (~30%/yr) | Medium — needs LinkedIn-derived data |
| Headcount growth, trailing 12 months | High | Fast | Medium |
| Tech stack presence | High | Medium | Good for web-detectable tools |
| Revenue band | Medium-high | Medium | Poor for private companies (often modeled) |
| Total employee count | Medium | Fast (~20-30%/yr) | Excellent |
| Funding stage / last round date | Medium | Medium | Excellent for VC-backed |
| Broad industry code (NAICS/SIC) | Low | Slow | Excellent but frequently wrong |
| HQ country | Low-medium | Very slow | Excellent |
The pattern: the attributes that predict best are the ones that decay fastest and are hardest to source. That is not a coincidence. Easy, stable attributes are easy for your competitors too, so they carry no edge.
How do you build a firmographic segment that reps will actually work?#
Start from customers, not from filters. The sequence:
Step 1 — Define the reference set. Pull your 30–50 best customers by a real quality metric: net revenue retention, expansion, time-to-value, or gross margin. Not just logo count. If you have fewer than 20 customers, use closed-won opportunities plus your best-fit active pipeline.
Step 2 — Enrich them fully. You cannot find patterns in fields you do not have. Run the reference set through data enrichment to fill in headcount, tech stack, funding, and location before you analyze. Missing data reads as "no pattern" when the pattern is just invisible.
Step 3 — Find the divergence. Compare the reference set against a random sample of your closed-lost. Look for attributes where the distributions actually separate. Two or three usually do. Those become your Tier 1 definition.
Step 4 — Size the market. Apply your Tier 1 definition to a B2B database and count. If Tier 1 returns 200 accounts, you have a named-account motion, not an outbound-volume motion — staff accordingly. If it returns 90,000, your definition is too loose and you have not actually segmented anything.
Step 5 — Tier the rest. Tier 2 = matches two of three core attributes. Tier 3 = matches one, or matches on fit but shows negative growth. Assign effort proportionally: Tier 1 gets personalized multichannel sequences and research, Tier 2 gets templated sequences with a personalized first line, Tier 3 gets newsletter and content only.
Step 6 — Get to contacts. A segmented account list is inert until you have people to reach. Use domain search to pull the contact map for each target company, then filter by department and seniority against the buying committee you identified in step 1.
What good tiering looks like in practice#
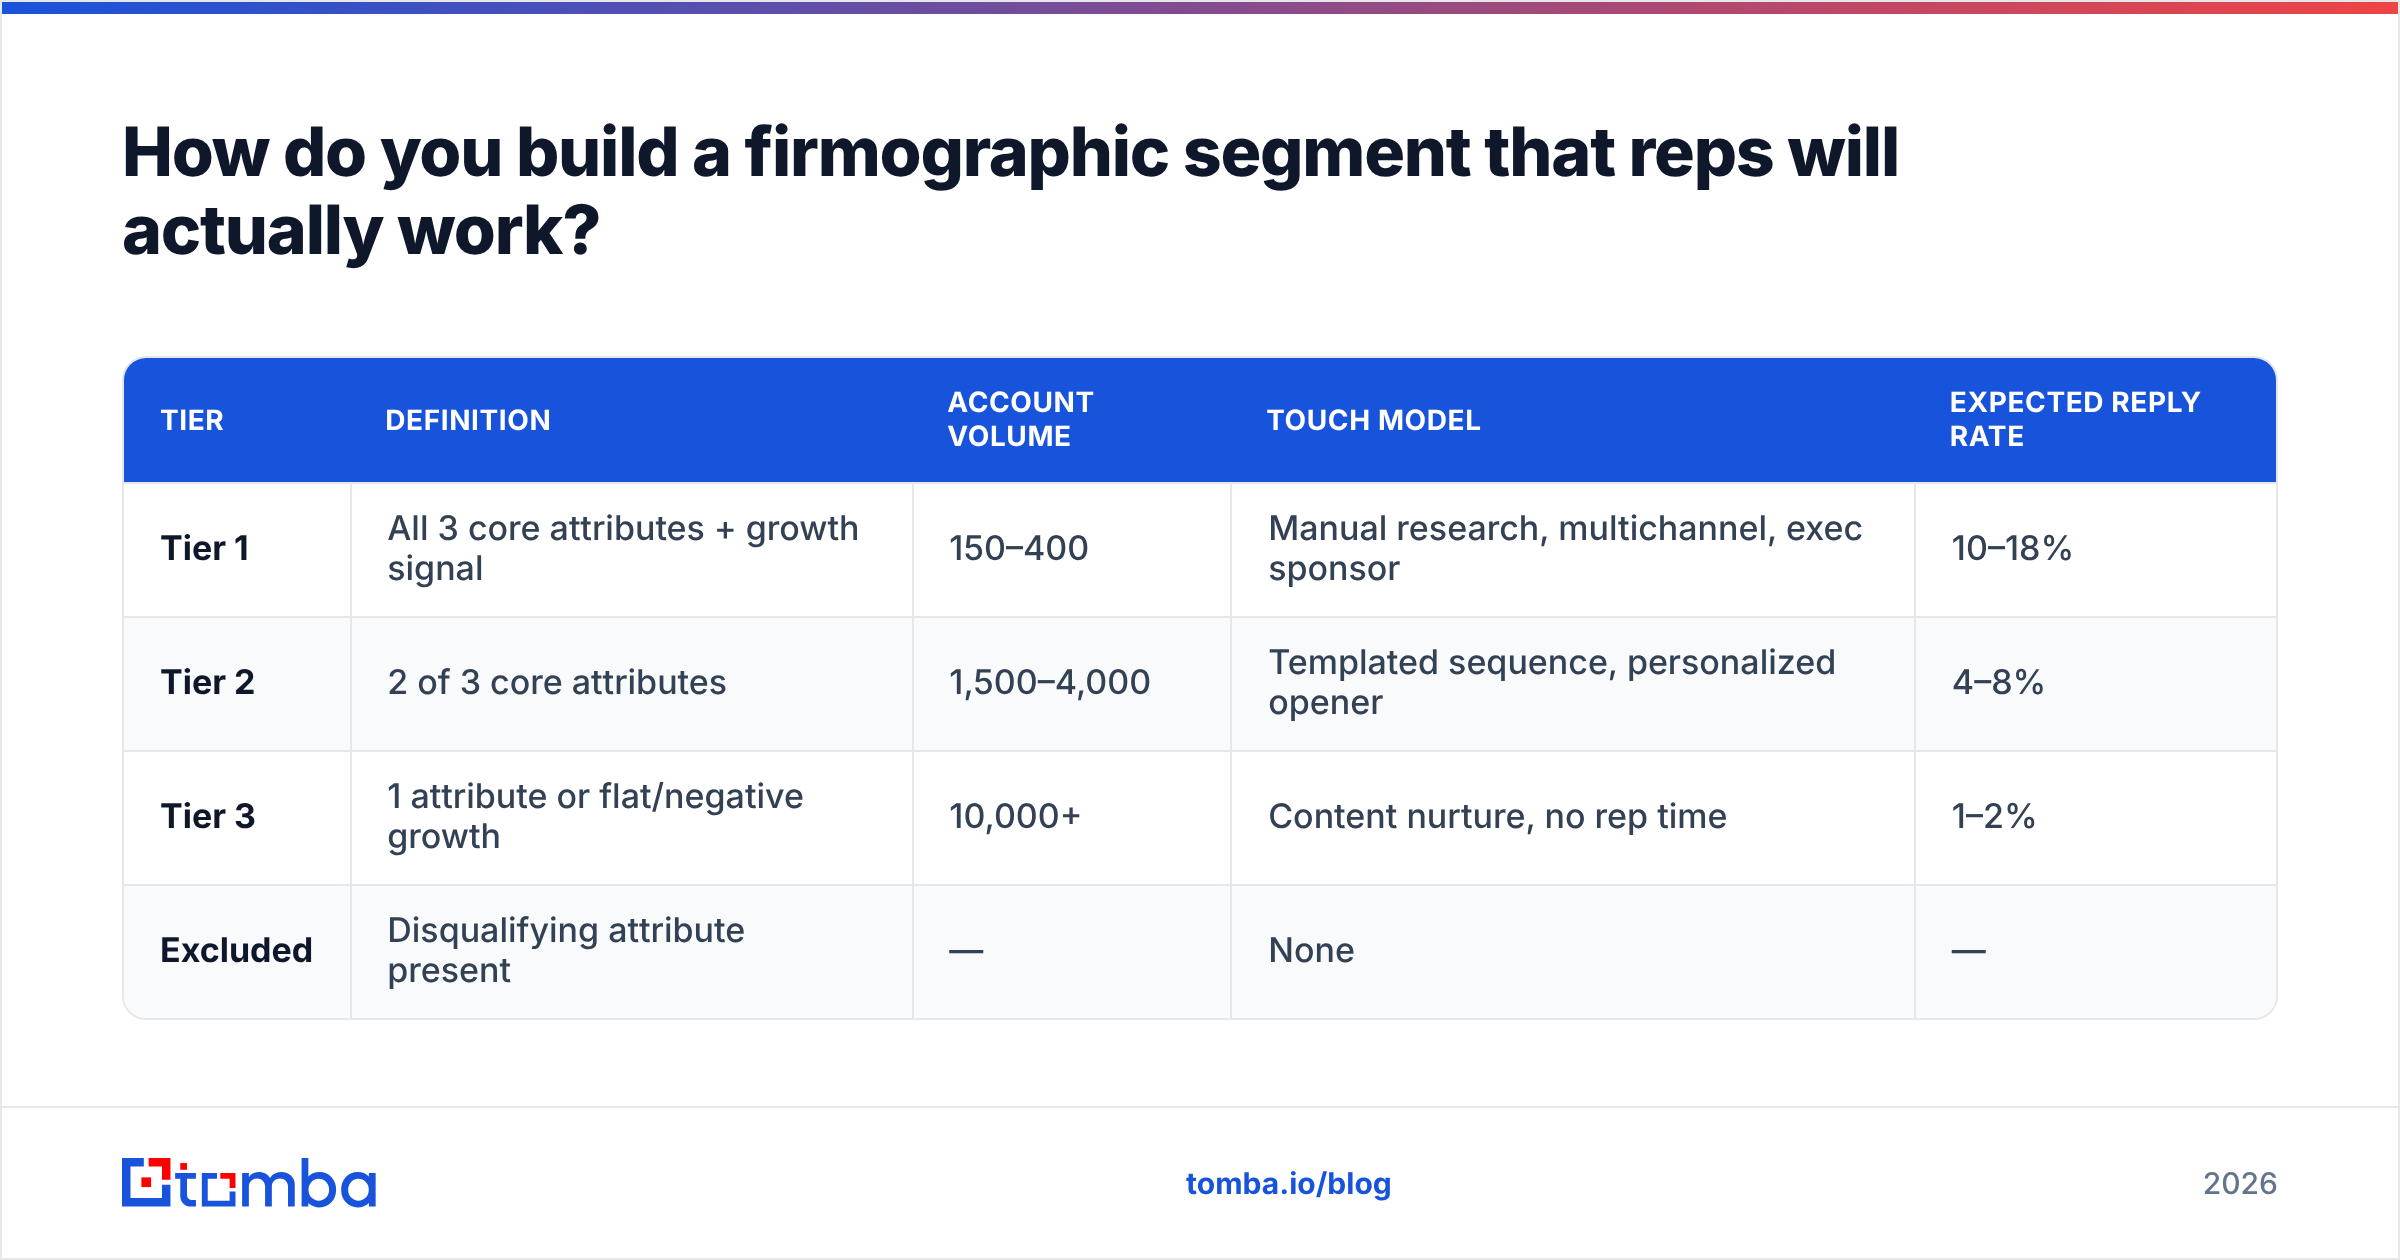
| Tier | Definition | Account volume | Touch model | Expected reply rate |
|---|---|---|---|---|
| Tier 1 | All 3 core attributes + growth signal | 150–400 | Manual research, multichannel, exec sponsor | 10–18% |
| Tier 2 | 2 of 3 core attributes | 1,500–4,000 | Templated sequence, personalized opener | 4–8% |
| Tier 3 | 1 attribute or flat/negative growth | 10,000+ | Content nurture, no rep time | 1–2% |
| Excluded | Disqualifying attribute present | — | None | — |
That last row matters as much as the first. Explicit exclusions — company size below your minimum viable deal, industries with procurement cycles you cannot survive, geographies you cannot support — save more wasted rep hours than any positive filter.
Where does firmographic data come from, and how bad is it?#
Three sources, three failure modes.
Self-reported data (company websites, LinkedIn pages, funding announcements) is the most current but the least consistent. A startup's LinkedIn headcount includes contractors and advisors; its "About" page says a different number.
Registry and filing data (business registries, SEC filings, credit bureaus) is authoritative but slow — often 6–18 months behind reality, and largely useless for private companies outside a handful of markets.
Modeled and inferred data is where most vendors quietly live. Revenue for private companies is almost always modeled from headcount and industry averages. It is a reasonable estimate, not a fact. Treat any revenue figure for a private company as a band, never a number.
The honest summary: firmographic databases are good at existence and identity (this company exists, here is its domain), decent at size and location, and weak at anything financial for private companies. Independent review sites like G2 show the same complaint pattern across every major vendor — coverage is fine, freshness is the problem.

Two operational rules follow:
- Refresh on a schedule, not on a whim. Re-enrich Tier 1 quarterly and Tier 2 semi-annually. Headcount and funding stage move fast enough that annual refresh means half your list is describing a company that no longer exists in that form.
- Verify contacts at send time, not at build time. Firmographic data going stale costs you relevance. Contact data going stale costs you deliverability, which is far more expensive. Run addresses through an email verifier immediately before a send, not when you first exported them. See the email deliverability fundamentals if you need the reasoning on why bounce rates compound.
How do firmographic targeting tools compare?#
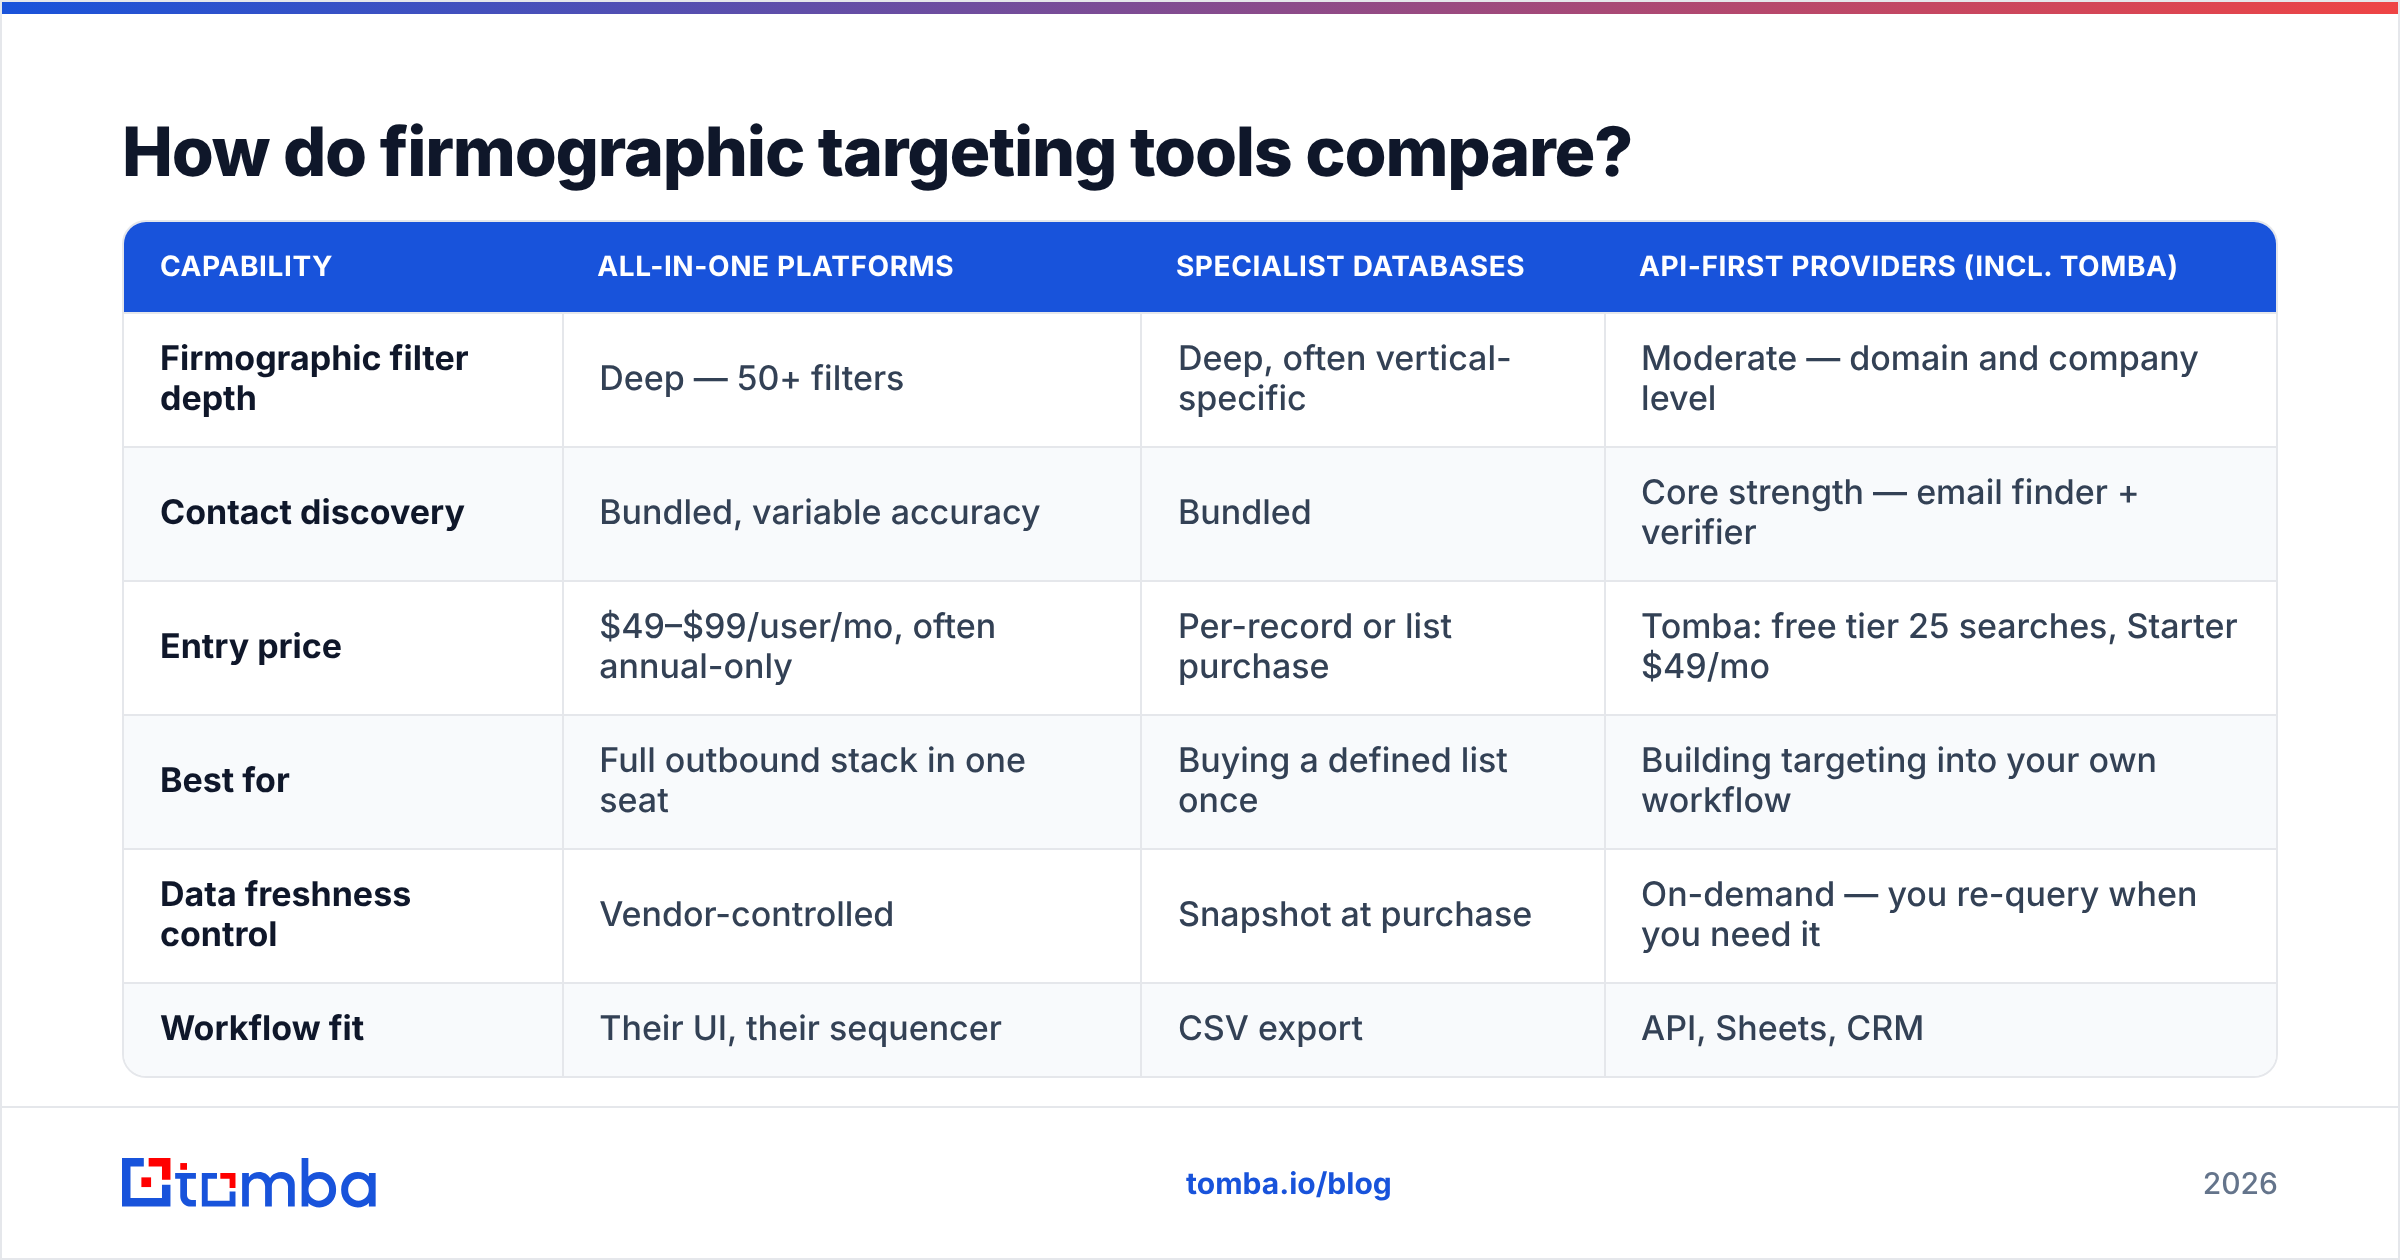
The market splits into three shapes: all-in-one sales platforms, specialist B2B databases, and API-first data providers. They are priced and built for different jobs.
| Capability | All-in-one platforms | Specialist databases | API-first providers (incl. Tomba) |
|---|---|---|---|
| Firmographic filter depth | Deep — 50+ filters | Deep, often vertical-specific | Moderate — domain and company level |
| Contact discovery | Bundled, variable accuracy | Bundled | Core strength — email finder + verifier |
| Entry price | $49–$99/user/mo, often annual-only | Per-record or list purchase | Tomba: free tier 25 searches, Starter $49/mo |
| Best for | Full outbound stack in one seat | Buying a defined list once | Building targeting into your own workflow |
| Data freshness control | Vendor-controlled | Snapshot at purchase | On-demand — you re-query when you need it |
| Workflow fit | Their UI, their sequencer | CSV export | API, Sheets, CRM |
A few honest notes on picking:
- All-in-one platforms (Apollo, ZoomInfo, and peers) win when you want one login and are willing to accept their data as-is. The filter depth is genuinely good. The tradeoff is that you are renting seats, and per-seat pricing punishes teams that want data in a warehouse rather than in a UI.
- Specialist list vendors such as BookYourData are a strong fit when you have a well-defined segment and want a clean, vetted list without committing to a platform subscription. Pay-as-you-go list purchasing is often the cheapest path for a one-off campaign into a specific vertical, and the per-record verification model means you know what you are buying.
- API-first providers fit teams whose targeting logic lives in their own systems — a RevOps team scoring accounts in the warehouse, a growth engineer enriching signups in real time. You supply the segment logic; the provider supplies identity and contact resolution at the account level. This is where Tomba sits: you bring a list of target domains from whatever firmographic source you trust, and Tomba resolves them into verified contacts.
Most mature teams end up with two of the three, not one. A firmographic source for account selection, and a contact-resolution layer for turning accounts into reachable humans.
What are the common firmographic targeting mistakes?#
Confusing TAM with target list. Your total addressable market is a board slide. Your target list is what a rep works this quarter. If they are the same size, one of them is wrong.
Segmenting on industry alone. Already covered, but it bears repeating because it is the single most common error. Industry code is a filter of last resort.
Never revisiting the definition. Your ICP in 2026 is not your ICP from 2024 — your product changed, your pricing changed, your competition changed. Re-run the closed-won analysis every two quarters. Segments that were correct at launch decay just like the data underneath them.
Ignoring negative signals. Recent layoffs, a departing executive sponsor, an acquisition in progress — these are disqualifiers that no positive firmographic filter will catch. Build exclusion logic, not just inclusion logic.
Buying depth you cannot act on. A vendor offering 78 firmographic filters is not eight times better than one offering 10 if your ICP analysis only found three predictive attributes. Filter depth is only valuable in proportion to the analysis behind it.
Treating the account as the target. Companies do not reply to emails. People do. Every firmographic segment needs a matched persona definition — which two or three titles you are actually contacting, and what each one cares about. Without that, you have a well-researched list of strangers. Once you have the account list, pull the people with an email finder and map them to the buying committee roles you already identified.
How do you measure whether your targeting is working?#
Reply rate is the fast signal, but it is noisy — good copy can rescue a bad list for one campaign. Track these instead, segmented by tier:
- Meeting-to-account ratio per tier. If Tier 1 and Tier 2 convert identically, your tiering is not doing anything and you should collapse it or redefine it.
- Opportunity-to-close by segment. The real test. A segment that books meetings but never closes is a targeting failure that reply rate will happily hide from you for a full quarter.
- Bounce rate by data source. Rising bounces on a specific source means that source's freshness is degrading. Cut it before it damages your sender reputation.
- Time-to-first-response by tier. Better-fit accounts respond faster, not just more often. A widening gap between tiers is evidence your segmentation is real.
- Coverage rate. Of your Tier 1 accounts, what percentage do you have at least two verified contacts for? Below 70%, your bottleneck is contact resolution, not targeting.
Research from analyst firms including Gartner has consistently found that B2B buying groups now involve six to ten stakeholders. That has a direct firmographic implication: coverage rate matters more than list size. Three verified contacts inside a perfectly-fit account beat one contact inside thirty mediocre ones.
Getting from segment to conversation#
Firmographic targeting is a filtering discipline, and filtering only pays off if the thing you filter down to is actually contactable. The workflow that holds up: define ICP from closed-won data, tier the market, exclude aggressively, refresh on a schedule, and resolve accounts to verified people right before you send.
That last step is where most of the wasted effort accumulates. You can build a flawless Tier 1 list of 300 accounts and still send into the void if half the addresses were guessed from a pattern and never checked.
Start with your target domains and run them through the Tomba Email Finder. It resolves company domains into named contacts with confidence scores and verification status, so the segment you spent a week defining turns into inboxes that actually receive mail. The free tier gives you 25 searches to test the accuracy on your own accounts before committing, and Tomba pricing starts at $49/mo for Starter when you are ready to run the full list.
Related guides#
Ready to find emails that actually work?
Join 150,000+ professionals who stopped guessing and started sending. Free credits on signup — no credit card required.
Get the Tomba newsletter
Practical outbound tactics and product updates — once every two weeks.
About the author